Jordan Roy-Byrne CMT, MFTA ⛏⛏ Profile picture
Oct 21, 2025 β€’ 9 tweets β€’ 4 min read β€’ Read on X
Tuesday 🧡

Gold is at an Intermediate Term Peak

But Still Has a Very Long Way to to its Secular Peak

Let's Go!
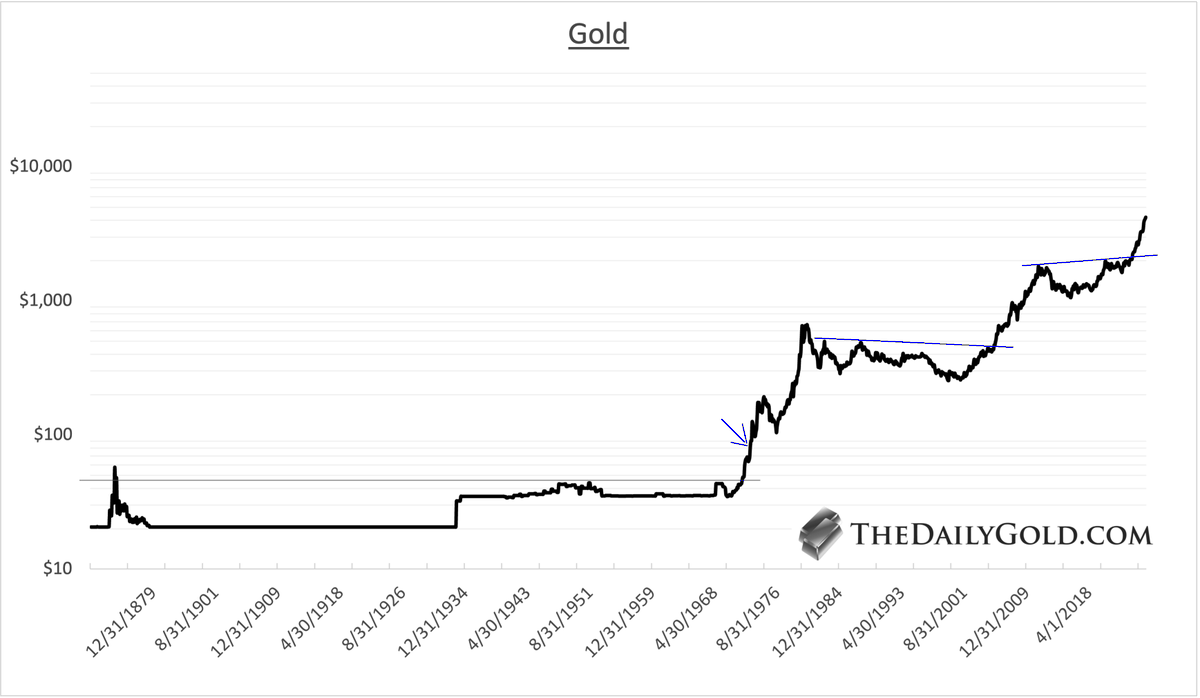
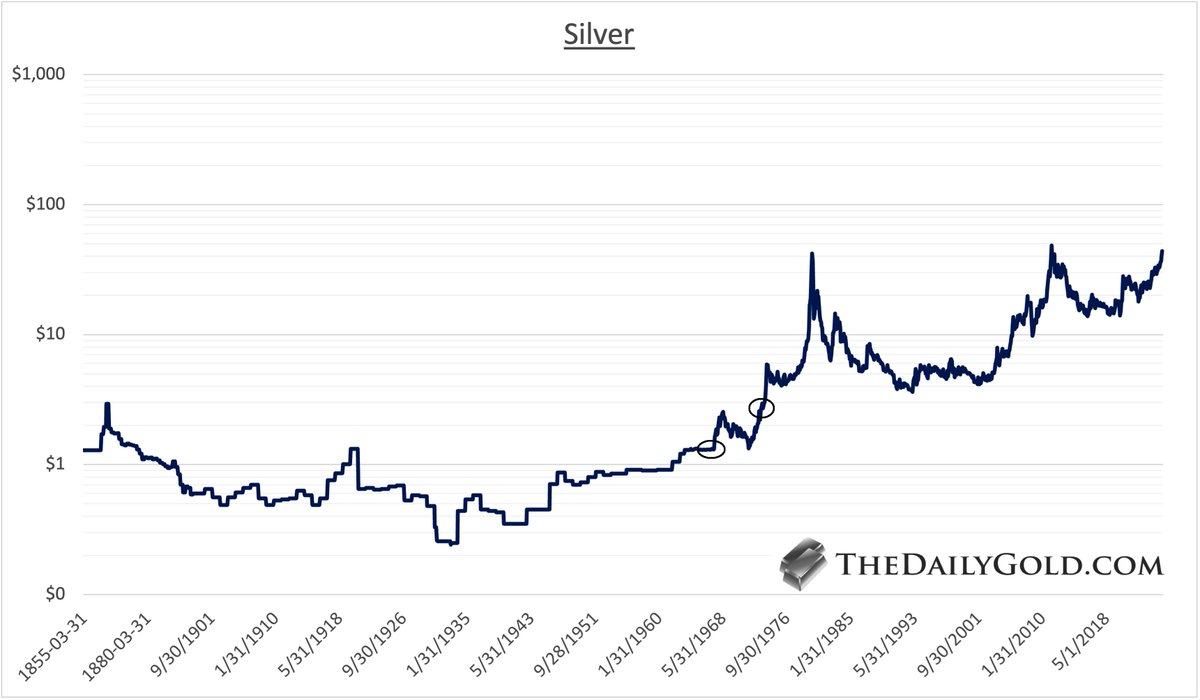
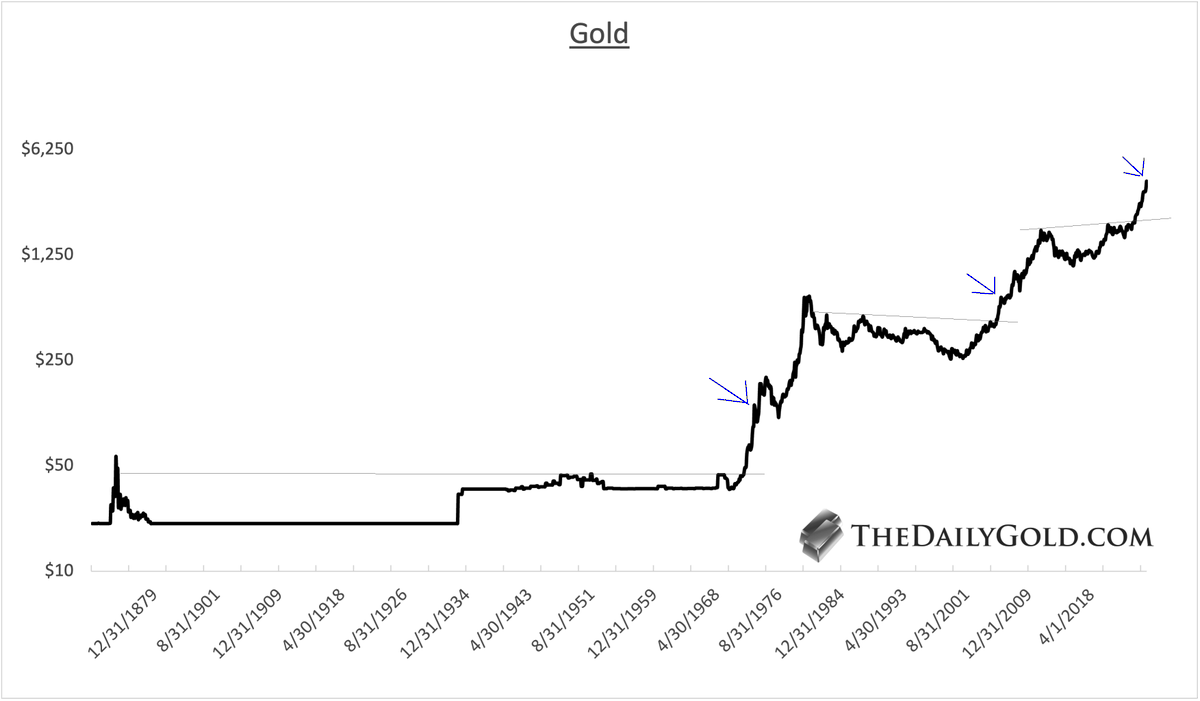
1) First Correction Post-Major Breakout

Gold has begun its first major correction since the major breakout of March 2024.

Gold has had three major breakouts in its history.

1972, 2005 and 2024

The arrows show similar points on this monthly, historical chart. Gold Historical Chart
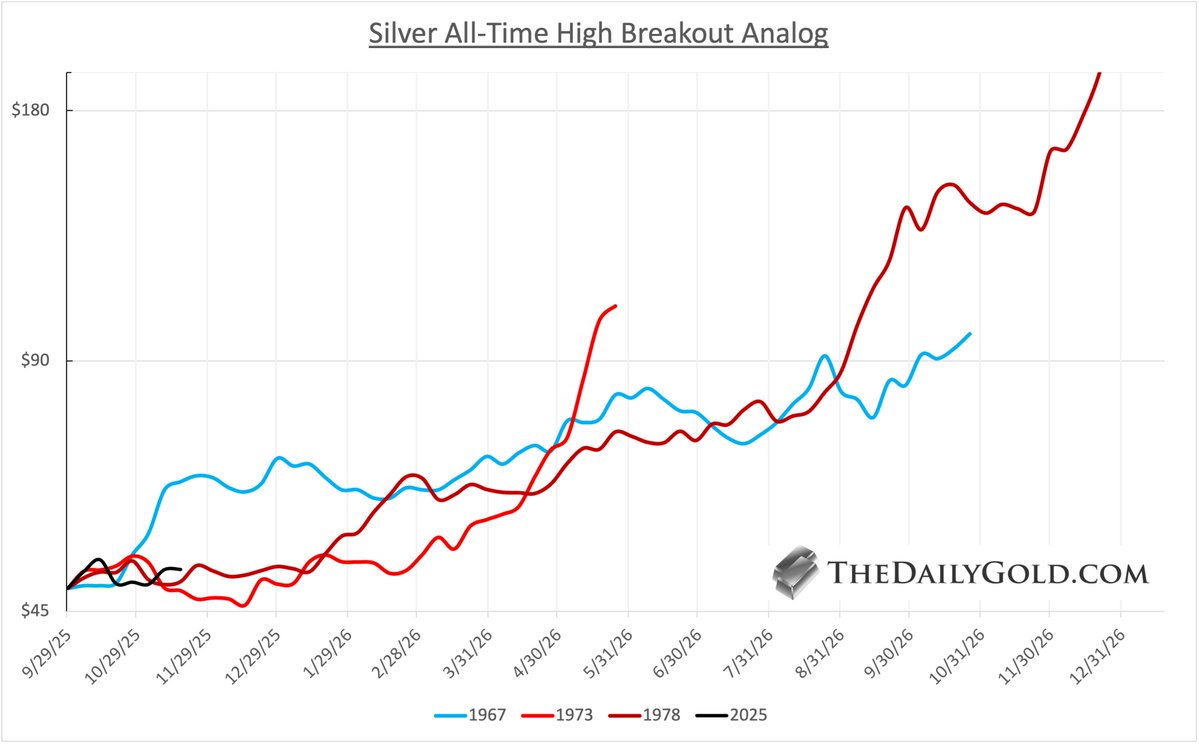
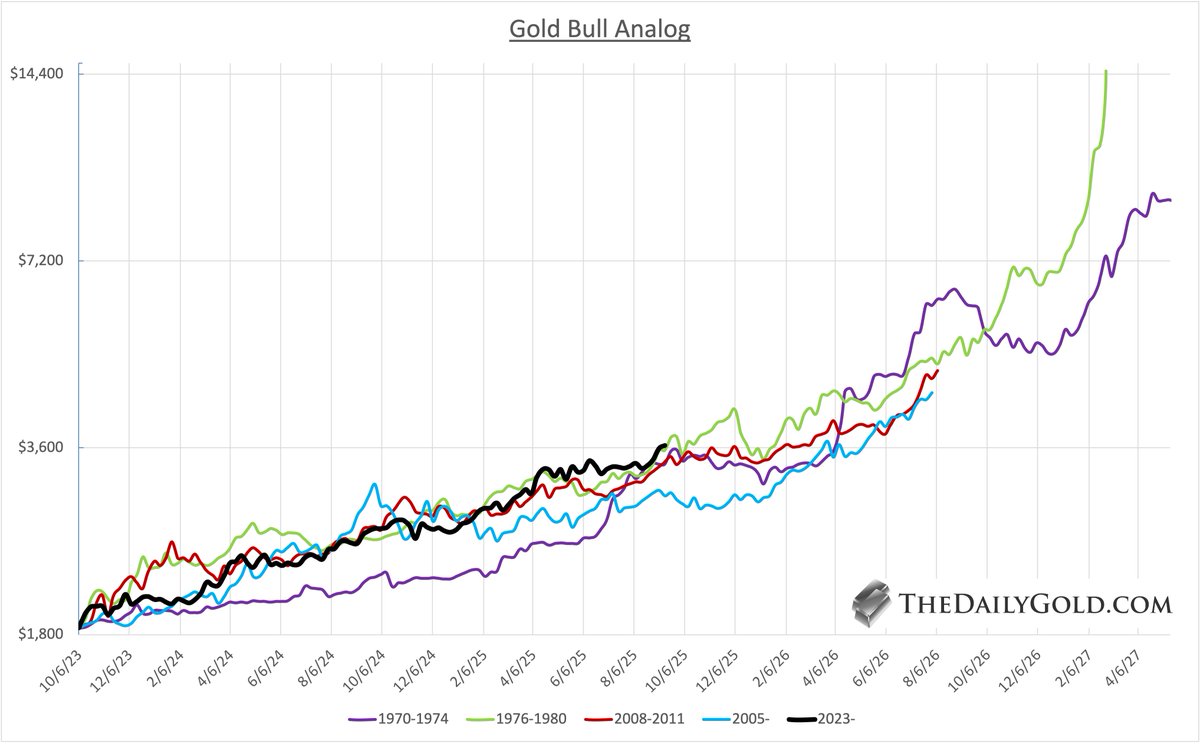
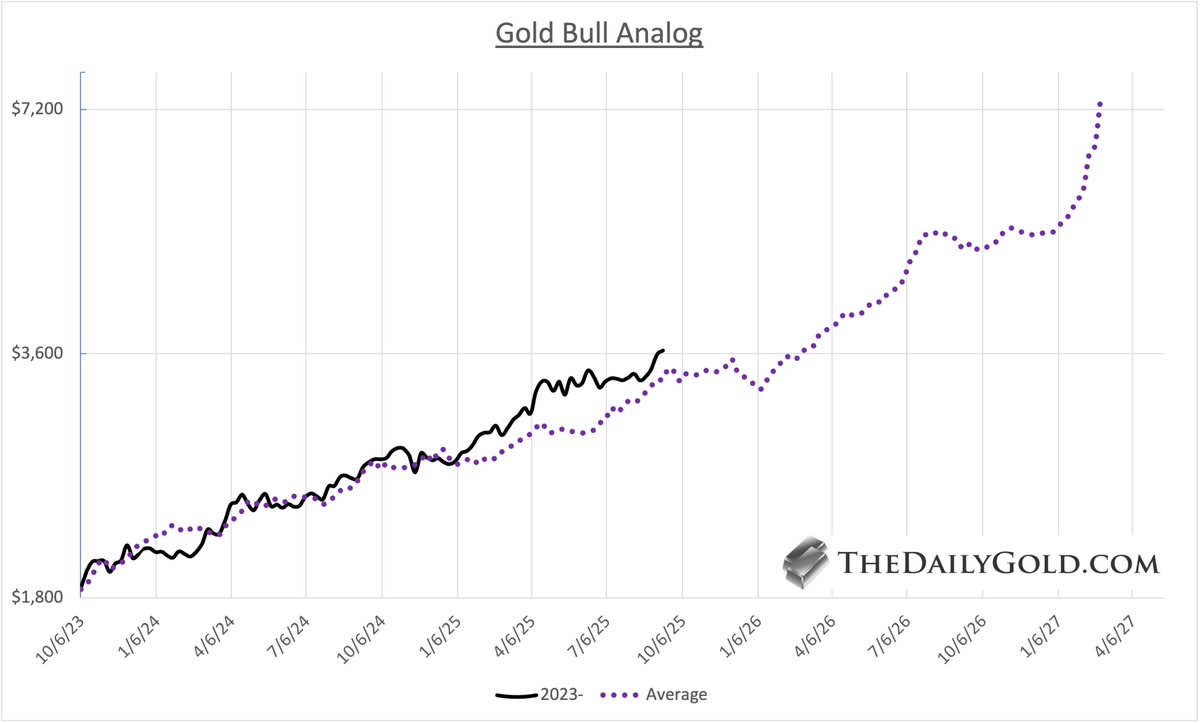
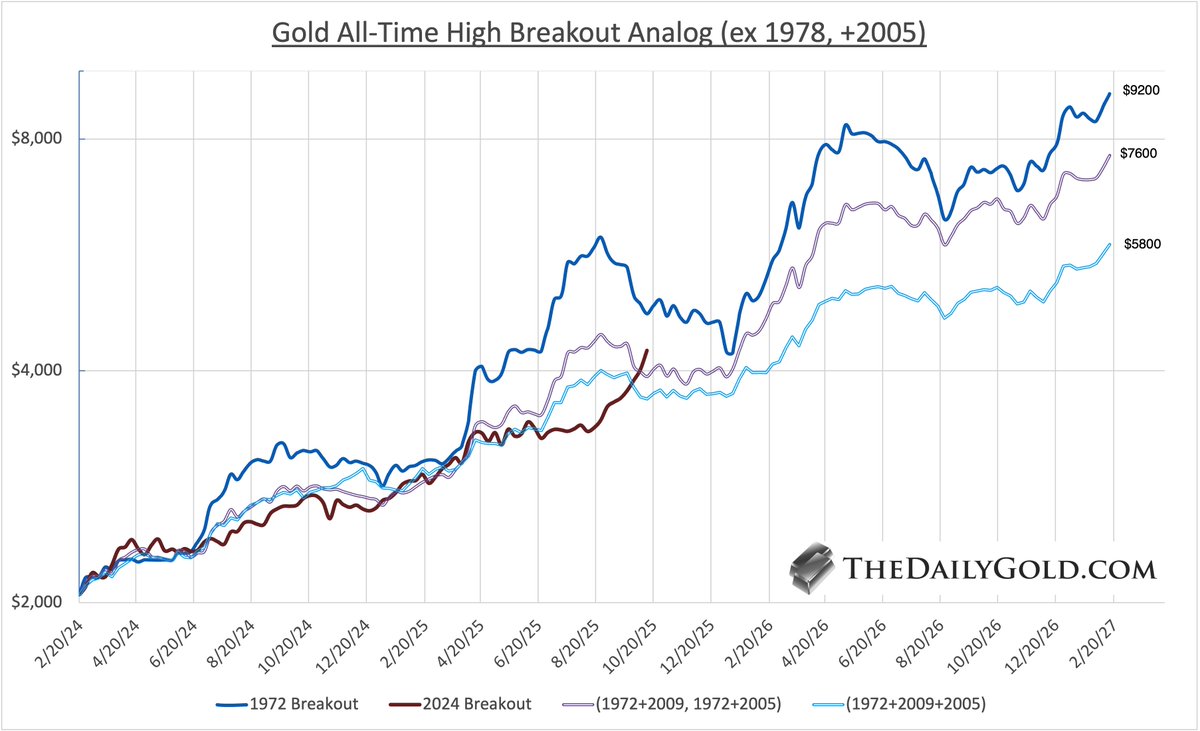
2) Gold All-Time High Breakout Analog

There are numerous similarities to 1972-1973. It has been the best fit for Gold, which has lagged it a bit.

That's a good thing. On the current scale, the 1972-1973 peak was near $6000 before it corrected 28%.

Gold is not as extended this time.

Its going to correct more than 10%-12%, but nowhere near 28%.

A more precise fit for this Gold move is the 1972 breakout and a combination of the 2009 and 2005 breakouts.

That is the middle line in the chart.

That line, along with the other, show a 5 month correction.

The middle line (the precise fit) reaches $7600 in 16 months!Gold All-Time High Breakout Analog
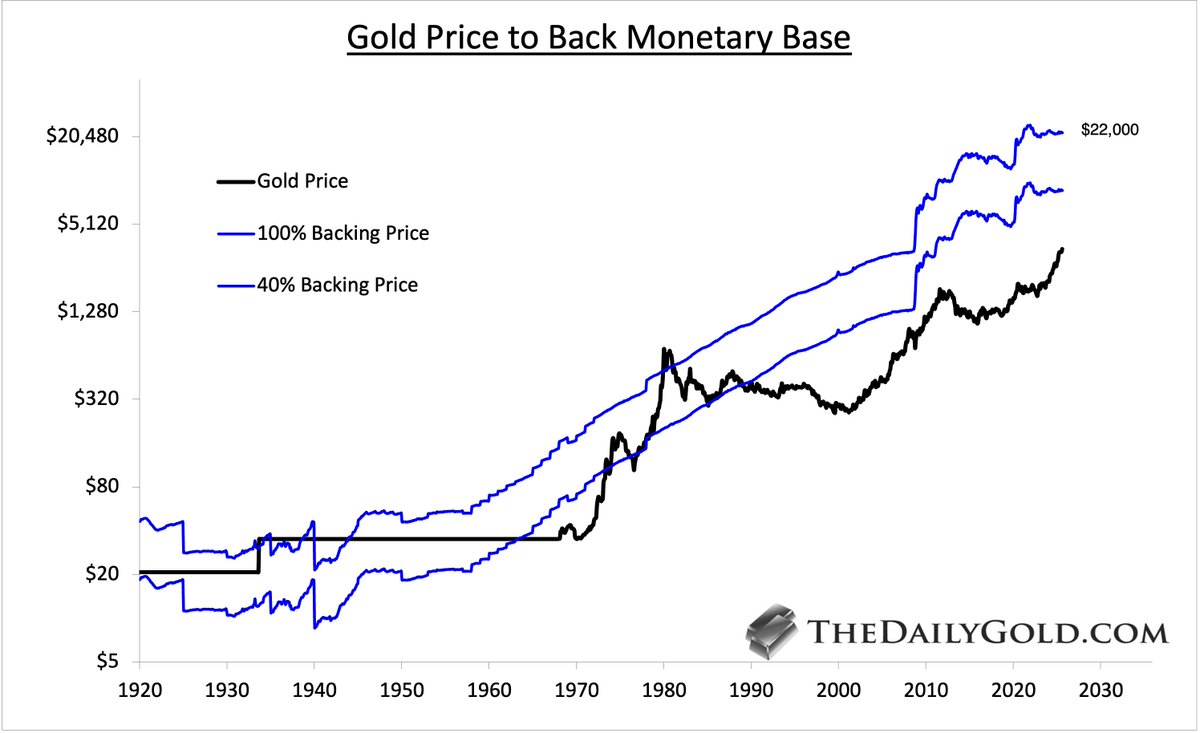
3) Gold vs. Monetary Base

The secular bull markets during the Great Depression & 1970s ended with the Gold price backing over 100% of the Monetary Base.

Today, 100% = nearly $22,000 Gold Gold vs. Monetary Base
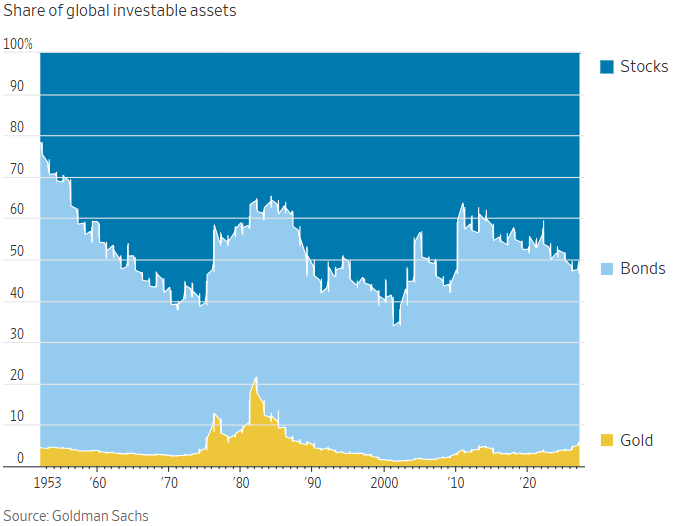
4) Gold's Share of Investable Assets

Gold is up nearly 150% over the last 24 months.

Share of assets has increased from 4% to 6%.

In 1980 it peaked at 22%. Gold's Share of Investable Assets
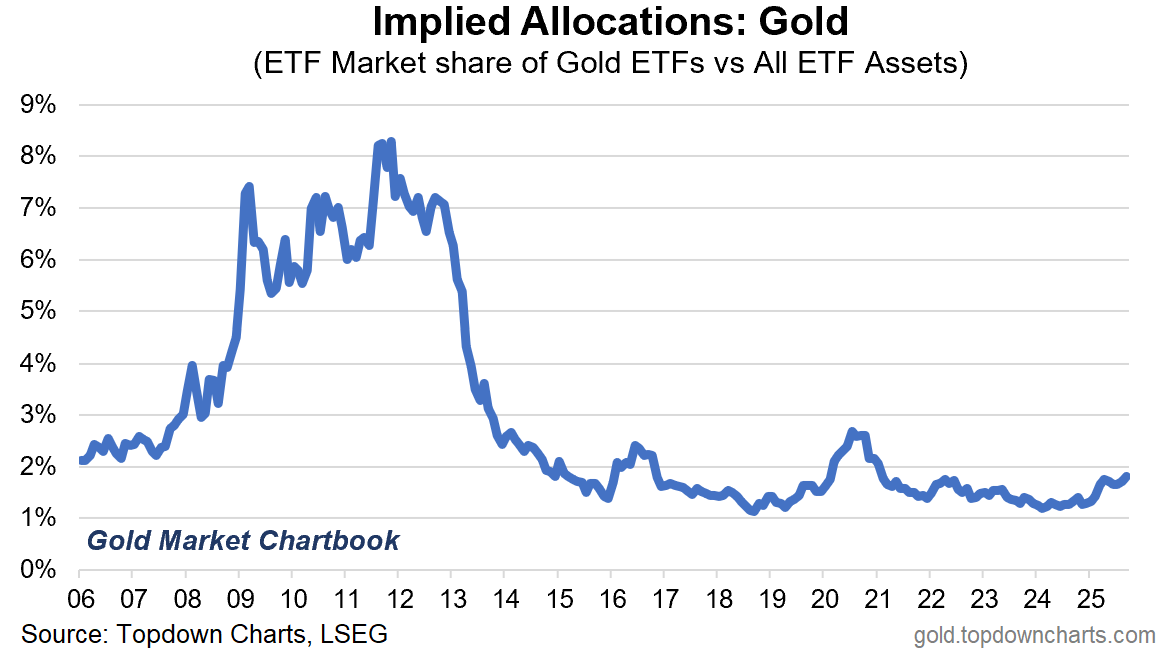
5) Gold ETF Allocation

Chart is one month old.

This data likely hit 2% or slightly higher.

It remains below the 2020 and 2016 peaks.

It remains well below the 2011 peak of almost 8.5%.
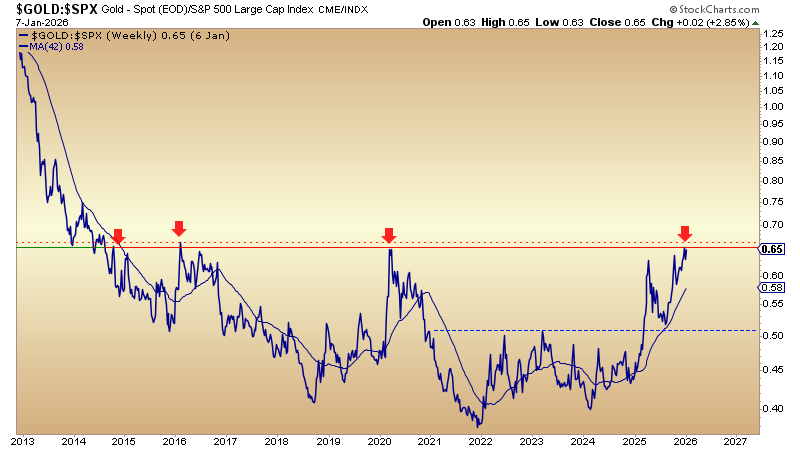
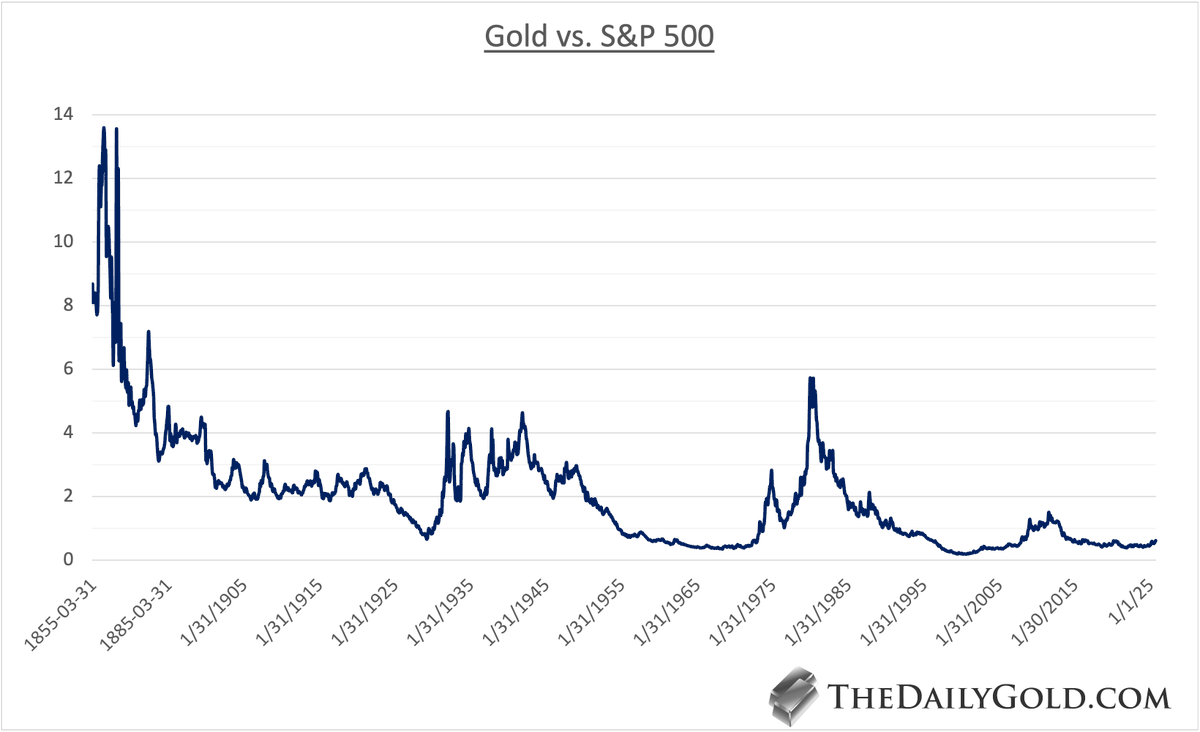
 Gold ETF Allocation
6) Gold vs. S&P 500

The ratio closed today at 0.61. A move beyond 0.65-0.70 would mark an extremely significant breakout, which we will discuss in future tweets.

But zoom out.

For the past 135 years we see most peaks around 4-5. (In weekly terms the 1980 peak was 7).

The S&P is at 6700 right now.

Take 6000 and a ratio of 4. Or 5?

This move has a really long way to go.Gold vs. S&P 500
7) Summary

Gold is at an intermediate term peak.

It's the first significant post-breakout correction.

1972-1973 remains the best comp but Gold is nowhere close to the 1973 peak which led to 28% decline.

But Gold should correct more than 12% here.

Look for support at $3600-$3700.

1972 plus a combination of 2009 and 2005 breakouts are closest fit to Gold's performance.

Gold will rocket higher again when this correction ends.
8) Thank you for reading!

Would you be so kind to like and retweet this thread?

Want to find quality junior silver and junior gold stocks with 5x to 10x potential?

Now is the time.

thedailygold.com/premium

β€’ β€’ β€’

Missing some Tweet in this thread? You can try to force a refresh
γ€€

Keep Current with Jordan Roy-Byrne CMT, MFTA ⛏⛏

Jordan Roy-Byrne CMT, MFTA ⛏⛏ Profile picture

Stay in touch and get notified when new unrolls are available from this author!

Read all threads

This Thread may be Removed Anytime!

PDF

Twitter may remove this content at anytime! Save it as PDF for later use!

Try unrolling a thread yourself!

how to unroll video
  1. Follow @ThreadReaderApp to mention us!

  2. From a Twitter thread mention us with a keyword "unroll"
@threadreaderapp unroll

Practice here first or read more on our help page!

More from @TheDailyGold

Jan 7
New 🧡

The 5 key breakouts to watch in 2026.

After two years of powerful moves in Gold and Silver, a handful of major inflection points are still on deck.

Here are the 5 that matter most.

Let's Go!
1) Gold vs. Stock Market

In early 2025, Gold broke out of a 4‑year base vs. the S&P 500, unleashing stronger flows into precious metals, especially miners and juniors.
​
Yet broad equities kept grinding higher as herding into stocks persisted.
​
Now the Gold/S&P 500 ratio is pressing against a much larger 12‑year base, and a breakout here could spark a far more dramatic rotation out of stocks and into Gold and precious metals.Gold vs. S&P 500
2) Gold vs. Technology Sector

The tech sector and MAG7 have been the engine of the US equity secular bull market and a dominant driver of the S&P 500, siphoning capital away from Gold and precious metals.
​
Now the Gold/Nasdaq 100 ratio is testing a 5.5‑year base of resistance.

A breakout would signal capital rotating out of high‑flying tech and into Gold.
​
If that move coincides with a Gold/S&P 500 breakout, it opens the door for Gold to advance beyond 5,000, 6,000, and potentially much higher over this cycle.Gold vs. Technology Sector
Read 8 tweets
Dec 11, 2025
Thursday 🧡

Some 170-Year-Long Charts For You.

These 6 Charts Explain Everything About Gold & Silver

Let's Go!
1) Gold Historical Chart

Gold is mirroring its performance from the early 1970s.

Specifically, it resembles 1972-1973.

There was a 24 month period from 1971 to 1973 when Gold surged 225% and endured only a single 13% correction along the way.

The arrow in the chart shows where we could be based on that template.

My all-time high breakout analog chart shows that the average of the 1972 and 2005 breakouts puts the current move at $7000/oz in March of 2027.

Gold may needs a 20% correction between now and then to reach that target.Gold Historical Chart
2) Silver Historical Chart

It's the 2nd Greatest Breakout of All-Time.

(The Greatest was Gold in 1972).

As our historical work (based on the 1967, 1973 and 1978 breakouts to new all-time highs) shows, Silver could double within 7 to 11 months.

There's that and there's also a measured upside target of $96.

Silver cleared its Civil War high and 1967 high in 1973. The current breakout is another similarity to the early 1970s.

It broke above $3 and ultimately peaked at $50.Silver Historical Chart
Read 9 tweets
Nov 20, 2025
Thursday 🧡

Silver Update.

6 Charts.

Let's Go!
1) Silver All-Time High Breakout Analog

I may have to adjust this chart depending on how Silver corrects.

However, the reality is clear.

History argues that once Silver takes out $54, it should reach $90-$100 within 7 to 11 months.

It's 3/3 in history and will be 4/4. Silver All-Time High Breakout Analog
2) The 4 Biggest Cyclical Moves in Silver

This chart plots the performance of the 4 greatest cyclical moves in Silver into 2 averages on the current scale.

One line is an average of 3 moves (excluding 1978-1980 moonshot).

One is an average of all 4 moves.

Look at both averages.

Notice how there was a 4 month period from October 2025 to February 2025 which preceded the accelerated advance through $50 on that scale.Silver Bulls Analog
Read 9 tweets
Sep 23, 2025
Tuesday 🧡

My updated Silver charts & analysis.

Let's Goooo!
1) Silver Historical Chart

The circles show breakouts to new all-time highs.

The first circle was a new modern all-time high, the highest level since the Civil War.

Silver, which was trading around its 1920 peak, basically doubled in 1967, eclipsing the 1920 peak.

This lead to a mania in silver juniors in 1967-1968.

The equivalent today would be a pop to $100.

The breakout in 1973 led to a 120% pop in 4 months.Silver Historical Chart
2) Silver Quarterly Chart

Silver has 5 more trading days until the end of the quarter.

The quarterly all-time high is $37.60, with further resistance at $39.95.

Silver is in position to make a new quarterly all-time high. Closing above $39.95, adds significance.

Gold closed at a new quarterly all-time high Dec 31 of 2023, but not yet at a daily or weekly all-time high.

It broke-out for good 2.5 months later.Silver Quarterly Chart
Read 9 tweets
Sep 9, 2025
Tuesday 🧡

Gold & Silver Analog Charts Updated

These are some of my best and favorite charts.

Let's Go!
1) Gold Bull Analog

This chart plots the 4 strongest cyclical moves in Gold, on the scale of the current move that began October 2023.

(I start the moves when an impulsive uptrend begins).

Nearly two years in, and Gold has followed the template almost to a T.

The two weaker moves peaked just below $5000 in August 2026.

The two others (1970-1974, 1976-1980) peaked at ~$9,000 and ~$14,000.Gold Bull Analog
2) Gold Bull Analog Average

Here we remove the 4 lines and plot an average.

The average, when the two weaker moves peaked, around August 2026 is $5100/oz.

However, if we continue all 4 for another 30 weeks, the average reaches ~$7500 in 18 months. Gold Bull Analog Average
Read 9 tweets
Sep 2, 2025
Tuesday 🧡

Silver Price Expectations & Prediction for 2026-2027

Let's Go!
1) Silver Near Term to Medium Term

Spot Silver closed August just below $40.

In June, Silver broke-out from a 9/10-month long consolidation, that projects to an upside target of $41.

The monthly chart below and weekly chart show $42-$43 as the next significant resistance. Silver Monthly
2) Silver Quarterly Chart

The quarterly chart is important because it pertains to the weeks ahead and Silver could make a quarterly all-time high.

The quarterly chart shows $34-$35 as very strong support.

$37.60, the all-time high, is also quarterly support.

Can Silver close Sept 30 above $37.60, its ATH?

If it were to close around $40, that would be a signal it will test $50 sooner rather than later.Silver Quarterly
Read 9 tweets

Did Thread Reader help you today?

Support us! We are indie developers!


This site is made by just two indie developers on a laptop doing marketing, support and development! Read more about the story.

Become a Premium Member ($3/month or $30/year) and get exclusive features!

Become Premium

Don't want to be a Premium member but still want to support us?

Make a small donation by buying us coffee ($5) or help with server cost ($10)

Donate via Paypal

Or Donate anonymously using crypto!

Ethereum

0xfe58350B80634f60Fa6Dc149a72b4DFbc17D341E copy

Bitcoin

3ATGMxNzCUFzxpMCHL5sWSt4DVtS8UqXpi copy

Thank you for your support!

Follow Us!

:(