In this THREAD I will explain "FVG"
1. What is a “FVG”
2. Types of FVG
3. How to identify FVG
🧵(1/15)
1. What is a “FVG”
2. Types of FVG
3. How to identify FVG
🧵(1/15)
1. What is a “FVG”
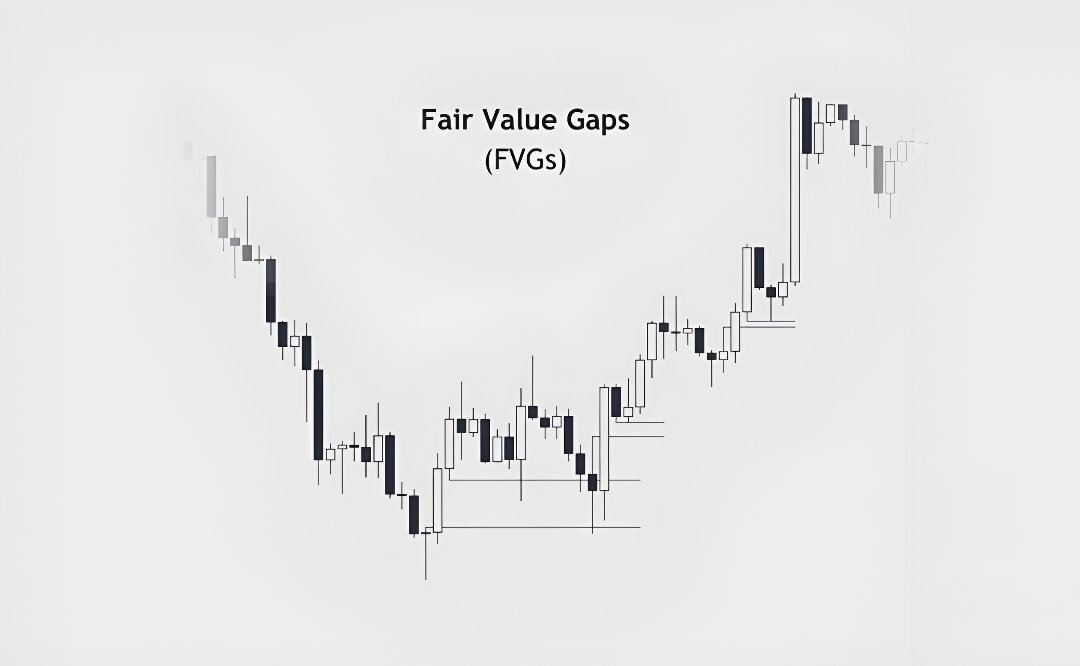
A FVG represents a price gap between the closing price of one period and the opening price of the next.
Indicating a temporary market inefficiency.
A FVG represents a price gap between the closing price of one period and the opening price of the next.
Indicating a temporary market inefficiency.
1.1 What is a “FVG”
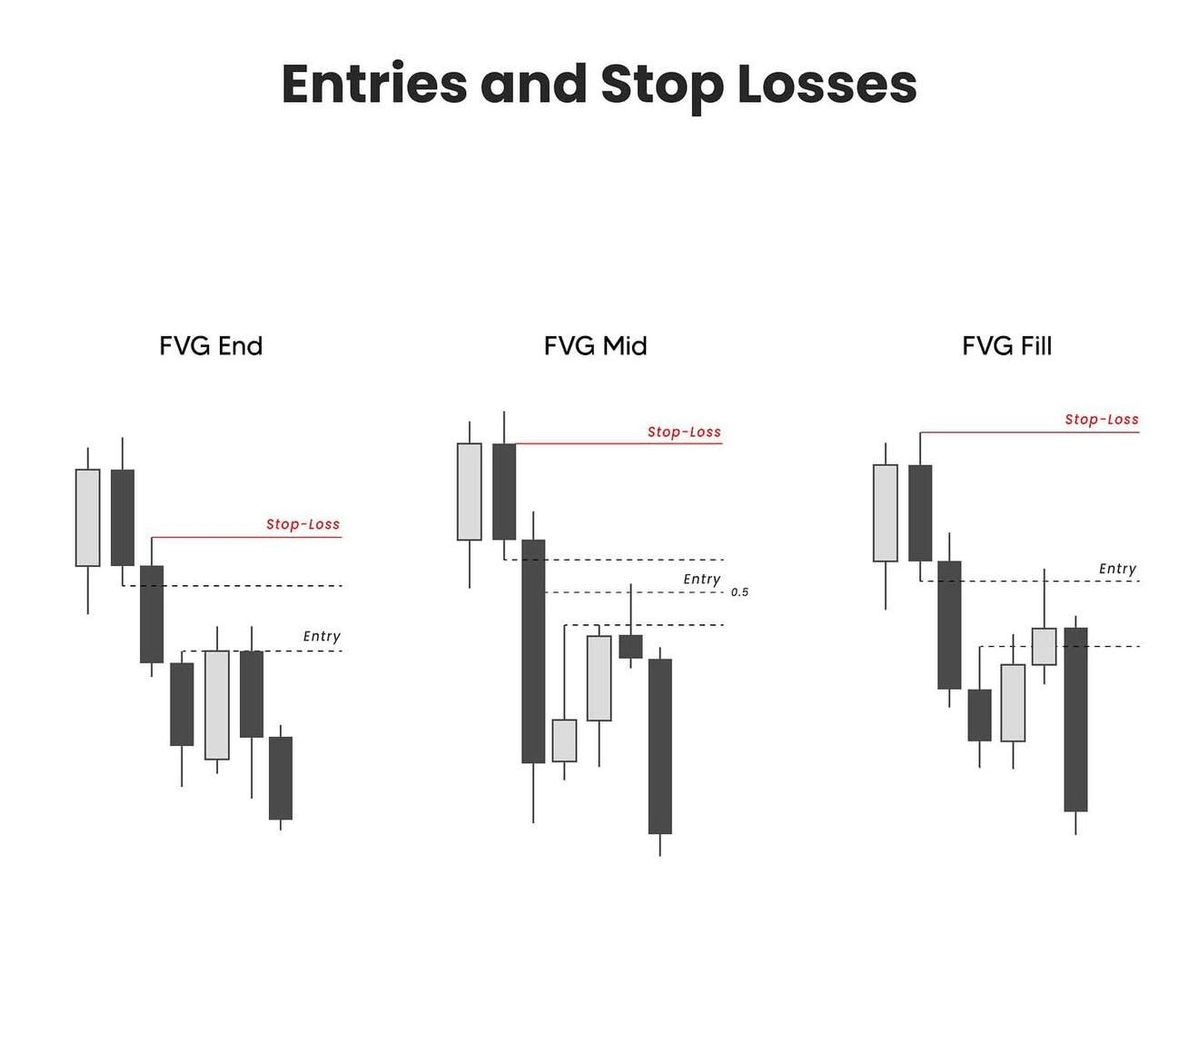
Enter when price pulls back into the gap, at the end, midpoint, or after the gap fills.
Place stop loss above the gap or recent high.
End is conservative, mid gives better risk to reward, fill is aggressive.
Enter when price pulls back into the gap, at the end, midpoint, or after the gap fills.
Place stop loss above the gap or recent high.
End is conservative, mid gives better risk to reward, fill is aggressive.
1.2 What is a “FVG”
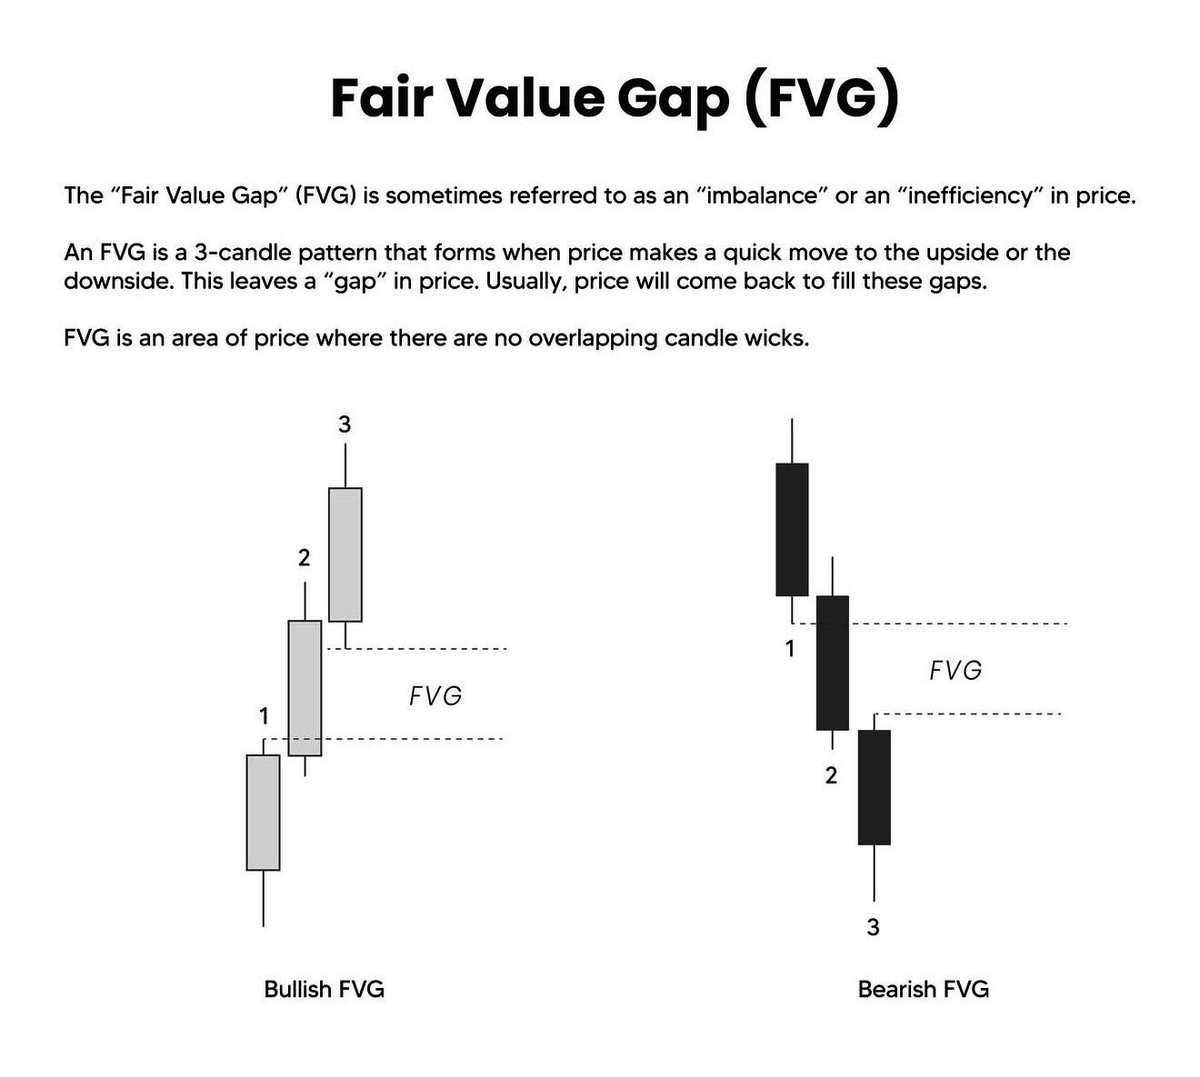
A FVG can be bullish or bearish, depending on where it forms relative to the price.
When the price is above the fair value gap as it forms, it is a bullish FVG.
When it is below as it forms, it is bearish.
A FVG can be bullish or bearish, depending on where it forms relative to the price.
When the price is above the fair value gap as it forms, it is a bullish FVG.
When it is below as it forms, it is bearish.
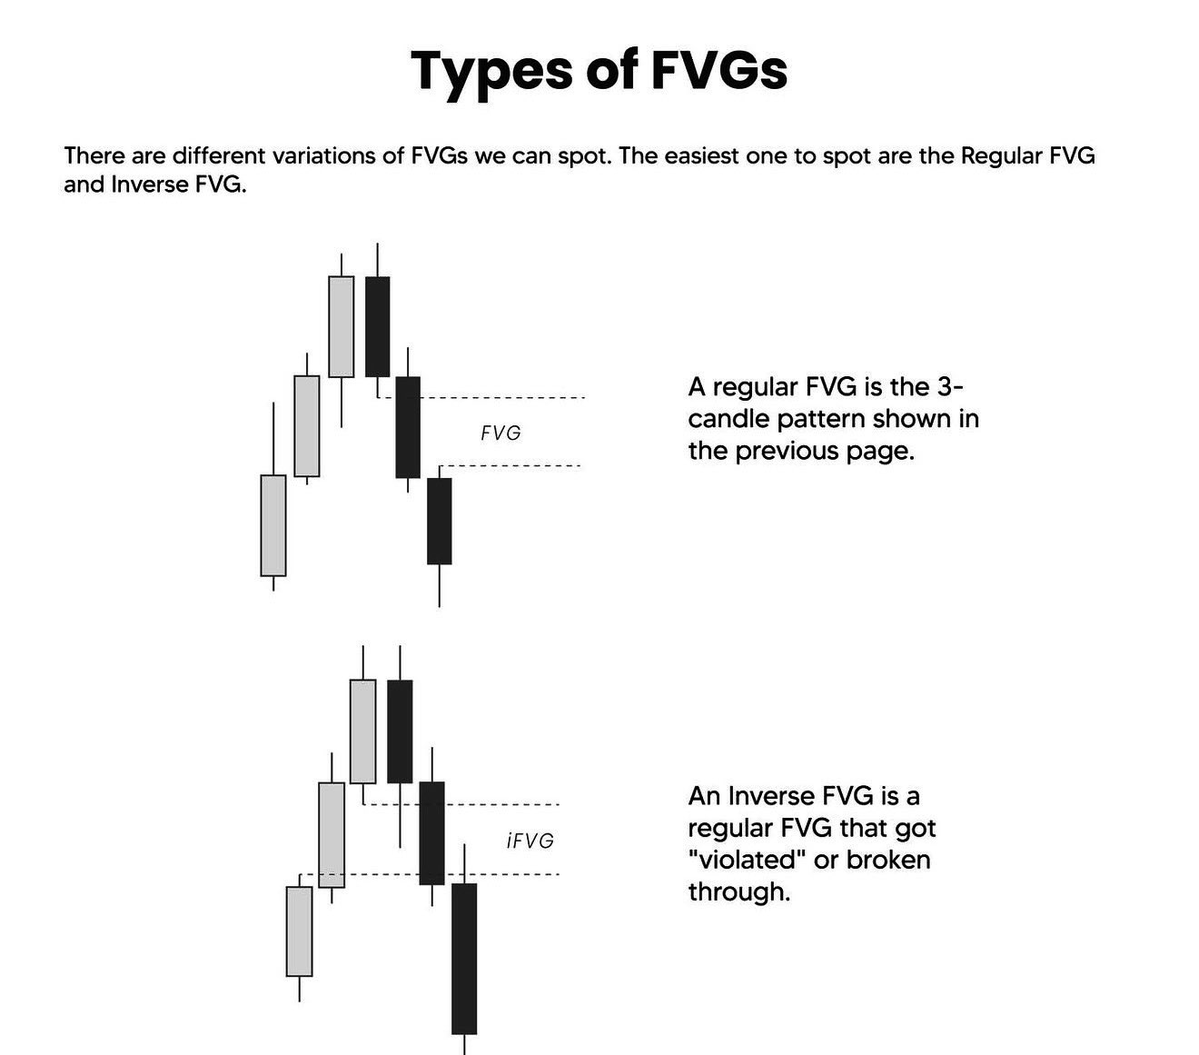
2. Types of FVG
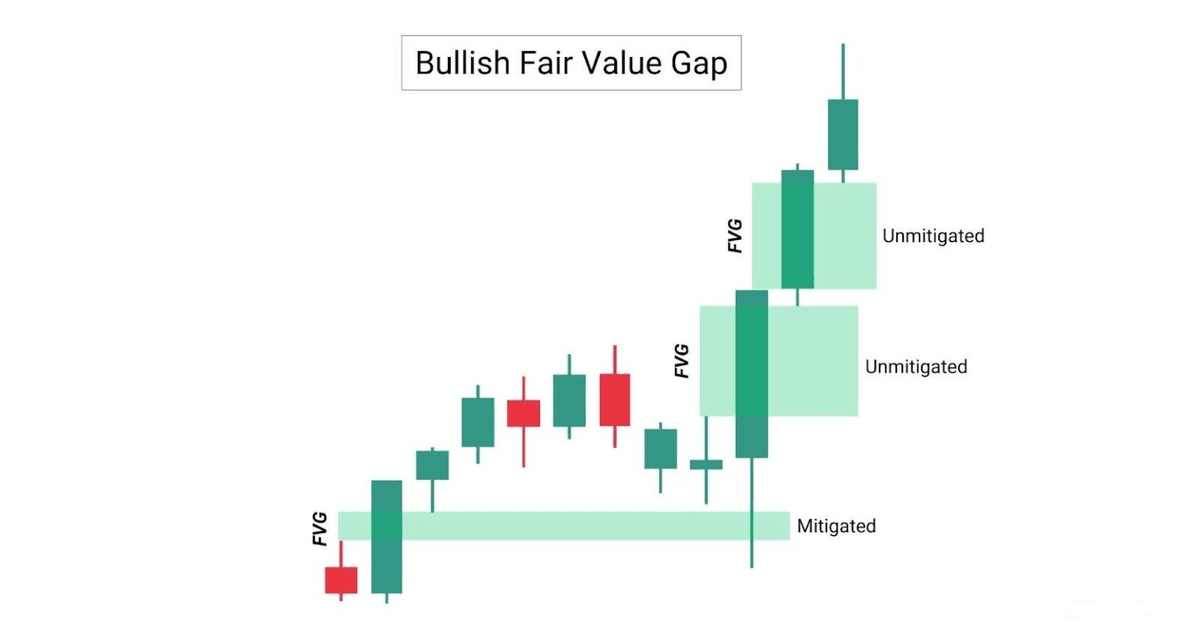
Bullish FVGs are formed when the price moves higher impulsively, creating the pattern in the process.
This zone is then established as a Support zone, where price may revisit and potentially bounce.
Bullish FVGs are formed when the price moves higher impulsively, creating the pattern in the process.
This zone is then established as a Support zone, where price may revisit and potentially bounce.
2.1 Types of FVG
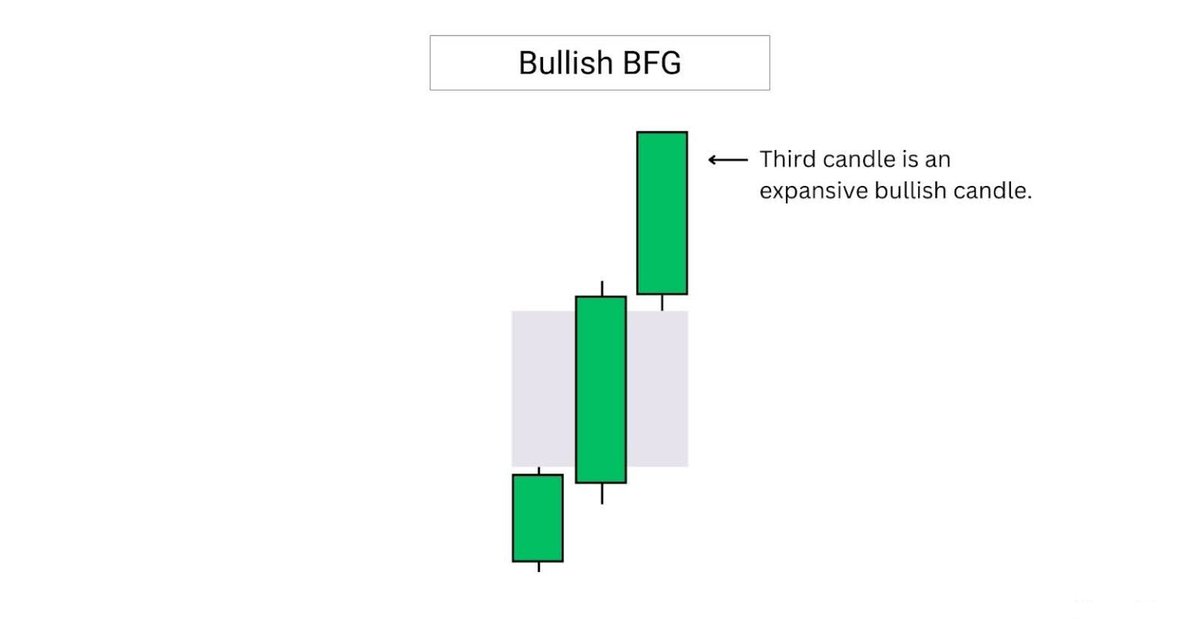
A bullish breakaway FVG or BFG, is formed when the third candle is a large, expansive candle.
The third candle’s close in a BFG setup reflects strong directional momentum.
Its size and wick can help validate the strength of the move.
A bullish breakaway FVG or BFG, is formed when the third candle is a large, expansive candle.
The third candle’s close in a BFG setup reflects strong directional momentum.
Its size and wick can help validate the strength of the move.
2.2 Types of FVG
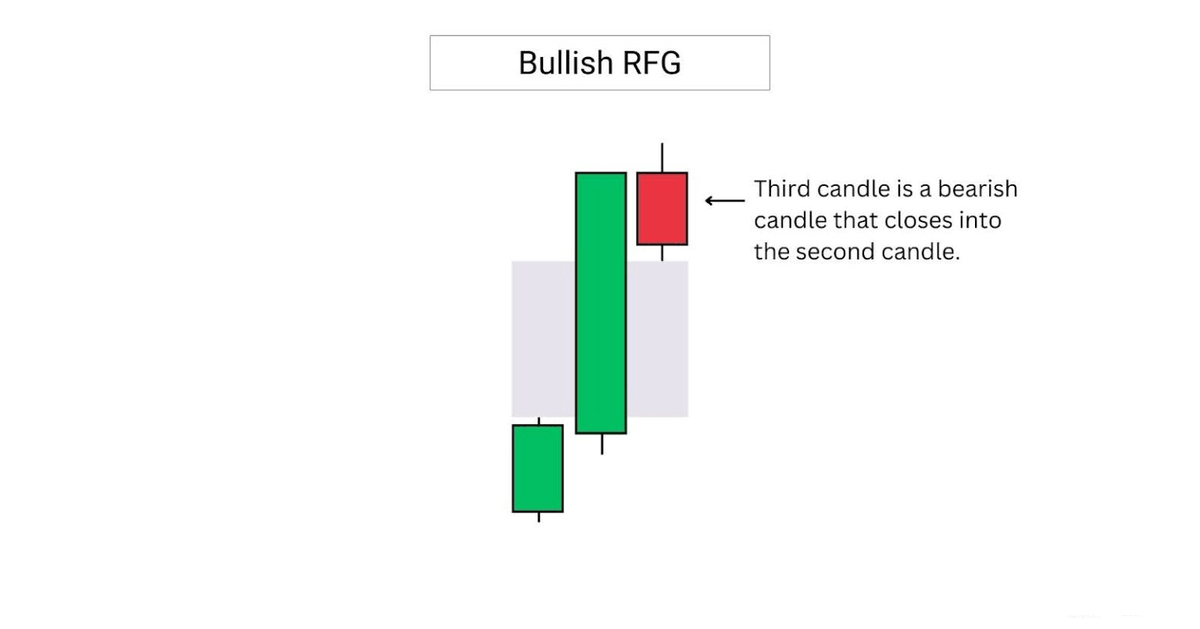
A bullish rejection FVG or RFG, is formed when the third candle closes into the second candle.
This implies weakening momentum, and signals a weaker FVG that is unlikely to hold as support.
A bullish rejection FVG or RFG, is formed when the third candle closes into the second candle.
This implies weakening momentum, and signals a weaker FVG that is unlikely to hold as support.
2.3 Types of FVG
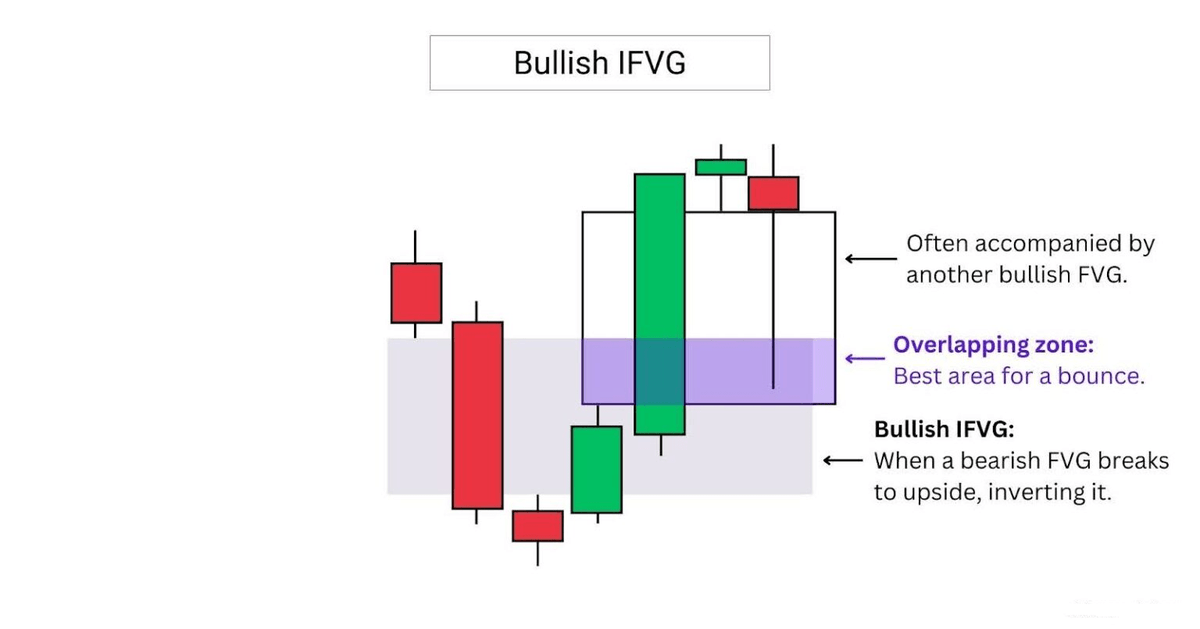
A bullish IFVG often forms alongside another FVG, creating an overlapping zone.
This overlap acts as a key area of interest, offering traders a powerful zone to watch for a potential bounce.
A bullish IFVG often forms alongside another FVG, creating an overlapping zone.
This overlap acts as a key area of interest, offering traders a powerful zone to watch for a potential bounce.
2.4 Types of FVG
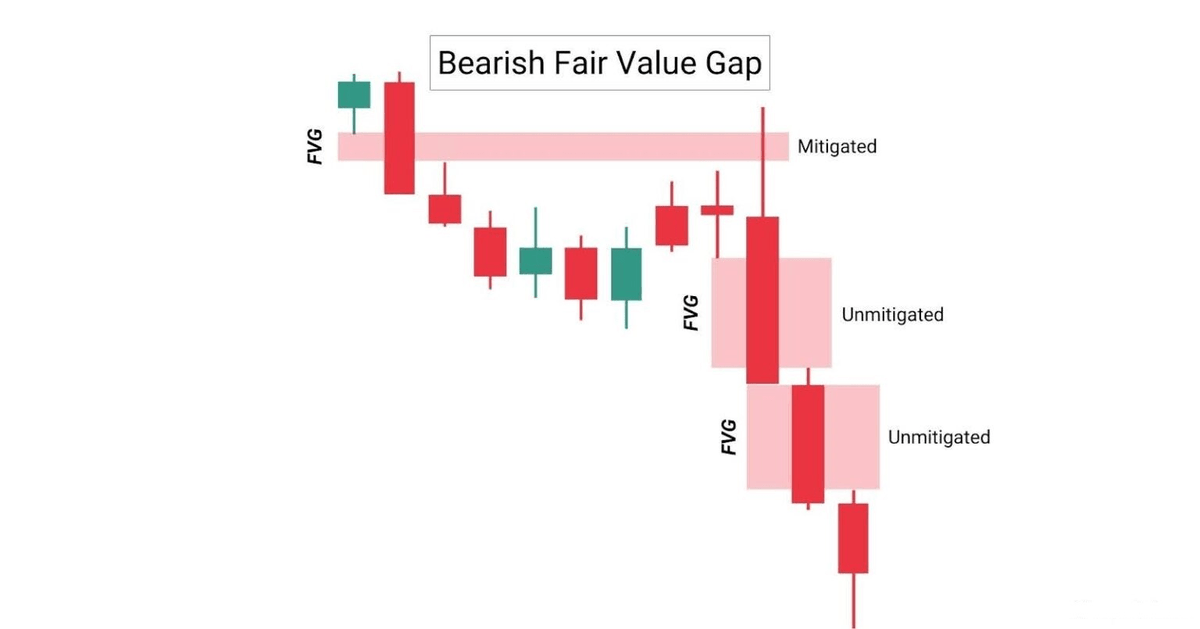
Bearish FVGs are formed when the price moves lower impulsively, creating the pattern in the process.
This zone is then established as a secret Resistance zone, where price may revisit and potentially reject.
Bearish FVGs are formed when the price moves lower impulsively, creating the pattern in the process.
This zone is then established as a secret Resistance zone, where price may revisit and potentially reject.
2.5 Types of FVG
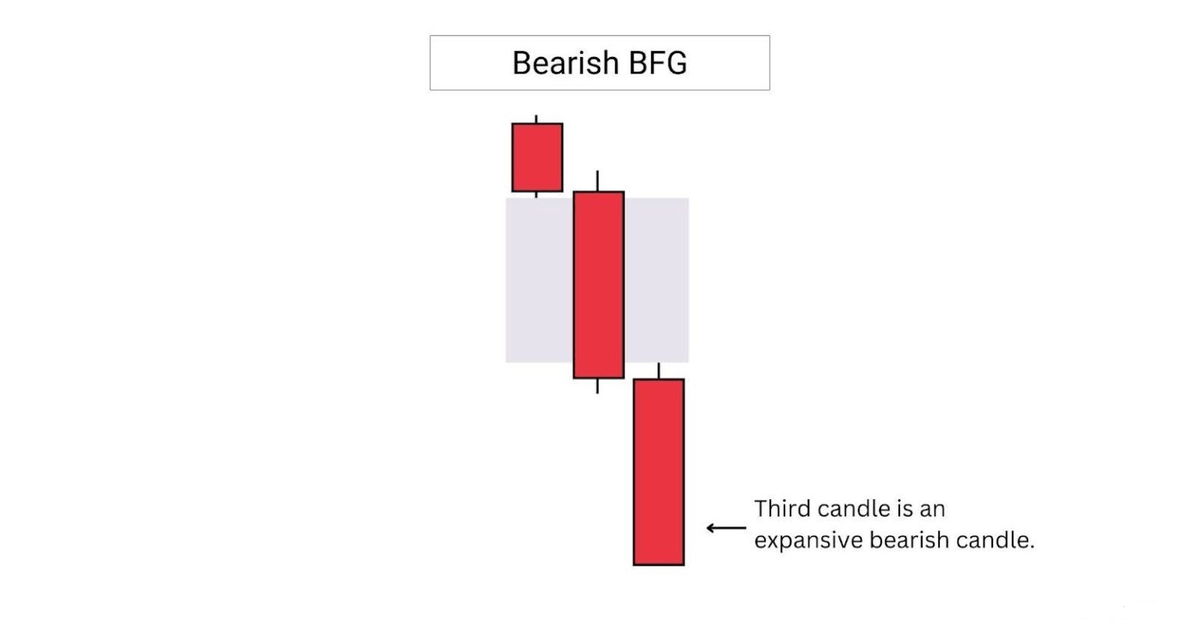
A bearish breakaway FVG or BFG, is formed when the third candle is a large, expansive candle.
This implies strong bearish momentum, and a low chance for the fair value gap to be revisited in the short term.
A bearish breakaway FVG or BFG, is formed when the third candle is a large, expansive candle.
This implies strong bearish momentum, and a low chance for the fair value gap to be revisited in the short term.
2.6 Types of FVG
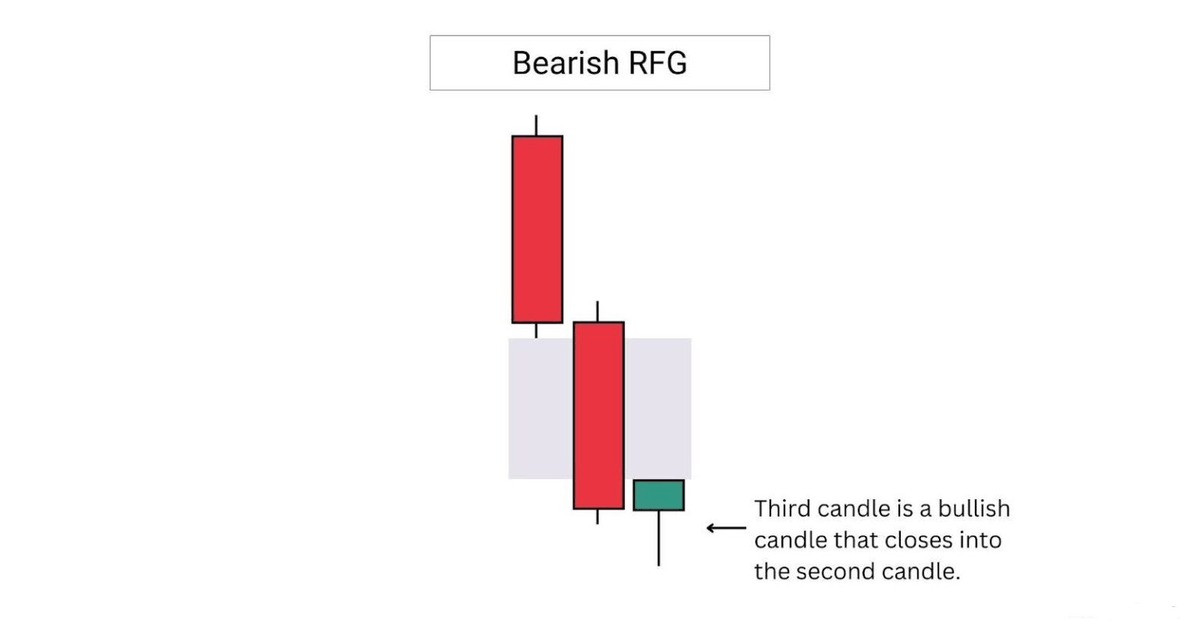
A bearish rejection FVG or RFG, is formed when the third candle closes into the second candle.
This implies weakening momentum, and a higher chance for the fair value gap to fail if revisited.
A bearish rejection FVG or RFG, is formed when the third candle closes into the second candle.
This implies weakening momentum, and a higher chance for the fair value gap to fail if revisited.
2.7 Types of FVG
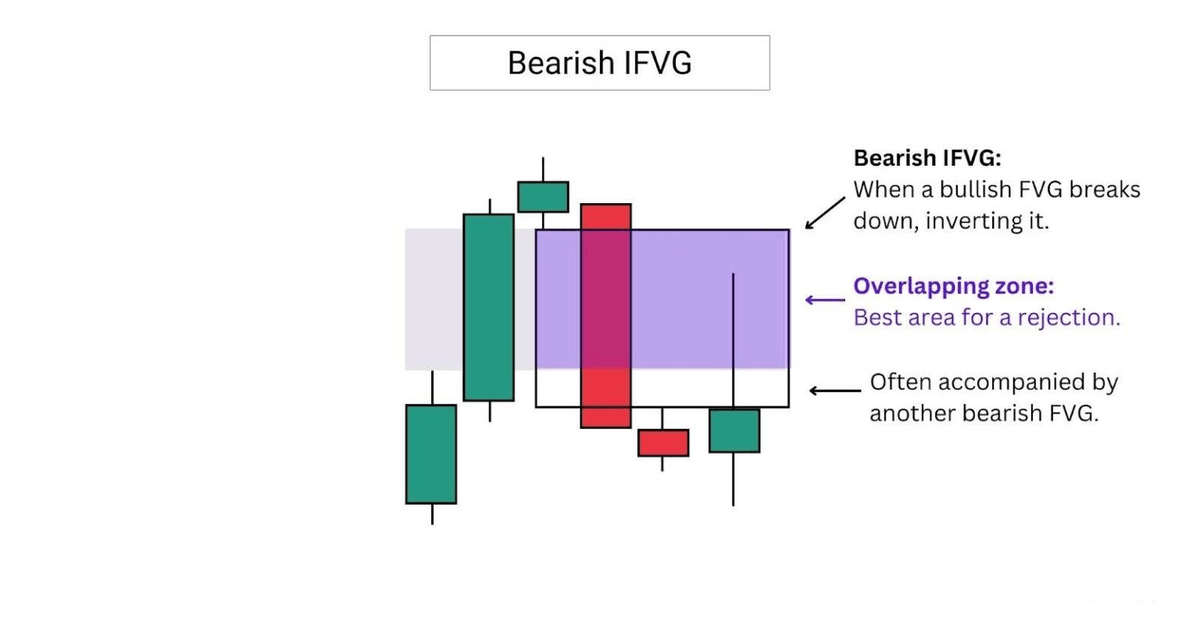
A IFVG is formed when a previous bullish FVG is broken to the downside.
A bearish IFVG often forms alongside another FVG, creating an overlapping zone.
This overlap acts as a key area of interest.
A IFVG is formed when a previous bullish FVG is broken to the downside.
A bearish IFVG often forms alongside another FVG, creating an overlapping zone.
This overlap acts as a key area of interest.
3. How to identify FVG
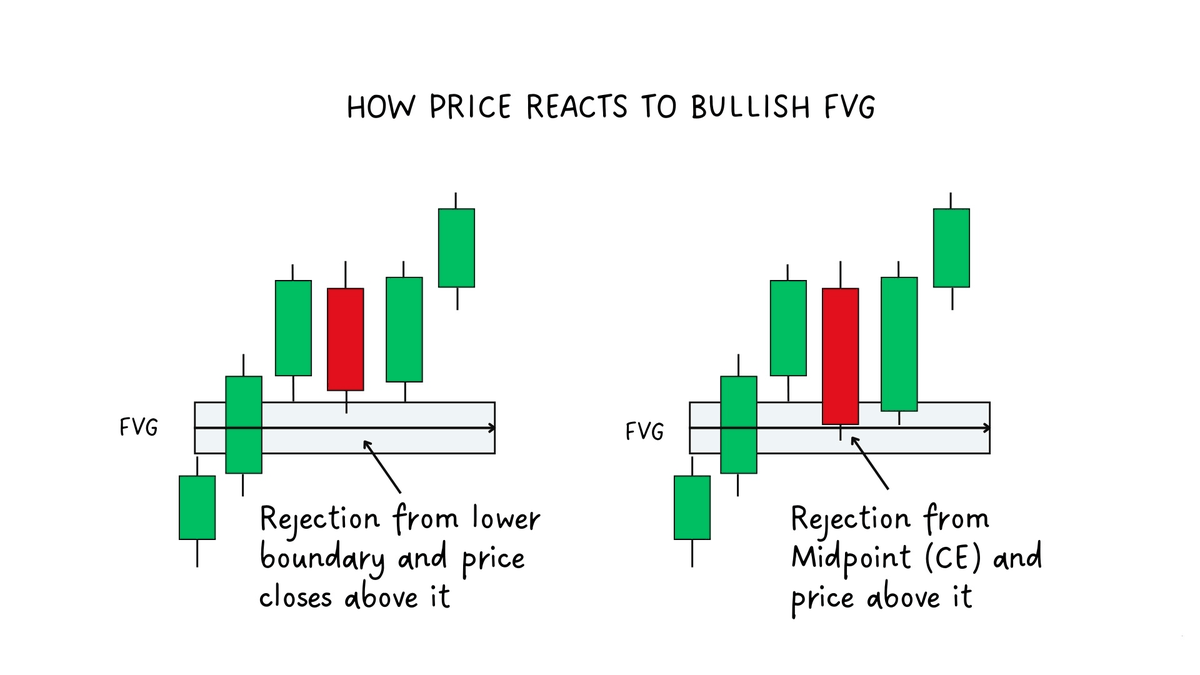
How to identify bullish FVG:
A FVG is an imbalance below price that can act as support.
Look for retests:
1) Rejection at the lower FVG boundary with a close above
2) Rejection at the midpoint (CE) with a close above
How to identify bullish FVG:
A FVG is an imbalance below price that can act as support.
Look for retests:
1) Rejection at the lower FVG boundary with a close above
2) Rejection at the midpoint (CE) with a close above
3.1 How to identify FVG
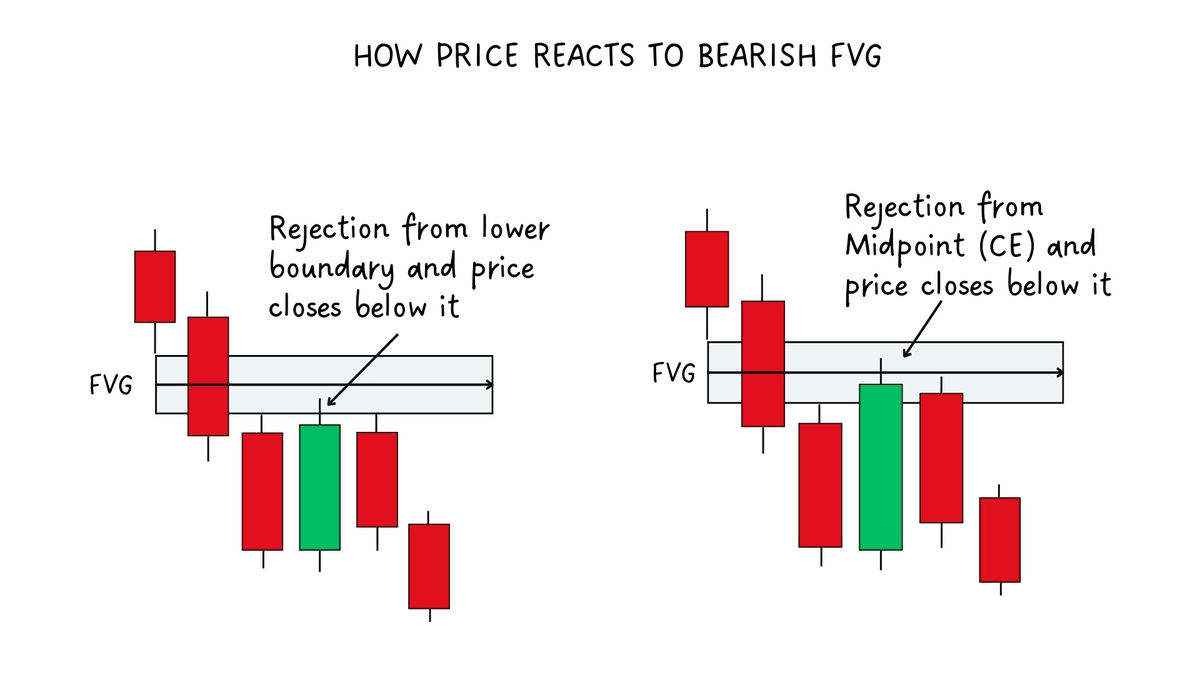
How to identify bearish FVG:
On a retest look for:
1) Rejection at the upper FVG boundary with a close below it
2) Rejection at the midpoint (CE) with a close below.
How to identify bearish FVG:
On a retest look for:
1) Rejection at the upper FVG boundary with a close below it
2) Rejection at the midpoint (CE) with a close below.
3.2 How to identify FVG
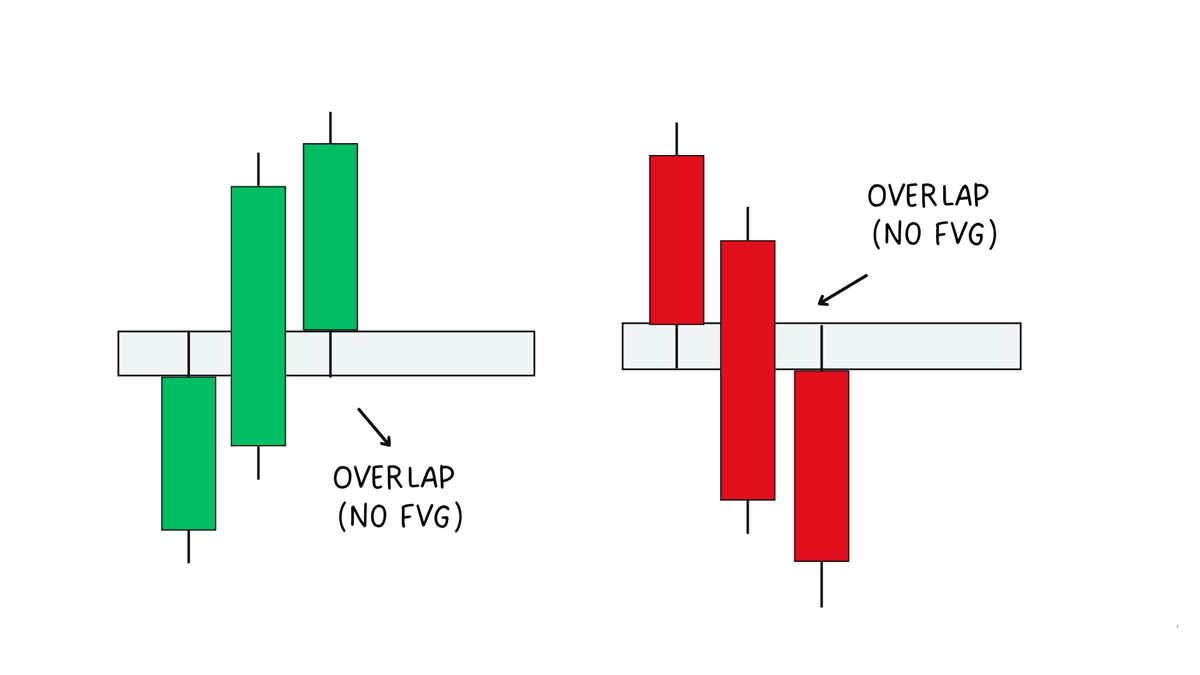
How to Spot a Valid FVG vs a Non-FVG:
If there’s no overlap between the wicks = valid FVG.
If the shadows do overlap = no FVG (market fills that price area)
How to Spot a Valid FVG vs a Non-FVG:
If there’s no overlap between the wicks = valid FVG.
If the shadows do overlap = no FVG (market fills that price area)
• • •
Missing some Tweet in this thread? You can try to
force a refresh