Alright. Finally published it 👀
Is This Cycle Over?
1/ Bitcoin reached an all-time high of 126K right around the time the peak of a four-year cycle would predict, and crashed hard after that, all the way down to 103K. The momentum on the price chart has also slowed down considerably and looks like it wants to roll over. Onchain data shows relentless selling from long-term holders and weak demand. Trump’s trade war also threatens a painful revamp of global trade. All this raises the question for investors: “Has Bitcoin topped already?”
In this article, I will be providing my thoughts on this issue after considering and consolidating many data points and viewpoints.
Given the importance of the question we address here, we are publishing this openly for all users on an exceptional basis. If you like our reports, please subscribe (link in my bio) and enjoy several deeply researched reports every single week to stay on top of the market trends.
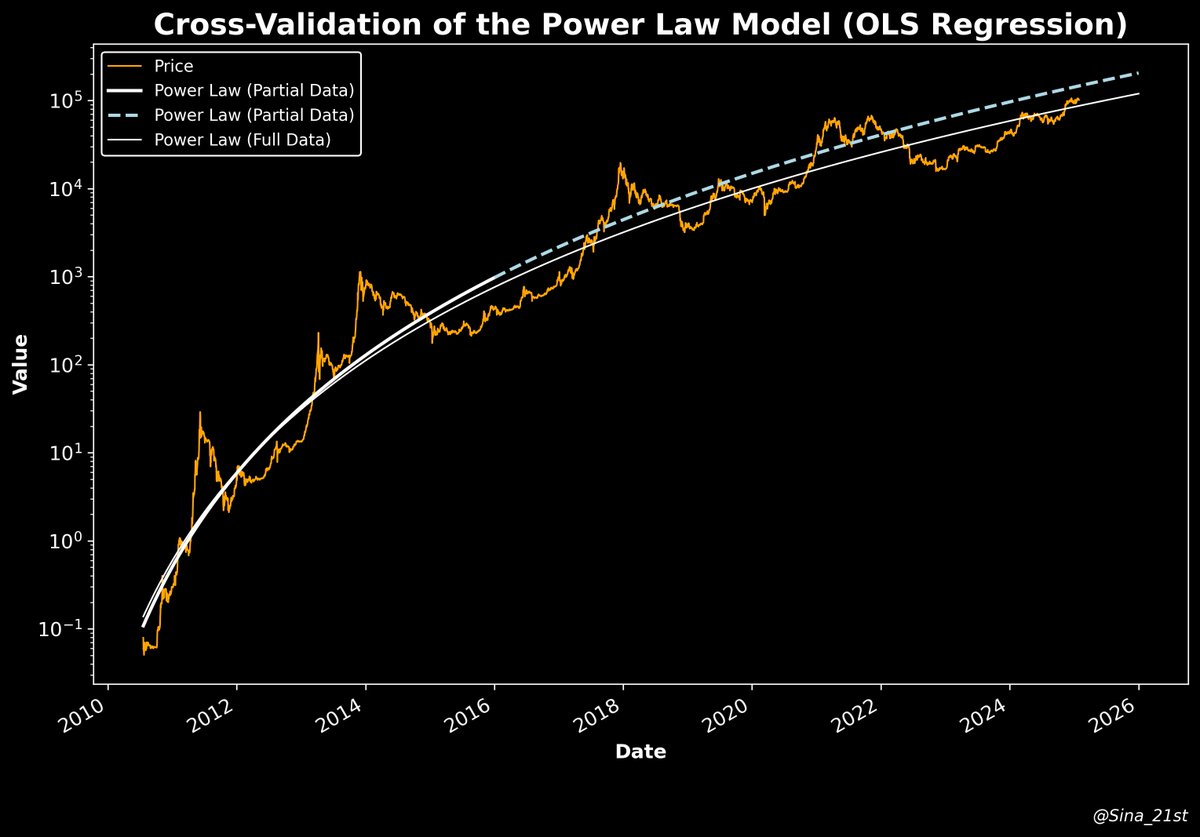
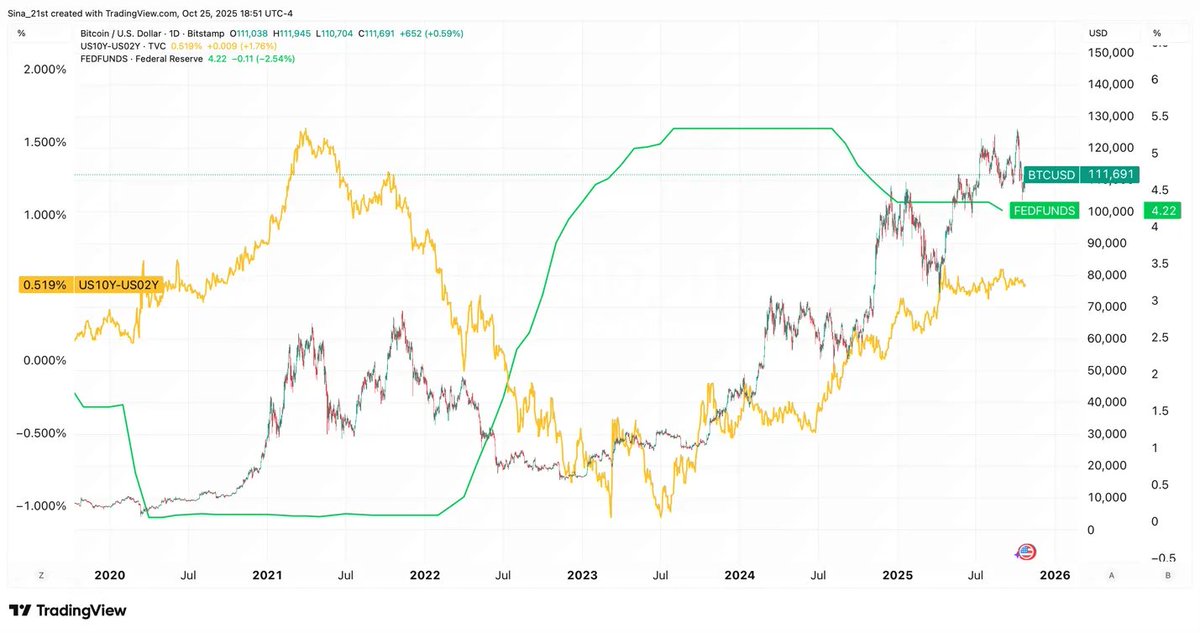
2/ I will organize this write-up into a few points with the aid of this chart.
1- Market internals
The first observation is that Bitcoin really has not had a parabolic run this cycle. In a video on July 28th, I proactively addressed the question of what will end this cycle. A clip from this video is posted here on the Subtack version of the article.
1- Market internals
The first observation is that Bitcoin really has not had a parabolic run this cycle. In a video on July 28th, I proactively addressed the question of what will end this cycle. A clip from this video is posted here on the Subtack version of the article.
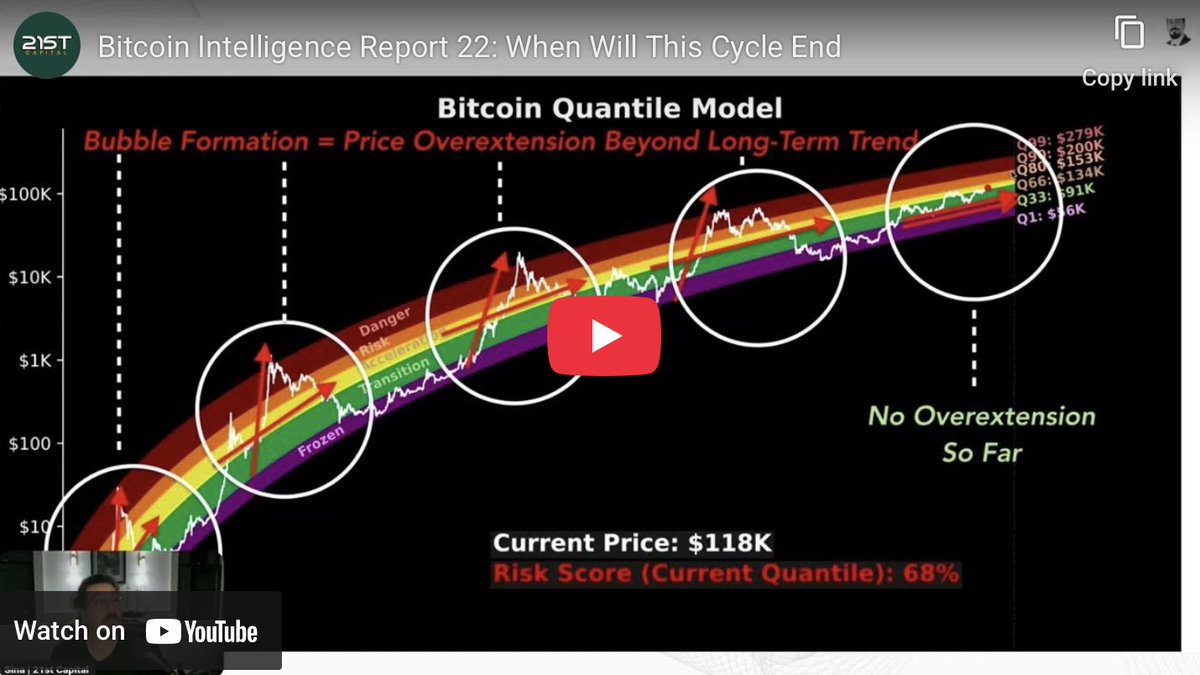
3/ The video has a simple thesis: for a major crash, like we have seen after prior cycle tops, we need a parabolic rise first.
As you can see in the price chart above, instead of an explosive run that we are used to seeing from prior cycles, Bitcoin has had three mini bubbles. The first two bubbles, then properly burst. The first one was a leverage release after the ETF approval; more than 7 months of correction fully wiped out leverage. After the next peak, a large correction occurred due to Trump tariffs, ending in a V-Shaped recovery.
Equity markets and gold kept making all-time highs after this and Bitcoin ran with them too and built a health amount of froth. This uninterrupted run-up needed a reason to correct and the renewal of China trade war gave it that reason.
4/
2- Market externals: macroeconomic trends
The current conditions are nothing like 2021. Looking at the chart above, back then, the fed funds rate (green curve) was at the zero bound and inflation was on the rise. The result was that the market began anticipating a tightening of monetary conditions. The 2-year note began rising rapidly and surpassed the 10-year note, causing the yield curve (the yellow curve) to invert and drop to the negative territory. The yellow curve, perfectly predicted the topping pattern in the last cycle. Furthermore, Bitcoin bottom almost exactly when the yield curve bottomed. This is one of the best barometers of liquidity as billions upon billions of smart money are at work in the bond market to price in economic and liquidity conditions in a forward-looking manner. The yield curve signal came around one year before (early 2021) the Fed began raising rates (in 2022).
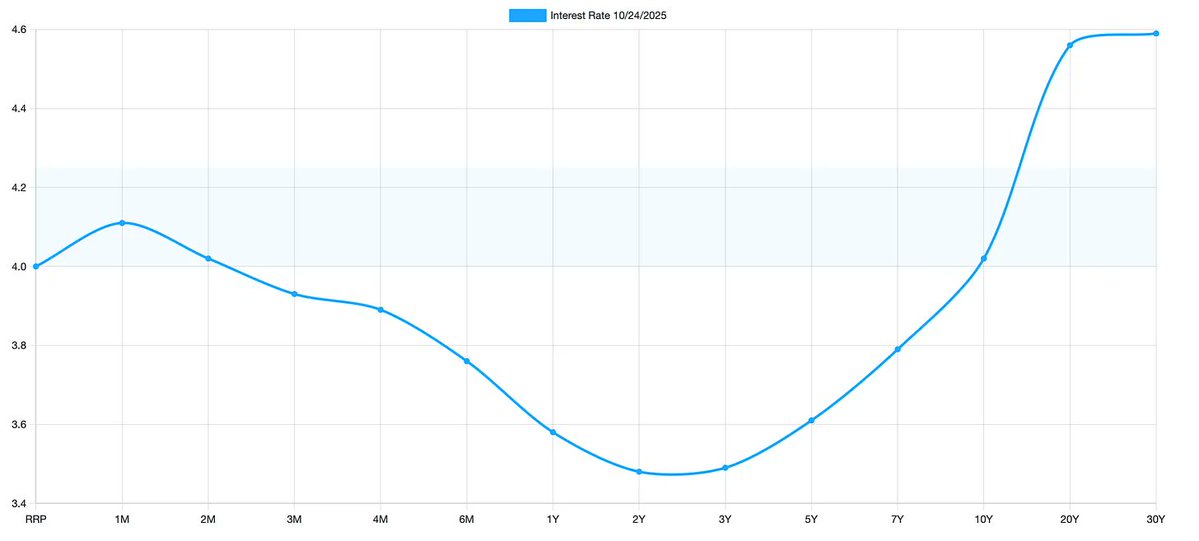
So what are the conditions today? The Fed funds have been at an excessively tight level for several years now. Rates have no further upside to go. The yield curve has just recently uninverted. Inflation is sticky and stable at around 3% and the labor market is faltering. This dynamic will lead the Fed to drop the rate continuously over the next 12 months and the yield curve is beginning to price that in. The front end of the curve is still higher than the middle part causing partial inversion and signaling that it wants to go lower. As the Fed drops the rate, the curve will steepen, and liquidity conditions will improve. So conditions today are the opposite of what it was in 2021.
2- Market externals: macroeconomic trends
The current conditions are nothing like 2021. Looking at the chart above, back then, the fed funds rate (green curve) was at the zero bound and inflation was on the rise. The result was that the market began anticipating a tightening of monetary conditions. The 2-year note began rising rapidly and surpassed the 10-year note, causing the yield curve (the yellow curve) to invert and drop to the negative territory. The yellow curve, perfectly predicted the topping pattern in the last cycle. Furthermore, Bitcoin bottom almost exactly when the yield curve bottomed. This is one of the best barometers of liquidity as billions upon billions of smart money are at work in the bond market to price in economic and liquidity conditions in a forward-looking manner. The yield curve signal came around one year before (early 2021) the Fed began raising rates (in 2022).
So what are the conditions today? The Fed funds have been at an excessively tight level for several years now. Rates have no further upside to go. The yield curve has just recently uninverted. Inflation is sticky and stable at around 3% and the labor market is faltering. This dynamic will lead the Fed to drop the rate continuously over the next 12 months and the yield curve is beginning to price that in. The front end of the curve is still higher than the middle part causing partial inversion and signaling that it wants to go lower. As the Fed drops the rate, the curve will steepen, and liquidity conditions will improve. So conditions today are the opposite of what it was in 2021.
5/ Conclusion
So the conclusion is that today is nothing like 2021. Fed funds rate, labor market, and inflation are all in the opposite direction of where they were in 2021, and Bitcoin has had ample time to release the leverage buildup in the recent run-up, making a 2021-style crash way less likely. Accordingly, I will stay put and enjoy hodling.
A caveat is that the path of rate cuts is dependent on continued weakness in the labor market and lack of an inflation resurgence. We don’t have the official labor data due to the government shutdown, but we just got the inflation report. In future reports, we will dive deeper into the inflation data and examine whether inflation is going to rise further from here.
Join our Substac to access our market research. [BitcoinIntelligence] .Substack .Com
• • •
Missing some Tweet in this thread? You can try to
force a refresh