The Labor Channel Is Not a Causal Driver of Inflation: VAR Evidence from the United States 

Thus, inflation and wages are not driven by labor conditions; they respond to the credit cycle and the associated demand and price dynamics. The NK causal chain is reversed.

Contribution


2. The Canonical New-Keynesian Model

2.3 Dynamic IS (Euler) Equation

Central Role of Labor in the NK System
Two core empirical claims are embedded:
Two core empirical claims are embedded:

3. Data, Empirical Strategy, and Identification

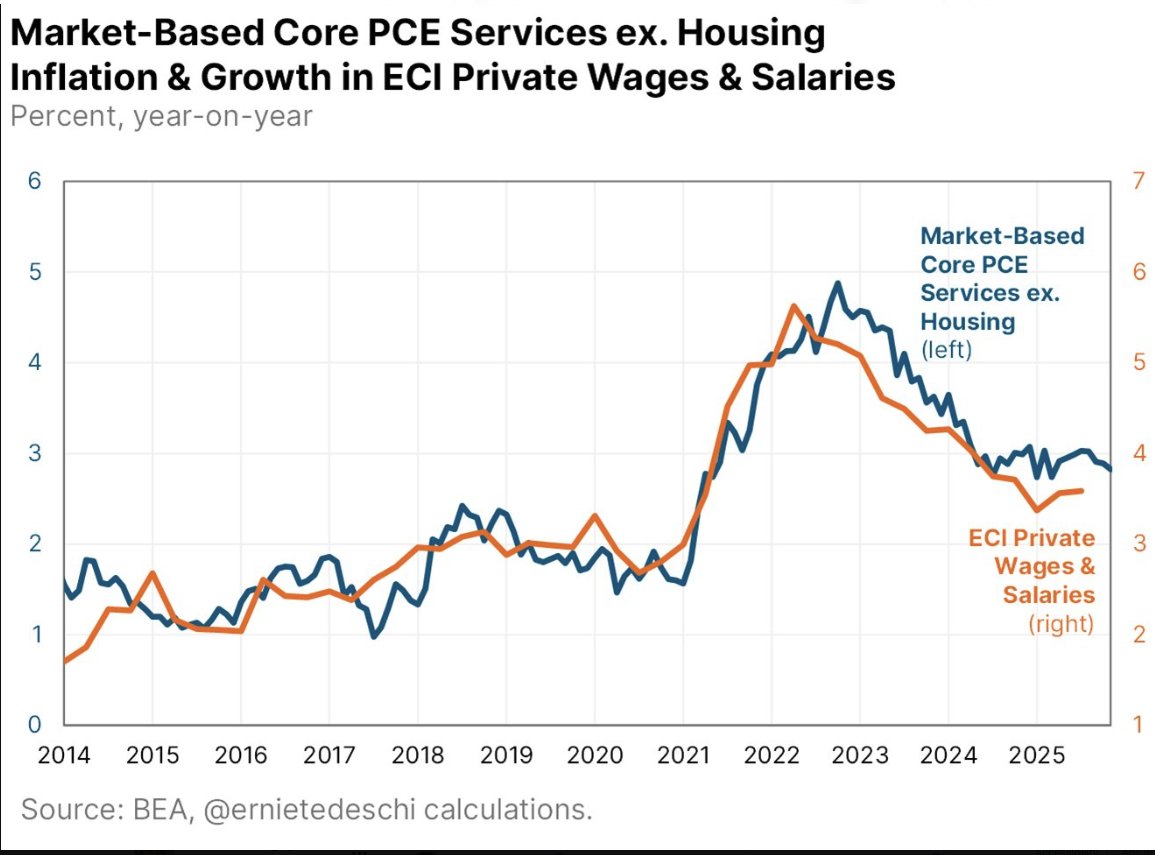
Why Services Inflation?

Baseline Empirical Approach

3.4 Identification Strategy

Hypotheses Tested

Estimation Tools

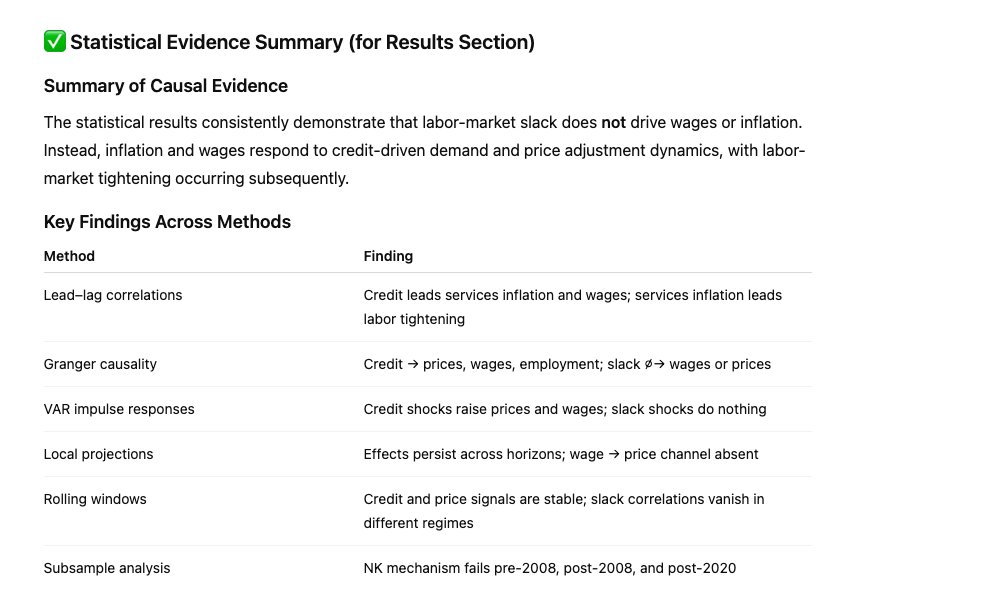
4. Empirical Results
Across all methods, the findings point to a unified conclusion: the labor channel does not causally drive wages or inflation.
Across all methods, the findings point to a unified conclusion: the labor channel does not causally drive wages or inflation.

4.2 Lead–Lag Correlations

4.3 Granger Causality Tests
Neither unemployment nor V/U predicts wages or inflation.
Neither unemployment nor V/U predicts wages or inflation.

4.4 VAR Results
The causal chain runs from credit and demand conditions to prices and then to labor, not from labor to prices.
The causal chain runs from credit and demand conditions to prices and then to labor, not from labor to prices.

4.5 Local Projections
The labor channel is not dormant — it is absent.
The labor channel is not dormant — it is absent.

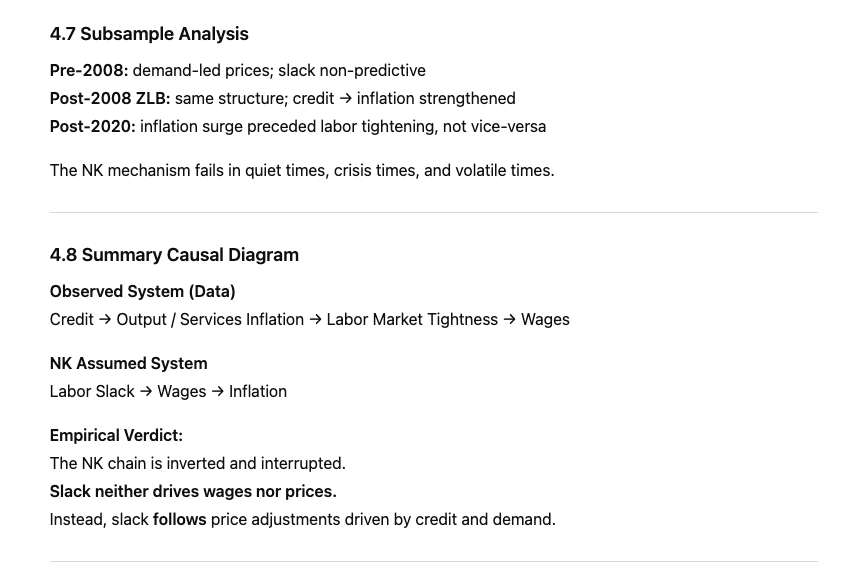
4.8 Summary Causal Diagram
Empirical Verdict:
The NK chain is inverted and interrupted.
Slack neither drives wages nor prices.
Instead, slack follows price adjustments driven by credit and demand.
Empirical Verdict:
The NK chain is inverted and interrupted.
Slack neither drives wages nor prices.
Instead, slack follows price adjustments driven by credit and demand.
Inflation and wages are downstream of credit and demand, not labor-market slack.
The canonical NK transmission mechanism fails both theoretically and empirically.
The canonical NK transmission mechanism fails both theoretically and empirically.

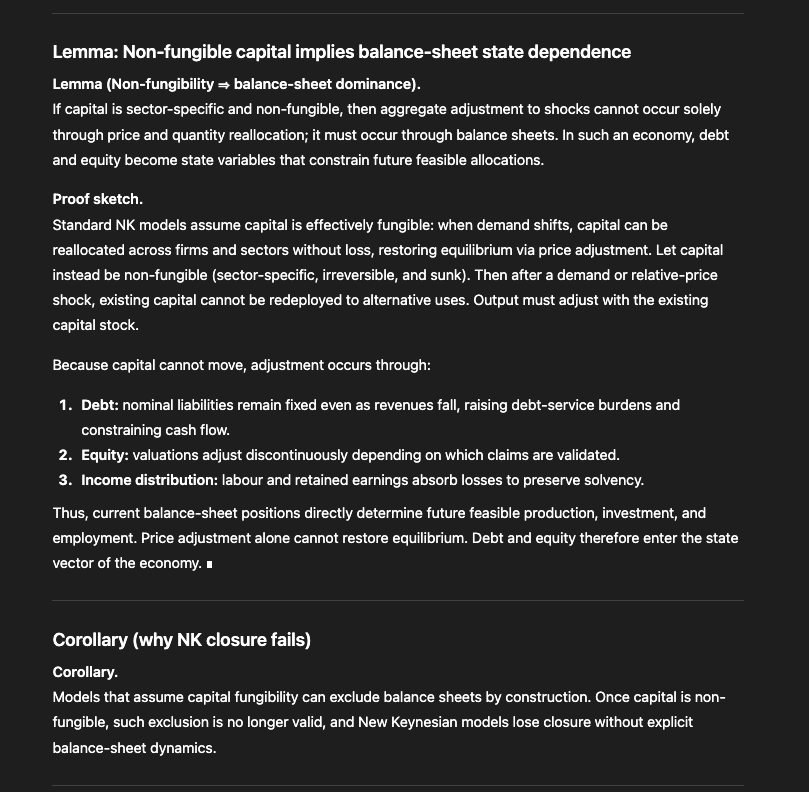
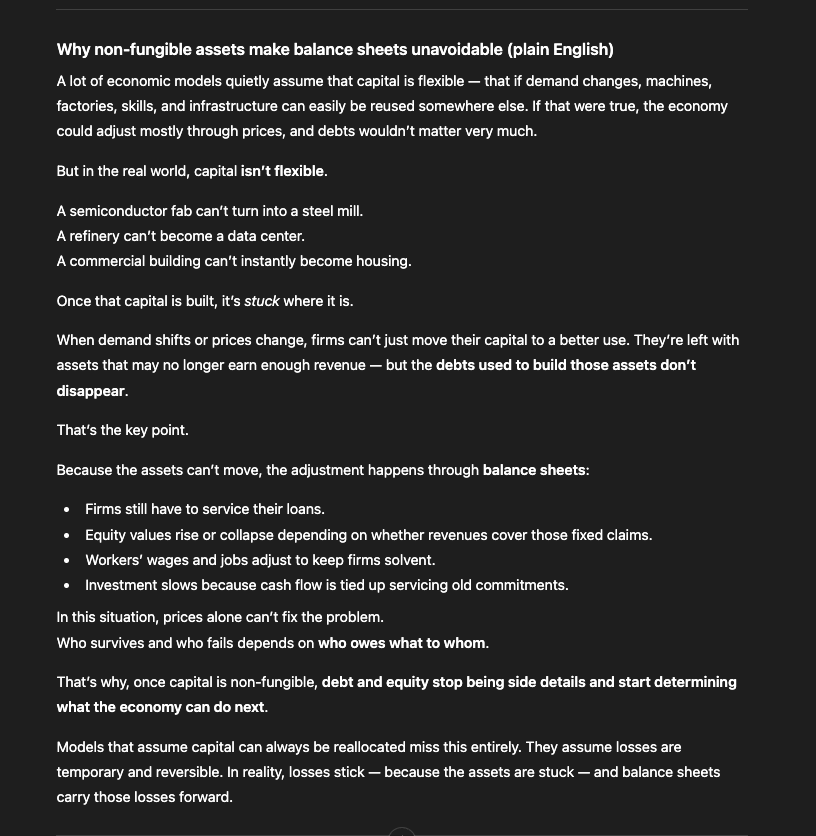
5. Interpretation: Balance-Sheet Transmission and Policy Implications
Labor-market outcomes are responses, not initiators.
Labor-market outcomes are responses, not initiators.

5.2 Why the NK Labor Mechanism Fails

5.3 Why Phillips-Curve Correlations Sometimes Look Valid

5.4 Policy Consequences
The labor market responds to inflationary cycles, not vice-versa
The labor market responds to inflationary cycles, not vice-versa

5.6 Avoiding Policy Error

5.8 A Model for the Modern Economy
Place labor market outcomes at the end of the chain, not the beginning
Place labor market outcomes at the end of the chain, not the beginning

6. Conclusion
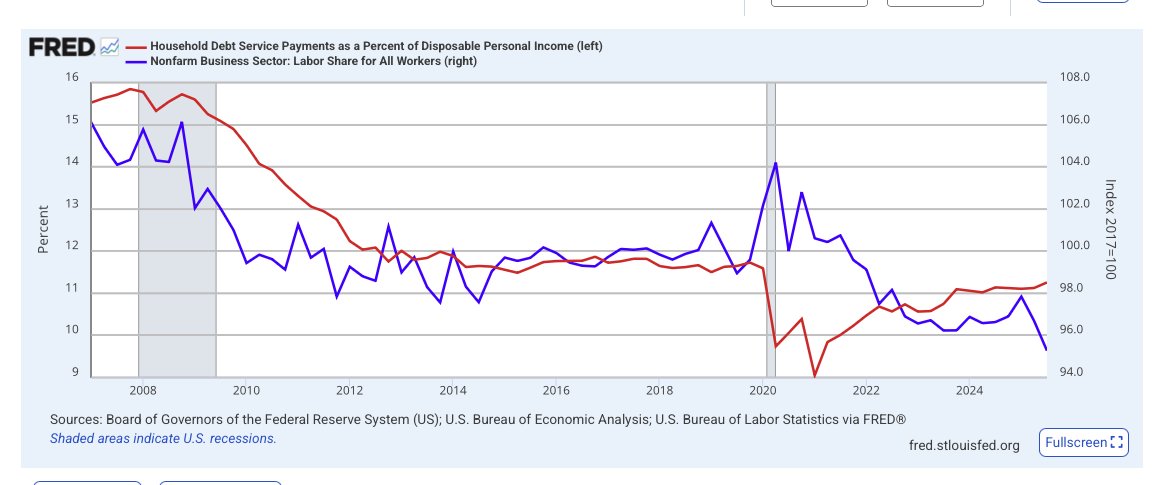
Using quarterly U.S. data from 1988–2024 and a comprehensive suite of empirical methods, we find no evidence supporting this mechanism. Instead, the data consistently show that credit expansion drives demand, services inflation responds first, and labor-market tightening and wage growth follow with lags.
Using quarterly U.S. data from 1988–2024 and a comprehensive suite of empirical methods, we find no evidence supporting this mechanism. Instead, the data consistently show that credit expansion drives demand, services inflation responds first, and labor-market tightening and wage growth follow with lags.

A. Data Appendix

B. Econometric Appendix

C. Robustness

Table 1. Descriptive Statistics (1988Q1–2024Q2)

Table 2. Granger Causality Results

Table 3. VAR Significance Summary

Table 4. Local Projection (LP) Significance by Horizon

Primary Causal Chain in the Data
Credit → Demand/Services Inflation → Labor Tightening → Wages
Credit → Demand/Services Inflation → Labor Tightening → Wages

Reviewer Defense Note: Why NK Causality Is Rejected

Interpretation for Reviewers

Conclusion of Defense
Inflation and wages do not originate in labor slack.
They originate in credit-demand dynamics, with labor conditions responding ex-post.
Inflation and wages do not originate in labor slack.
They originate in credit-demand dynamics, with labor conditions responding ex-post.

The labor channel is not a causal driver of inflation or wage dynamics in the United States.

it is a direction-of-causality result. The NK mechanism does not hold except via incidental co-movement driven by upstream credit cycles.

@threadreaderapp
unroll
unroll
• • •
Missing some Tweet in this thread? You can try to
force a refresh