1️⃣
We can remove fluid at rates up to 12 mL/kg/h and blood pressure often holds.
That limit isn’t arbitrary – it comes from dialysis data showing steep rises in hypotension and mortality above it.
It marks the upper boundary of how fast plasma can be refilled from the interstitium and lymph 👇
We can remove fluid at rates up to 12 mL/kg/h and blood pressure often holds.
That limit isn’t arbitrary – it comes from dialysis data showing steep rises in hypotension and mortality above it.
It marks the upper boundary of how fast plasma can be refilled from the interstitium and lymph 👇
2️⃣ The background
In most tissues, fluid filters out of capillaries and returns via the lymphatics.
At steady state, filtration ≈ lymph flow (~10 L/day ≈ 400 mL/h), so plasma and interstitial volumes stay constant.
This is the equilibrium that ultrafiltration later exploits.
In most tissues, fluid filters out of capillaries and returns via the lymphatics.
At steady state, filtration ≈ lymph flow (~10 L/day ≈ 400 mL/h), so plasma and interstitial volumes stay constant.
This is the equilibrium that ultrafiltration later exploits.
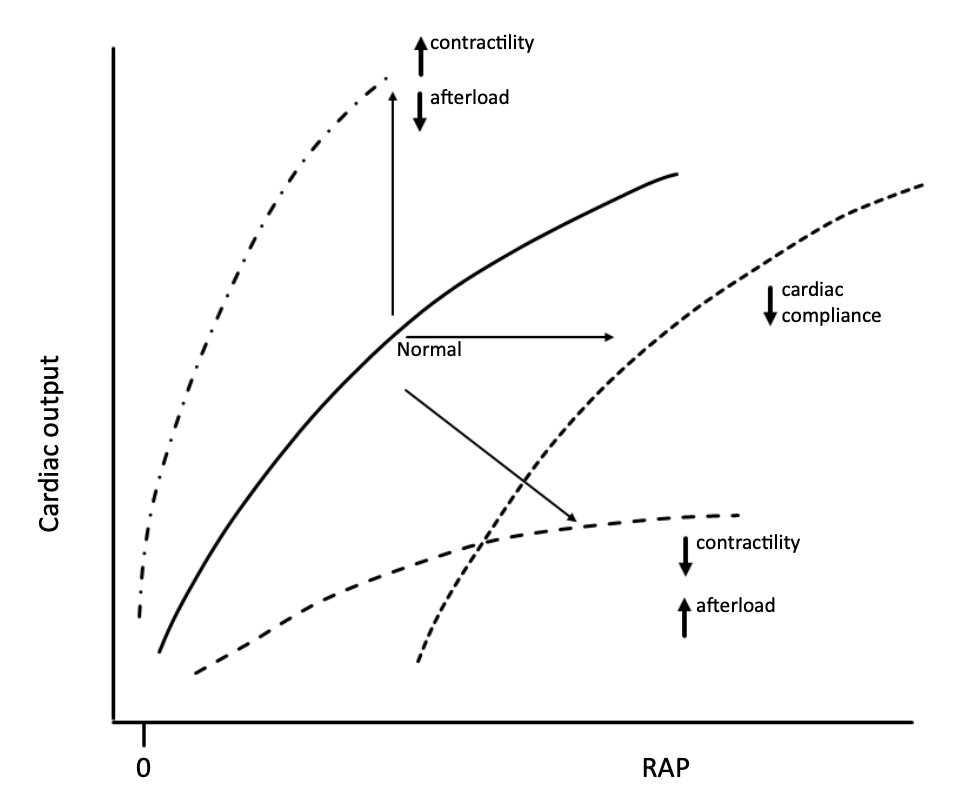
3️⃣ What ultrafiltration actually does
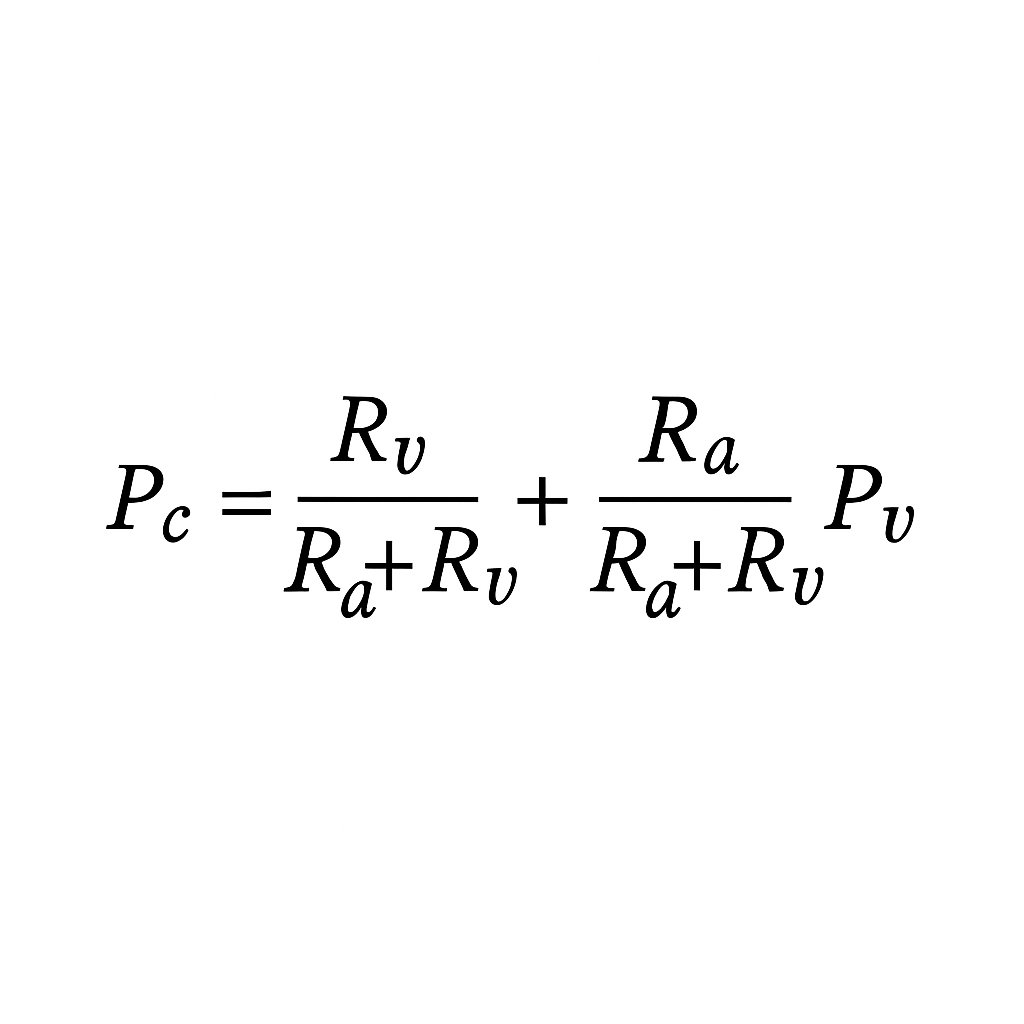
Removing plasma water slightly lowers blood volume and triggers reflex arteriolar constriction (↑ Ra).
That drops capillary pressure (Pc), pushing the microcirculation left on the J-curve.
Filtration falls toward zero — you’ve effectively turned off the tap that was sending ~400 mL/h into the interstitium.
4️⃣ Two sources of safe refill
Fluid can be removed without hypotension because refill is funded by:
• Stopped filtration (~400 mL/h you no longer lose)
• Ongoing lymphatic return (often 0.5–1 L/h in oedema)
Together they support removal rates approaching 12 mL/kg/h in oedematous patients.
Fluid can be removed without hypotension because refill is funded by:
• Stopped filtration (~400 mL/h you no longer lose)
• Ongoing lymphatic return (often 0.5–1 L/h in oedema)
Together they support removal rates approaching 12 mL/kg/h in oedematous patients.
5️⃣ The paradox resolved
If re-absorption “never happens,” how do we refill?
Because UF stops filtration while lymph keeps flowing.
Refill is therefore lymph-mediated, not venular suction – the circulation stays stable because lymph replaces what’s removed.
If re-absorption “never happens,” how do we refill?
Because UF stops filtration while lymph keeps flowing.
Refill is therefore lymph-mediated, not venular suction – the circulation stays stable because lymph replaces what’s removed.
6️⃣ Why oedematous patients tolerate higher rates
In oedema, interstitial pressure (Pi) is raised and lymphatics are already pumping hard.
Lymph flow can reach 0.5–1 L/h.
When Pc falls and filtration ceases, that lymph stream becomes a ready source of refill – the physiological reason we can remove up to ~12 mL/kg/h safely.
In oedema, interstitial pressure (Pi) is raised and lymphatics are already pumping hard.
Lymph flow can reach 0.5–1 L/h.
When Pc falls and filtration ceases, that lymph stream becomes a ready source of refill – the physiological reason we can remove up to ~12 mL/kg/h safely.
7️⃣ The compliance piece
While oedema is present, Pi is high and lymph flow is brisk – so fluid can be removed rapidly without hypovolaemia.
As UF continues and tissues de-oedematize, Pi falls, lymph drainage slows, and the refilling circuit collapses.
Beyond that point, further fluid removal draws directly from plasma volume – causing hypovolaemia.
8️⃣ Putting numbers on it
A 70 kg patient at 12 mL/kg/h ≈ 840 mL/h:
• You “save” ~400 mL/h by stopping filtration
• Add ~400–600 mL/h lymph return in oedema
That’s why MAP and filling pressures can stay stable even during aggressive fluid removal.
A 70 kg patient at 12 mL/kg/h ≈ 840 mL/h:
• You “save” ~400 mL/h by stopping filtration
• Add ~400–600 mL/h lymph return in oedema
That’s why MAP and filling pressures can stay stable even during aggressive fluid removal.
9️⃣ When refill limits are reached
Two microvascular regimes set the ceiling for safe UF 👇
1/ Leaky circuit – glycocalyx injury
The oncotic brake is lost, so filtration persists even at low Pc.
Refill becomes lymph-limited: the faster the lymph drains, the faster you can safely remove fluid.
2/ Sealed circuit – intact glycocalyx, low Pc
Here Jv ≈ 0 once Pc falls left of the J-point.
The ~400 mL/h that normally filters out is “saved,” adding to lymph flow and allowing faster UF – until lymph drainage slows as oedema resolves.
Clinical signs of reaching the limit: rising HR, falling MAP, delayed cap-refill, haemoconcentration.
🔟 Tailoring the rate
Safe removal depends on clinical state, not a single number.
Severe oedema with organ failure: lymph flow high → remove fluid quickly.
Mild oedema, limited organ failure: lymph reserve low → go slower to avoid hypovolaemia.
Lowering Pc (via α-tone or relieving venous congestion) reduces further filtration, preserving plasma volume as lymph continues to drain.
1️⃣1️⃣RRT hypotension – often misattributed
When RRT first starts, the extracorporeal circuit briefly sequesters 300–500 mL of blood, causing a transient dip in circulating volume and pressure before lymphatic refill and vascular tone re-equilibrate.
Hypotension on RRT has many causes (for another thread), but true hypovolaemia is usually low on the list – it’s often blamed because we misunderstand refill physiology.
1️⃣2️⃣The takeaway
You’re not “sucking blood volume out” with RRT – you’re harvesting lymph while turning off filtration.
That’s why the circulation stays full even as total body water falls.
The 12 mL/kg/h limit reflects the maximum rate that refilling circuit can sustain.
You’re not “sucking blood volume out” with RRT – you’re harvesting lymph while turning off filtration.
That’s why the circulation stays full even as total body water falls.
The 12 mL/kg/h limit reflects the maximum rate that refilling circuit can sustain.
1️⃣3️⃣ One-liner to teach with
“Safe ultrafiltration works because you stop making interstitial fluid and keep draining it.”
Not re-absorption – lymph-mediated refill.
“Safe ultrafiltration works because you stop making interstitial fluid and keep draining it.”
Not re-absorption – lymph-mediated refill.
1️⃣4️⃣ Next time
We’ll tackle the myth of being “oedematous but intravascularly dry” and why that's impossible at steady state.
If you've found this thread useful please like, comment and repost
#FOAMed #ICU #Physiology #CRRT @NephroP
We’ll tackle the myth of being “oedematous but intravascularly dry” and why that's impossible at steady state.
If you've found this thread useful please like, comment and repost
#FOAMed #ICU #Physiology #CRRT @NephroP
• • •
Missing some Tweet in this thread? You can try to
force a refresh