James Young Profile picture
Nov 15 17 tweets 4 min read Read on X
Kalecki–Young Sectoral Inflation Decomposition (KYSID)

"It lets you both model inflation and attribute it sectorally—to wages, productivity, domestic debt saturation, and the external / tradables channel—within a consistent stock–flow, income‑distribution perspective." Image
Kalecki–Young Sectoral Inflation Decomposition (KYSID) Image
Kalecki’s mark‑up pricing and inflation Image
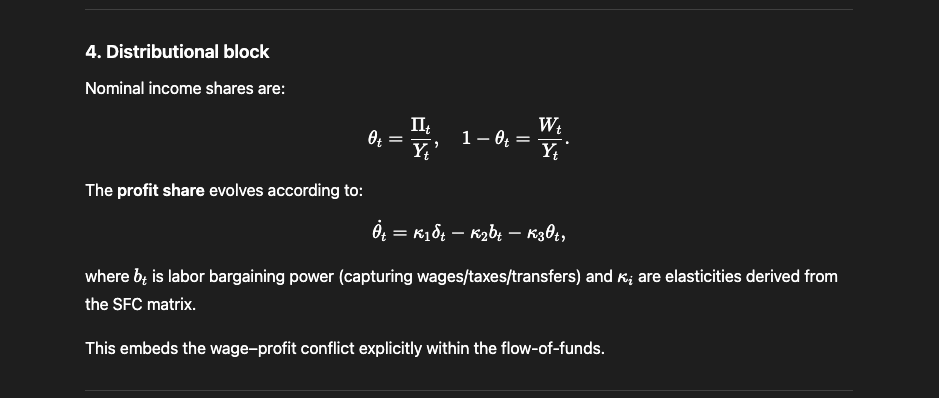
From mark‑ups to the profit share Image
Equation (K3) is the Kalecki distributional inflation equation: inflation depends on wage growth, productivity growth, and changes in the core profit share, scaled by the wage share 1−θ Image
Step 3 – Young’s claim‑dilution ratio

"meaning: excess credit over productive equity tends to raise the core profit share." Image
This is the closed‑economy Kalecki–Young model. Image
Step 4 – Open‑economy extension: adding the tradables channel (KYCD‑T) Image
Image
Step 5 – Sectoral decomposition: KYSID Image
This is the Kalecki–Young Sectoral Inflation Decomposition (KYSID): an inflation framework grounded in Kalecki’s pricing and distribution, enriched by Young’s balance‑sheet concept of claim dilution and extended to an open economy. Image
Stock–flow perspective on ΔDebt, ΔPE and NX Image
Stylised stock–flow matrix (changes over period t) Image
Why δ is “excess claim creation”

...."is the net increase in nominal claims on future domestic income not matched by new productive backing." Image
is the net increase in nominal claims on future domestic income not matched by new productive backing. Image
Where NX fits Image
@threadreaderapp

unroll

• • •

Missing some Tweet in this thread? You can try to force a refresh
 

Keep Current with James Young

James Young Profile picture

Stay in touch and get notified when new unrolls are available from this author!

Read all threads

This Thread may be Removed Anytime!

PDF

Twitter may remove this content at anytime! Save it as PDF for later use!

Try unrolling a thread yourself!

how to unroll video
  1. Follow @ThreadReaderApp to mention us!

  2. From a Twitter thread mention us with a keyword "unroll"
@threadreaderapp unroll

Practice here first or read more on our help page!

More from @JamesYo43532848

Nov 17
Why Kalecki, Godley, and Minsky Are Unified Image
Kalecki provides the Income–Distribution Structure Image
Godley provides the Financing–Balance Sheet Structure Image
Read 10 tweets
Nov 16
Kalecki = Godley: The Unified Income–Financing Identity

A central result of this paper is that Kalecki’s profit identity and Godley’s sectoral balances identity are not separate theoretical constructions but two expressions of the same underlying mechanism, viewed from different sides of the national accounts.Image
Kalecki presents the income side; Godley presents the financing side.
Once placed within a stock–flow consistent (SFC) framework, the equivalence becomes exact. Image
Godley’s Sectoral Balances Identity (Financing View) Image
Read 22 tweets
Nov 15
Stock–Flow Consistent Formulation of
Kalecki–Young Sectoral Inflation Decomposition (KYSID)

"Recasting KYSID within a stock–flow consistent (SFC) framework clarifies that the inflation process is a balance-sheet outcome." Image
Core flow-of-funds identity Image
Distributional block Image
Read 7 tweets
Nov 13
Empirically, U.S. Inflation Follows the Kalecki Distributional Equation

Inflation in the United States is primarily profit-led in structure, wage-amplified in the short run, and productivity-limited in scope. Image
This relation implies that inflation arises from the distribution of income between labor and capital, not from expectations. Image
Regression Results Image
Read 6 tweets
Nov 8
The Constant-Rate Interest Burden as the Hidden Driver of Capital Share: Evidence from Balance-Sheet Saturation

This balance-sheet mechanism explains the secular rise in the capital share and the decline in labor share observed since the 1980s without appealing to exogenous technology shocks.Image
Conceptually, it represents the interest-service load that would prevail if monetary policy had not reduced nominal rates in response to debt expansion. While the actual burden rtL/Y fluctuates with policy cycles, the constant-rate version isolates the structural leverage component, reflecting the underlying stock of liabilities relative to income.Image
Data and Methodology Image
Read 21 tweets
Nov 3
Ergodicity vs expected-utility assumes the return distribution is exogenous.
But in a credit economy, returns are endogenously driven by balance-sheet expansion (A≈L).
Investors maximize share of system claims subject to leverage guardrails — not abstract utility or stationary distributions.
Kelly works within a balance-sheet regime, not instead of one.
Read 17 tweets

Did Thread Reader help you today?

Support us! We are indie developers!


This site is made by just two indie developers on a laptop doing marketing, support and development! Read more about the story.

Become a Premium Member ($3/month or $30/year) and get exclusive features!

Become Premium

Don't want to be a Premium member but still want to support us?

Make a small donation by buying us coffee ($5) or help with server cost ($10)

Donate via Paypal

Or Donate anonymously using crypto!

Ethereum

0xfe58350B80634f60Fa6Dc149a72b4DFbc17D341E copy

Bitcoin

3ATGMxNzCUFzxpMCHL5sWSt4DVtS8UqXpi copy

Thank you for your support!

Follow Us!

:(