
PMC COVlD Update, Week of Nov 24, 2025 (U.S.)
🧵1/10
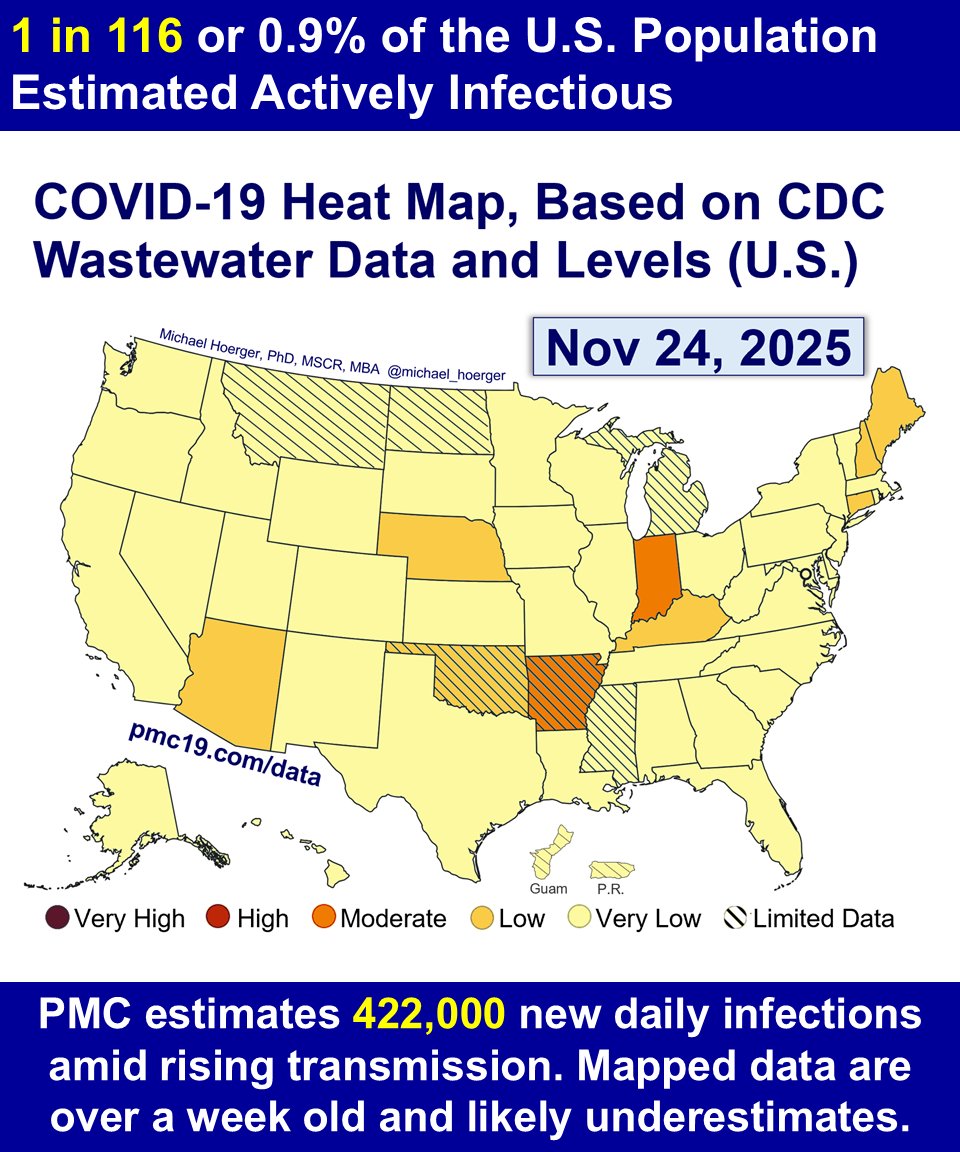
With CDC data operational again, the transmission map is back. The data are always a week old, so transmission is likely worse than depicted.
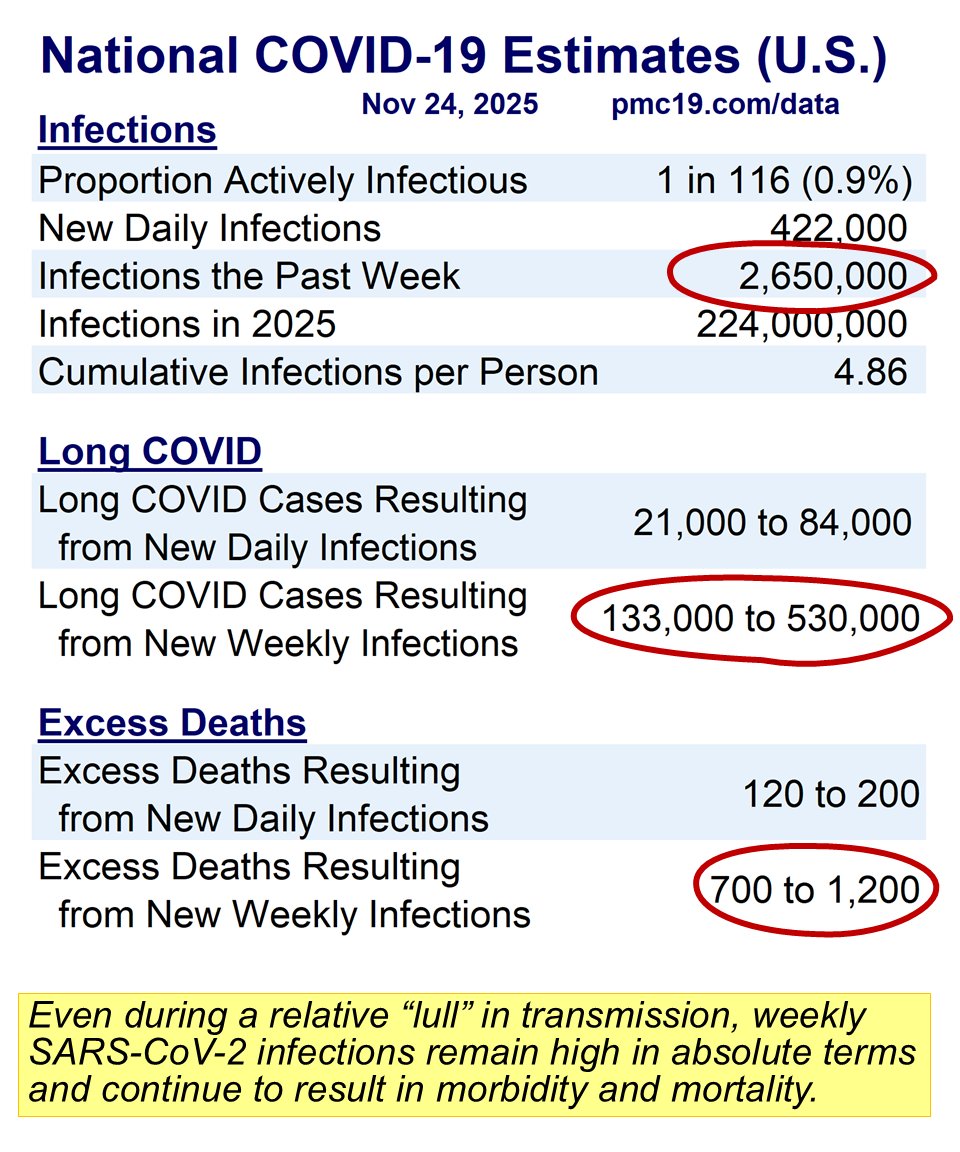
We estimate 1 in 116 people actively infectious and 422,000 new daily infections.
🧵1/10
With CDC data operational again, the transmission map is back. The data are always a week old, so transmission is likely worse than depicted.
We estimate 1 in 116 people actively infectious and 422,000 new daily infections.
PMC COVlD Update, Week of Nov 24, 2025 (U.S.)
🧵2/10
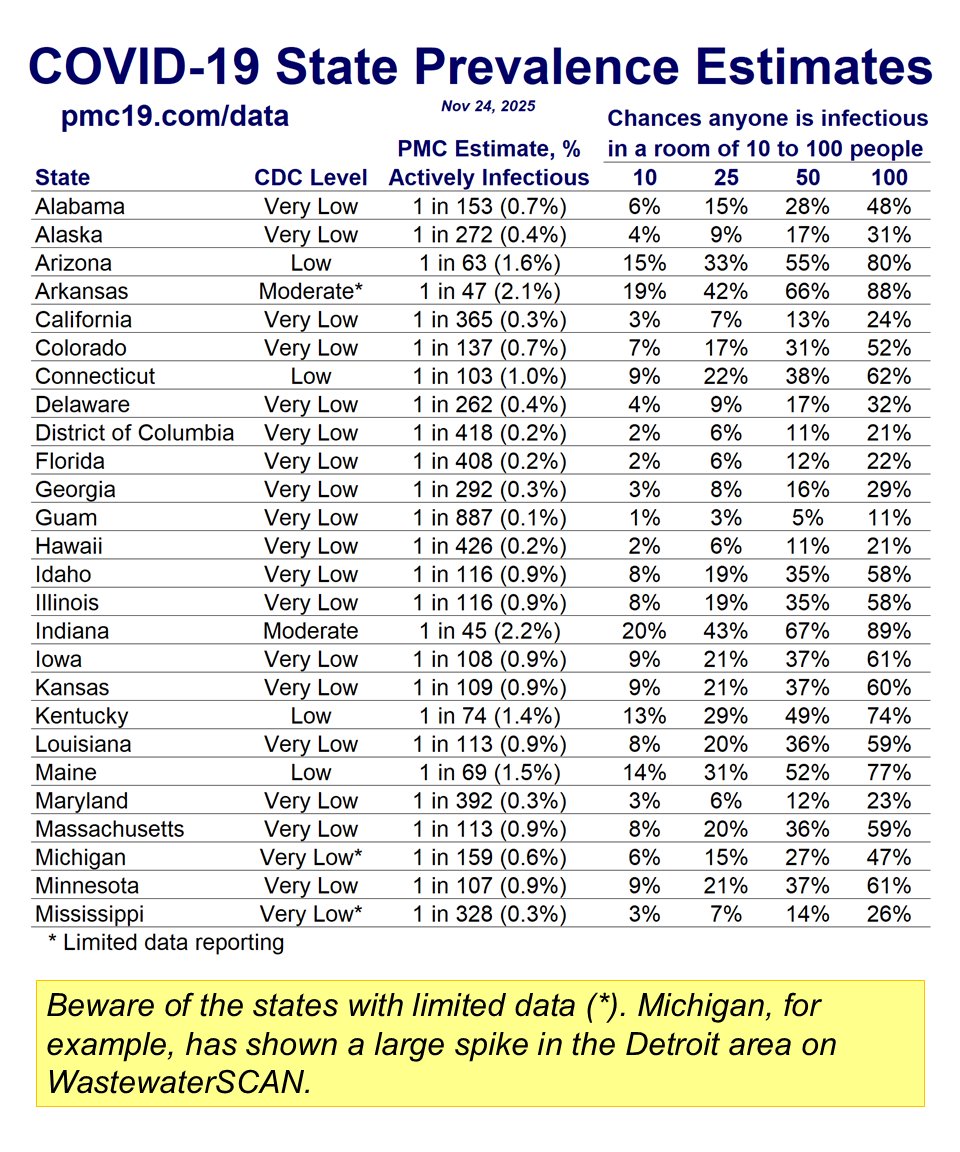
State level estimates are back. Note, the CDC changed their data processing approach in August, which tends to downplay transmission.
Does 1 in 45 in Indiana seem "moderate"?
Levels in MI may be mod/high (poor reporting).
🧵2/10
State level estimates are back. Note, the CDC changed their data processing approach in August, which tends to downplay transmission.
Does 1 in 45 in Indiana seem "moderate"?
Levels in MI may be mod/high (poor reporting).
PMC COVlD Update, Week of Nov 24, 2025 (U.S.)
🧵3/10
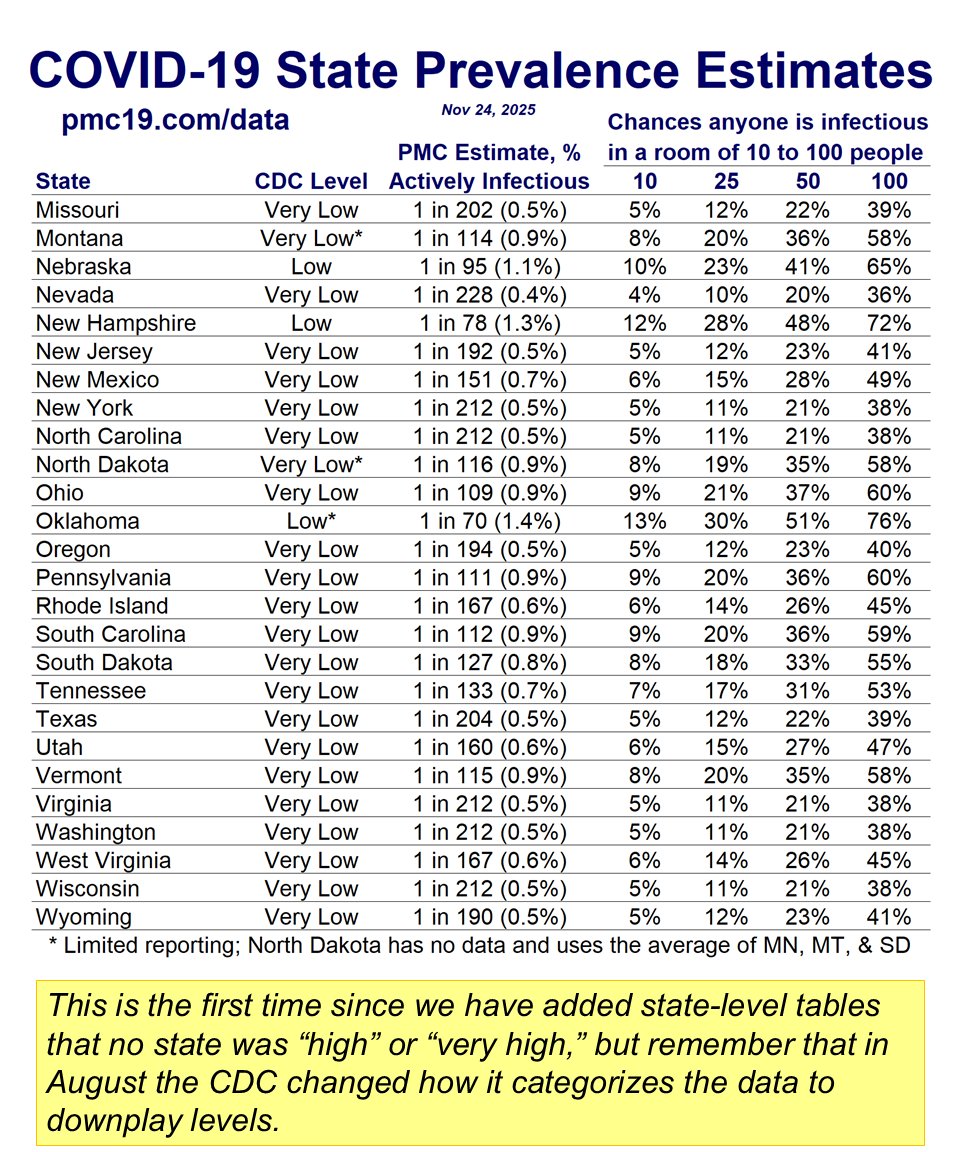
State-level estimates (continued).
Current levels may be much higher than noted here. Note that CDC data are always at least a week old. The 2nd half of November is a time period historically of accelerating transmission.
🧵3/10
State-level estimates (continued).
Current levels may be much higher than noted here. Note that CDC data are always at least a week old. The 2nd half of November is a time period historically of accelerating transmission.
PMC COVlD Update, Week of Nov 24, 2025 (U.S.)
🧵4/10
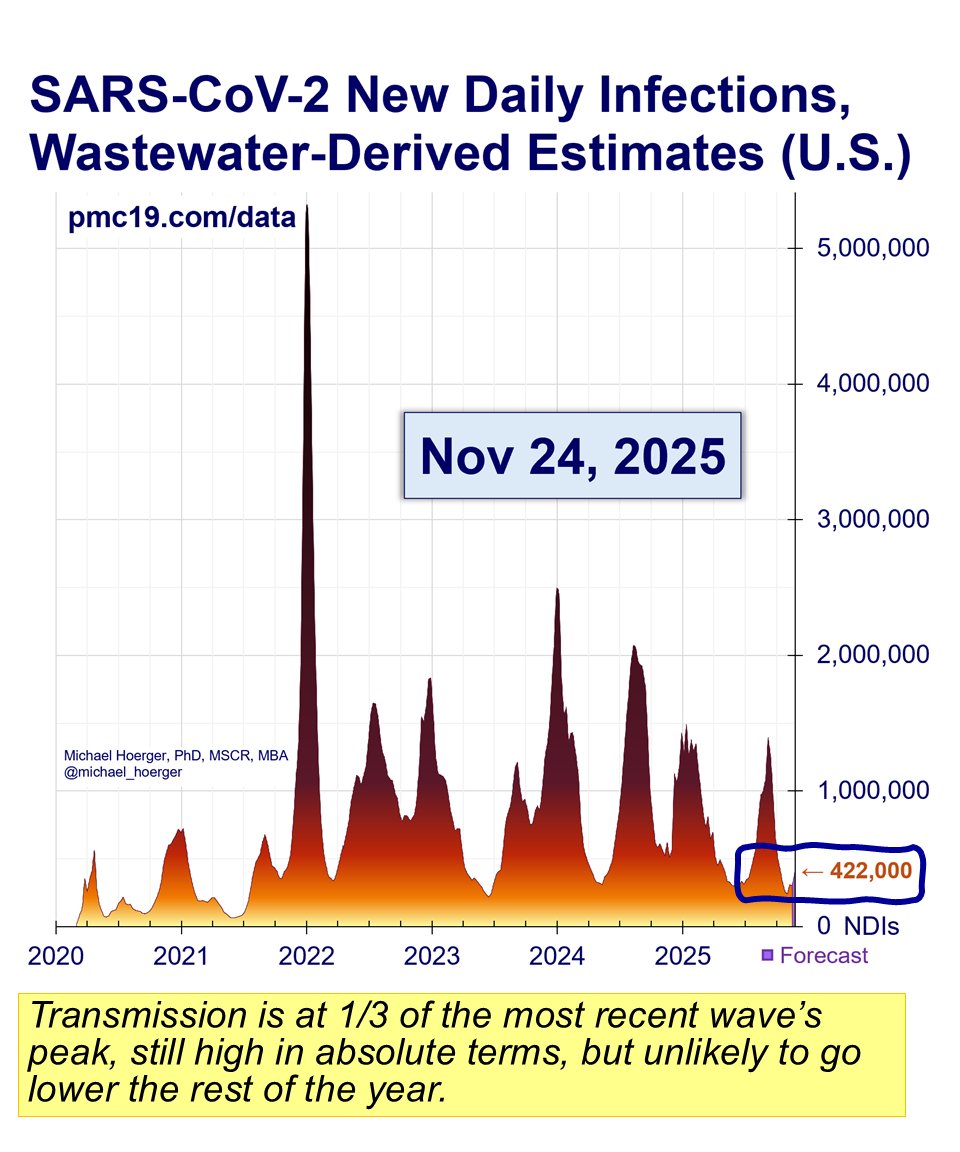
Transmission is estimated as low in the relative sense (1/3 of the recent wave peak) but high in the absolute sense (422,000 new daily).
On Dec 1 or 5, we should have more definitive info on the potential 12th wave.
🧵4/10
Transmission is estimated as low in the relative sense (1/3 of the recent wave peak) but high in the absolute sense (422,000 new daily).
On Dec 1 or 5, we should have more definitive info on the potential 12th wave.
PMC COVlD Update, Week of Nov 24, 2025 (U.S.)
🧵5/10
New weekly infections are estimated to result in considerable morbidity and excess mortality.
🧵5/10
New weekly infections are estimated to result in considerable morbidity and excess mortality.
PMC COVlD Update, Week of Nov 24, 2025 (U.S.)
🧵6/10
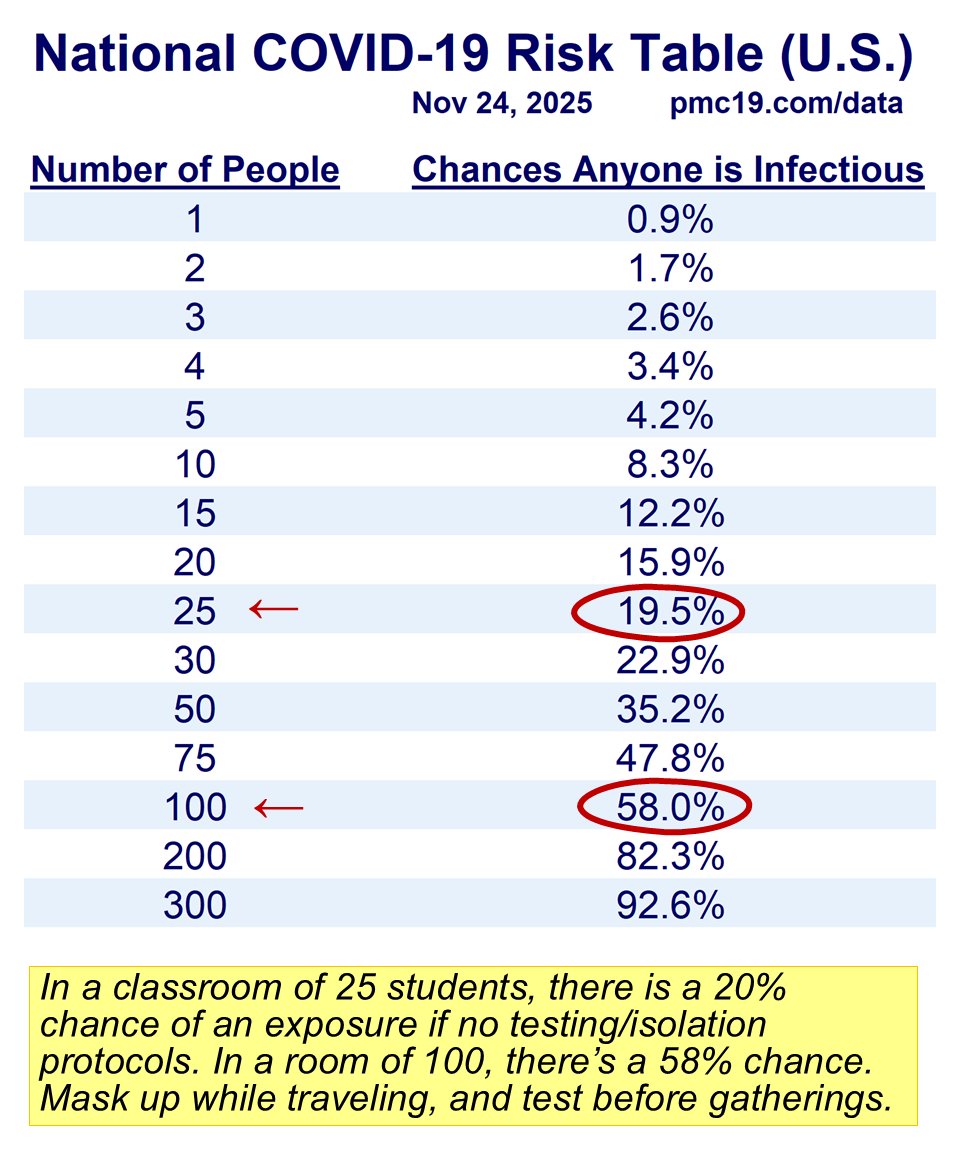
If you joined 1,000 people for a funeral last week or plan to see family soon for Thanksgiving, remember exposure risk remains high in larger gatherings.
#MaskUp, test, clean the air, and get boosted ASAP.
🧵6/10
If you joined 1,000 people for a funeral last week or plan to see family soon for Thanksgiving, remember exposure risk remains high in larger gatherings.
#MaskUp, test, clean the air, and get boosted ASAP.
PMC COVlD Update, Week of Nov 24, 2025 (U.S.)
🧵7/10
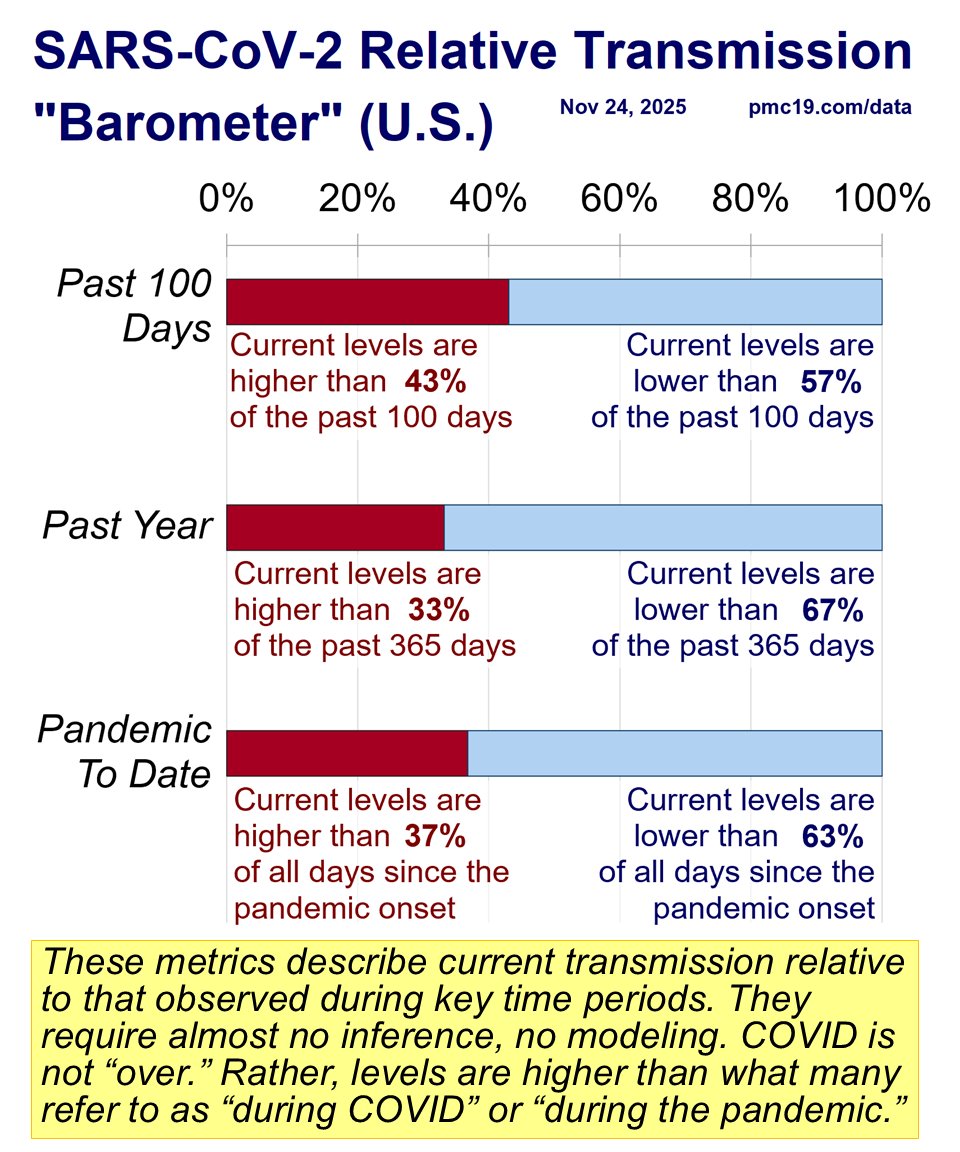
We have revived the old dashboard pie chart, now in "barometer" form. #CovidIsNotOver. #DuringCOVID is today.
There's more COVID out there than 37% of the days since the pandemic began.
🧵7/10
We have revived the old dashboard pie chart, now in "barometer" form. #CovidIsNotOver. #DuringCOVID is today.
There's more COVID out there than 37% of the days since the pandemic began.
PMC COVlD Update, Week of Nov 24, 2025 (U.S.)
🧵8/10
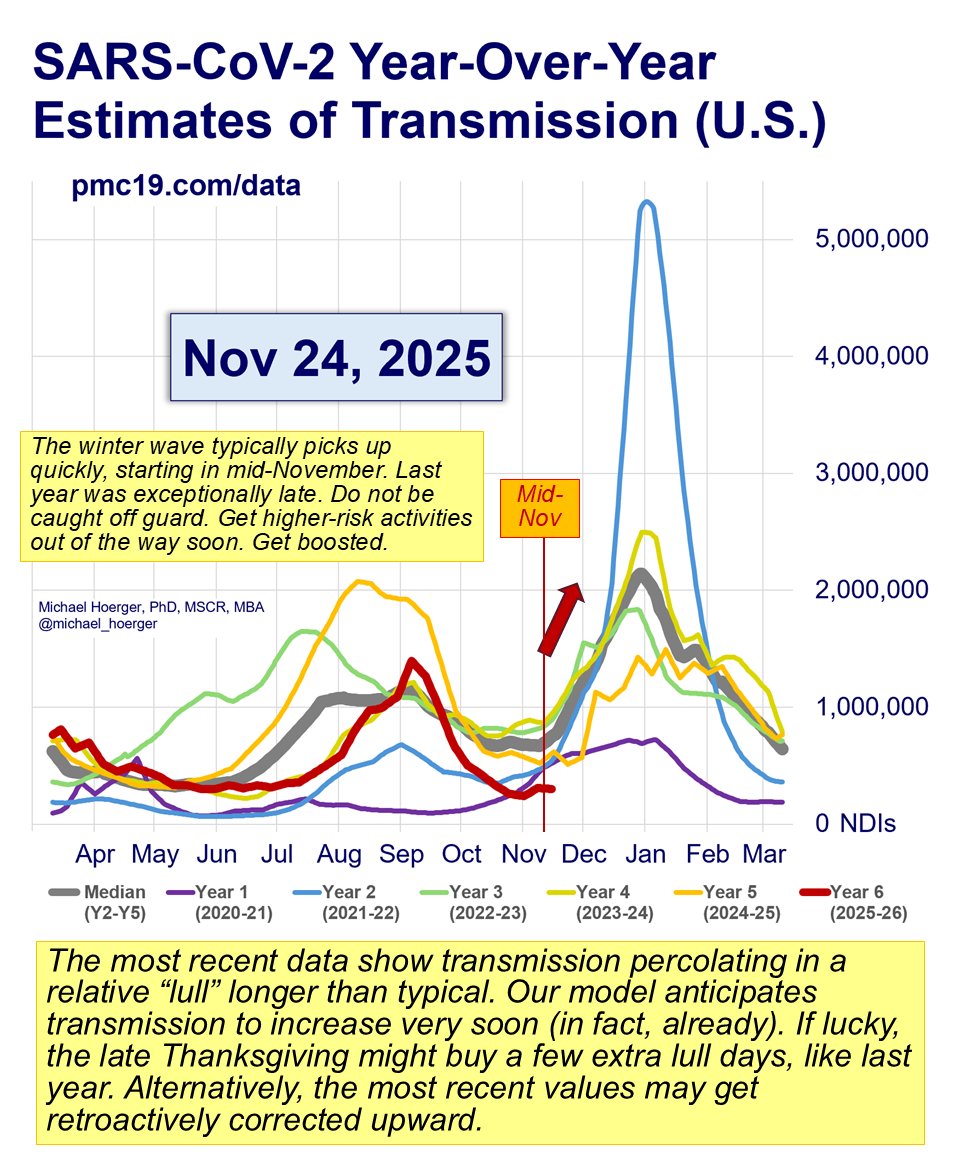
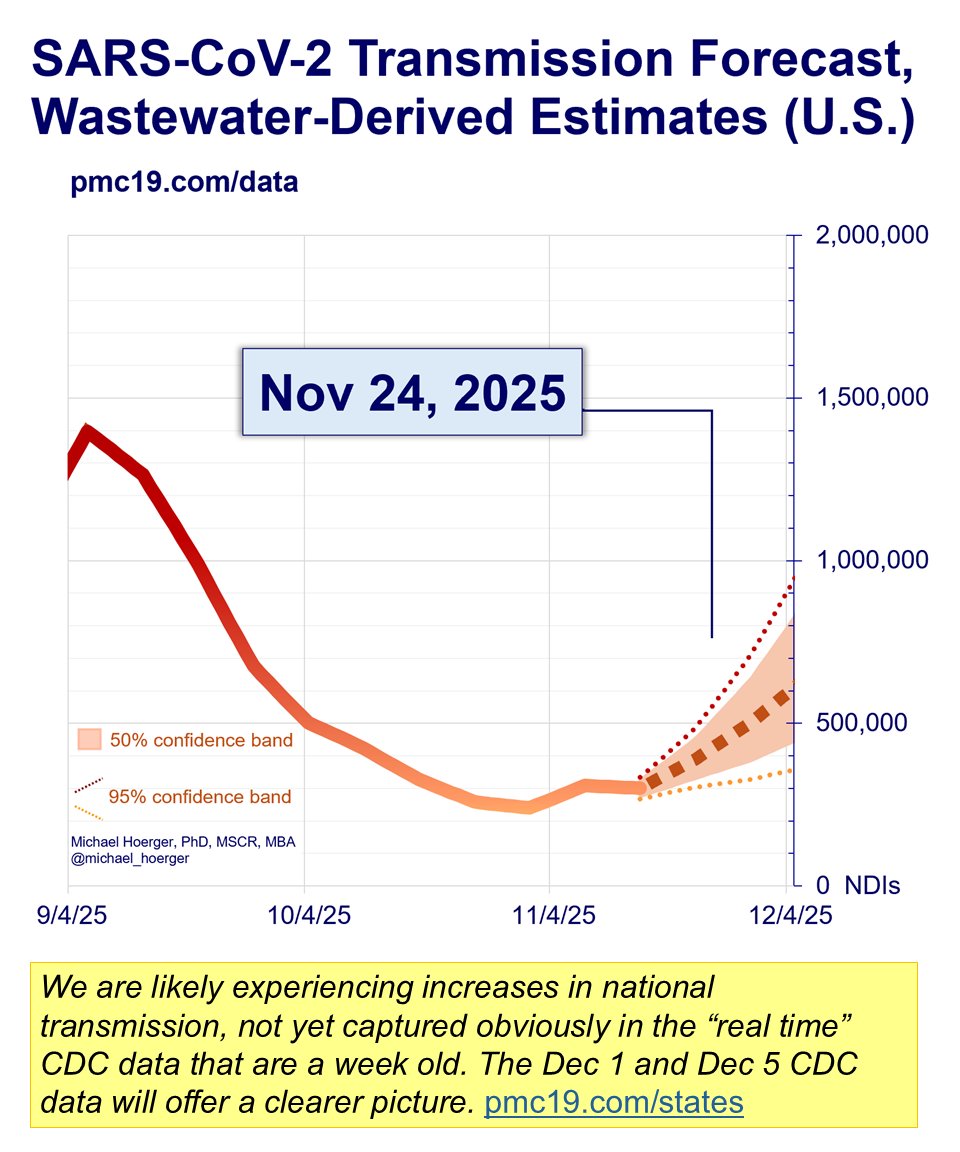
Recent transmission (red line) has percolated in a lull longer than usual. Those CDC data are >1 week old.
We may see a later wave onset than usual (like last year), or the most recent data may get corrected upward.
🧵8/10
Recent transmission (red line) has percolated in a lull longer than usual. Those CDC data are >1 week old.
We may see a later wave onset than usual (like last year), or the most recent data may get corrected upward.
PMC COVlD Update, Week of Nov 24, 2025 (U.S.)
🧵9/10
A forecasting model allows one to formalize all of the variables one might use to predict future transmission. We expect to surpass 500,000 new daily infections around the end of the month.
We may not know that until 12/1 (bad news), 12/5 (likely), or 12/12 (late onset wave) because of the reporting lags.
Any day now, you will start to hear of people who do not track these data closely claiming that the winter will be "mild." That's a misunderstanding of reporting lags, historical transmission, and forecasting.
Use our state-level directory to keep tabs on what's happening closer to home. Even in the "very low" states, some places have high or very high transmission.
PMC COVlD Update, Week of Nov 24, 2025 (U.S.)
🧵10/10
Now's the time to restock on tests, masks, and air filters, and get boosted if one has delayed doing so.
Thanks for your help in getting the word out. 🙏
🧵10/10
Now's the time to restock on tests, masks, and air filters, and get boosted if one has delayed doing so.
Thanks for your help in getting the word out. 🙏
https://x.com/michael_hoerger/status/1992644060566421992
• • •
Missing some Tweet in this thread? You can try to
force a refresh


