🚨🧵 SLV just added 9,000,000 shares in ONE day.
That’s not “paper.” That’s PHYSICAL SILVER getting locked up.
And the detail everyone missed?
Price didn’t dump… it rallied. 👀
That’s not “paper.” That’s PHYSICAL SILVER getting locked up.
And the detail everyone missed?
Price didn’t dump… it rallied. 👀
https://twitter.com/mypreciousilver/status/1993225089202991436
1️⃣
9M new SLV shares = new metal has to show up.
Rough math: ~0.90 oz per share (after fees).
That’s ~8.17 million oz ≈ 254 metric tons of silver.
9M new SLV shares = new metal has to show up.
Rough math: ~0.90 oz per share (after fees).
That’s ~8.17 million oz ≈ 254 metric tons of silver.
2️⃣
Think about what that means:
254 tons moved into ETF custody and becomes encumbered by the trust structure.
➡️ Free float goes DOWN.
Think about what that means:
254 tons moved into ETF custody and becomes encumbered by the trust structure.
➡️ Free float goes DOWN.
3️⃣
Free float = the “available” pool that can actually move, deliver, and settle stress.
When ETFs absorb metal, the market loses circulating liquidity.
That’s how squeezes start:
Not with headlines… with inventory getting sticky.
Free float = the “available” pool that can actually move, deliver, and settle stress.
When ETFs absorb metal, the market loses circulating liquidity.
That’s how squeezes start:
Not with headlines… with inventory getting sticky.
4️⃣
Now the really interesting part:
You’ll often notice a pattern:
✅ Big SLV share creations
↘️ and silver price falling (or getting capped)
Because creations can appear during selling/hedging flows.
Now the really interesting part:
You’ll often notice a pattern:
✅ Big SLV share creations
↘️ and silver price falling (or getting capped)
Because creations can appear during selling/hedging flows.
5️⃣
But yesterday?
No cap. No dump. No rug.
Silver went UP anyway.
That’s a tell.
But yesterday?
No cap. No dump. No rug.
Silver went UP anyway.
That’s a tell.
6️⃣
If the market can absorb 254 tons being locked and still rise, it suggests:
🔥 The underlying bid is stronger than the usual “pressure valve.”
🔥 Physical tightness is creeping into the price mechanism.
If the market can absorb 254 tons being locked and still rise, it suggests:
🔥 The underlying bid is stronger than the usual “pressure valve.”
🔥 Physical tightness is creeping into the price mechanism.
7️⃣
They had to bring in a truckload of metal…
…and the market said:
“Cool. We’ll take that too.” 😈
They had to bring in a truckload of metal…
…and the market said:
“Cool. We’ll take that too.” 😈
8️⃣
So what does it likely signal?
✅ Physical demand is real, persistent
✅ Wholesale bars are being pulled into “non-floating” hands
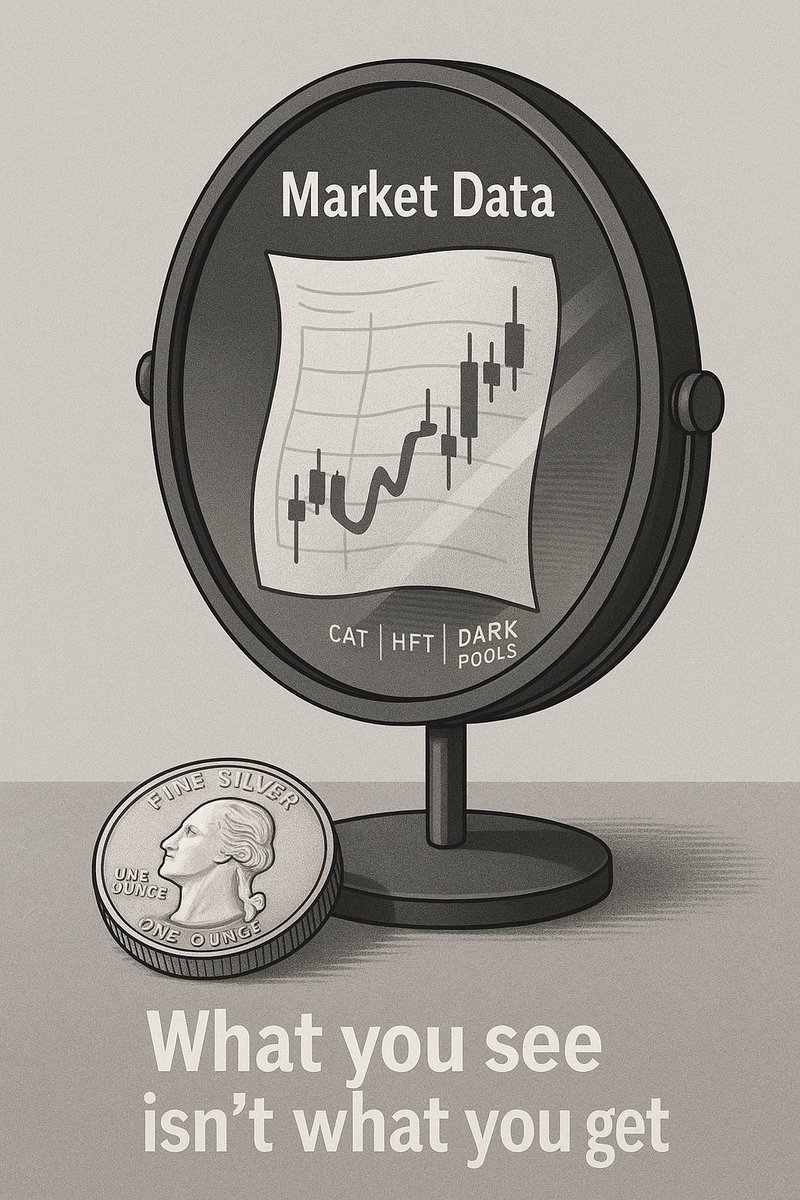
✅ The paper market is having a harder time dominating the tape
So what does it likely signal?
✅ Physical demand is real, persistent
✅ Wholesale bars are being pulled into “non-floating” hands
✅ The paper market is having a harder time dominating the tape
9️⃣
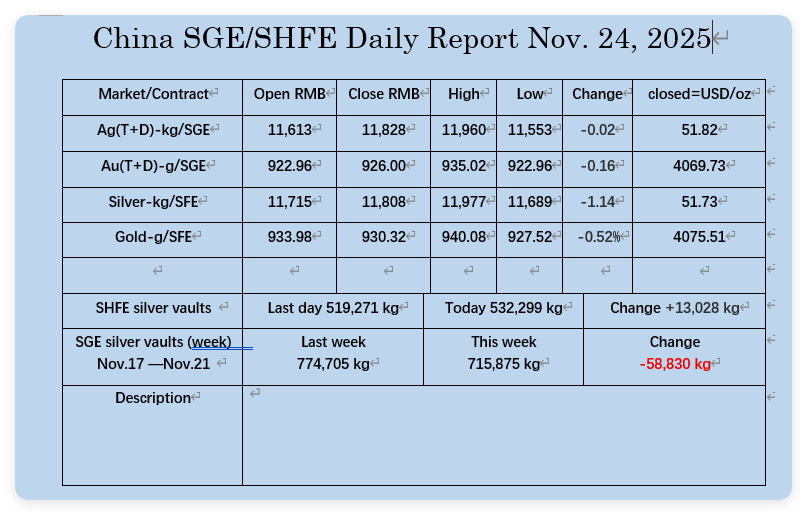
And zoom out: China has been draining visible inventories hard (SGE/SHFE).
Now the West is also locking metal into ETFs.
That’s a two-front drain.
And zoom out: China has been draining visible inventories hard (SGE/SHFE).
Now the West is also locking metal into ETFs.
That’s a two-front drain.
1⃣0️⃣
If this keeps happening, watch what breaks first:
📌 spot premiums
📌 futures spreads
📌 delivery stress / tightness signals
📌 “Where’s the metal coming from?” questions
If this keeps happening, watch what breaks first:
📌 spot premiums
📌 futures spreads
📌 delivery stress / tightness signals
📌 “Where’s the metal coming from?” questions
1⃣1️⃣
Stacker takeaway:
You don’t need to “time the top.”
You need to own the metal before the scramble.
Because when free float shrinks, price doesn’t move smoothly…
It jumps.
Stacker takeaway:
You don’t need to “time the top.”
You need to own the metal before the scramble.
Because when free float shrinks, price doesn’t move smoothly…
It jumps.
1⃣2️⃣
This isn’t hype.
It’s mechanics.
254 tons got tied up… and price STILL climbed.
That’s not normal behavior in a loose market.
That’s what a tightening market looks like. ⏳🪙
#Silver #SLV #PhysicalSilver #SilverSqueeze #Stackers
This isn’t hype.
It’s mechanics.
254 tons got tied up… and price STILL climbed.
That’s not normal behavior in a loose market.
That’s what a tightening market looks like. ⏳🪙
#Silver #SLV #PhysicalSilver #SilverSqueeze #Stackers
@threadreaderapp unroll
• • •
Missing some Tweet in this thread? You can try to
force a refresh