😮I want to smash something.
I've just stumbled across the official NHS coding guidance for U07.3 - 'Personal history of Covid-19' - and it left me on the floor.
🚨When paired with the data on the number of times it is currently used, it is a huge unknown national scandal.
I've just stumbled across the official NHS coding guidance for U07.3 - 'Personal history of Covid-19' - and it left me on the floor.
🚨When paired with the data on the number of times it is currently used, it is a huge unknown national scandal.

The ICD-10 codes are the codes that are entered into NHS hospitals activity databases.
So when someone gets healthcare, it's for a reason, so they look up the code for that reason, and put the code into the database.
So when someone gets healthcare, it's for a reason, so they look up the code for that reason, and put the code into the database.
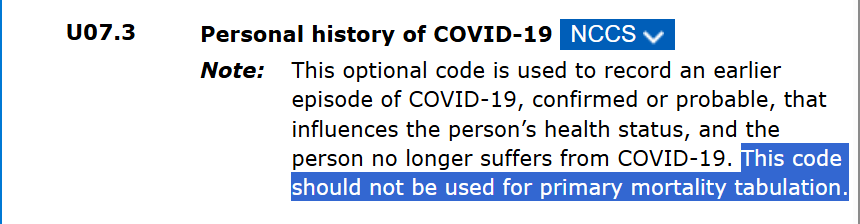
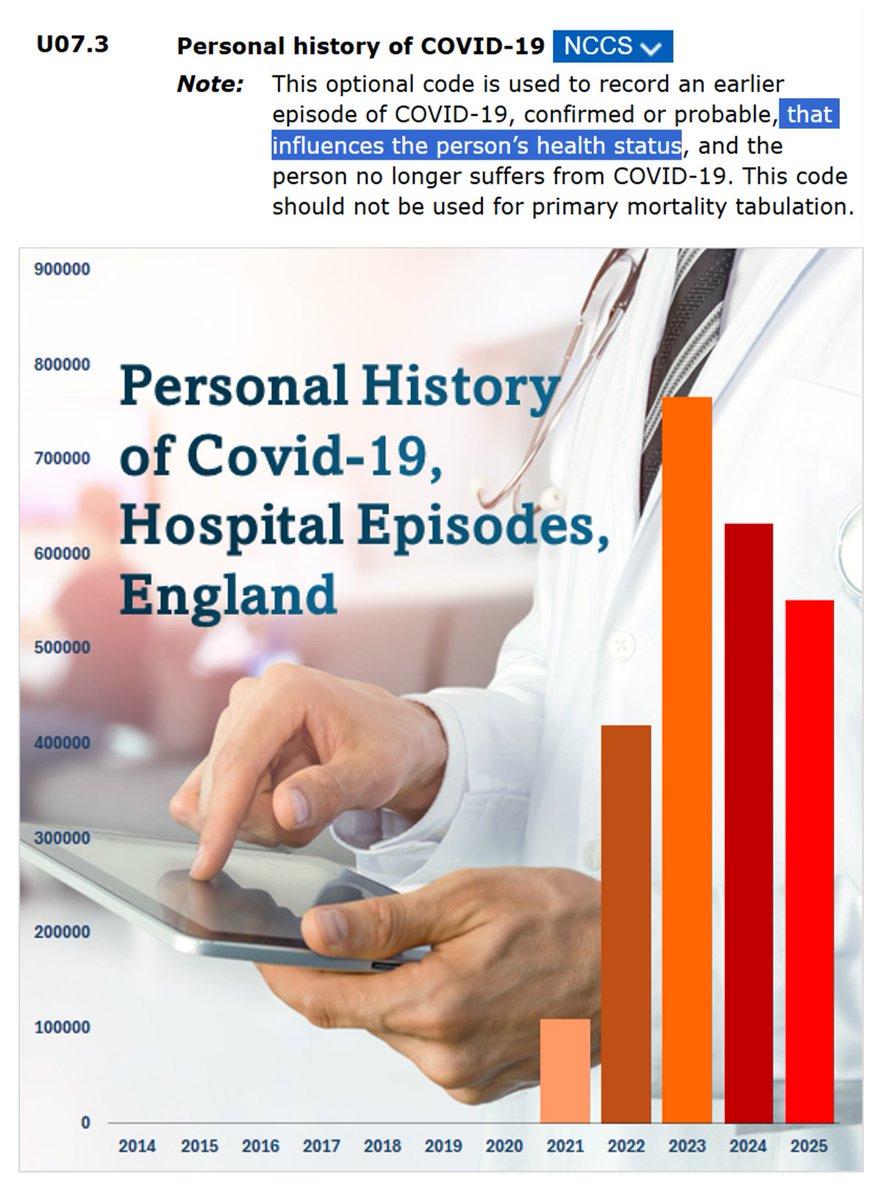
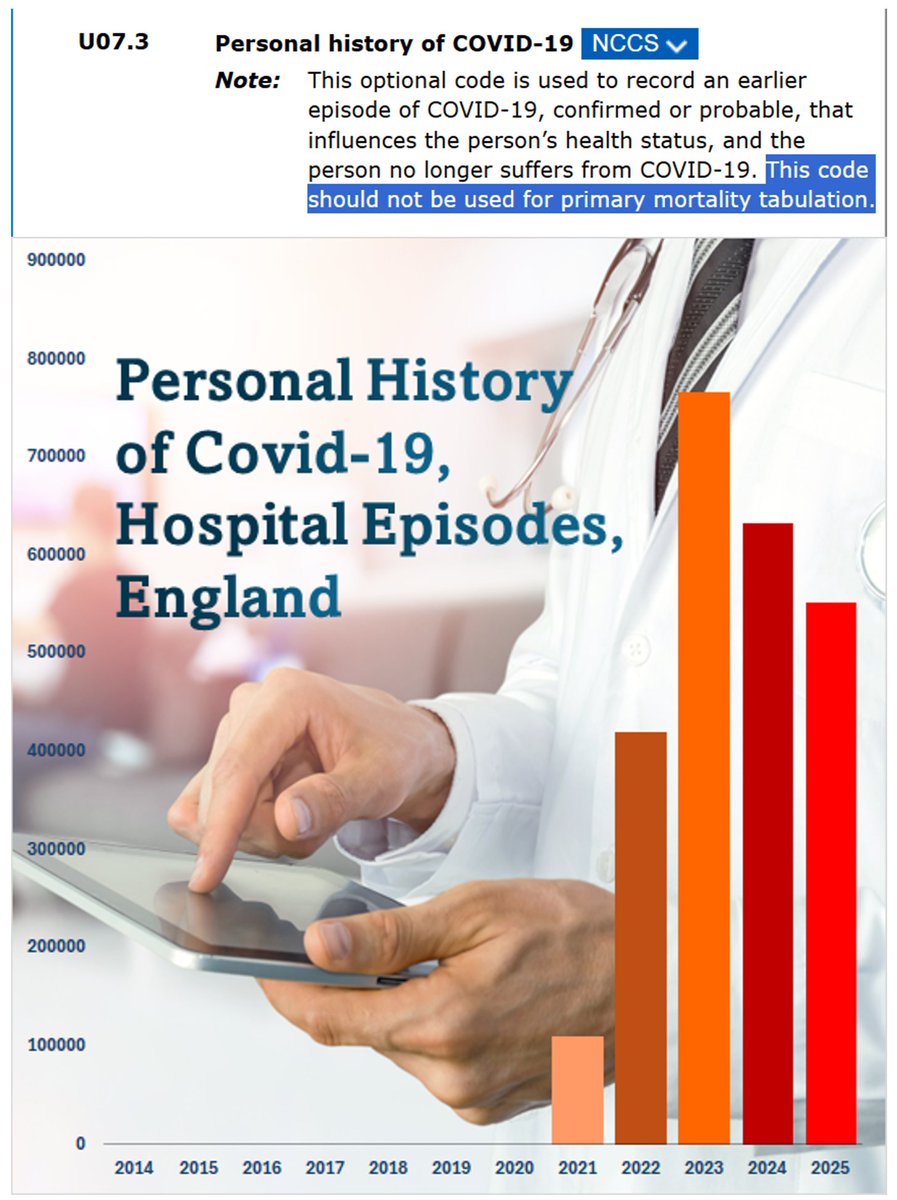
They're supposed to put this code, U07.3, into the databases when a past diagnosis of Covid (confirmed or probable) "influences the person's health status".
And that's what hospitals have been doing.
When the healthcare workers think that the patient's *past covid infections* have influenced the person's *current health status*, they've used the code:
When the healthcare workers think that the patient's *past covid infections* have influenced the person's *current health status*, they've used the code:
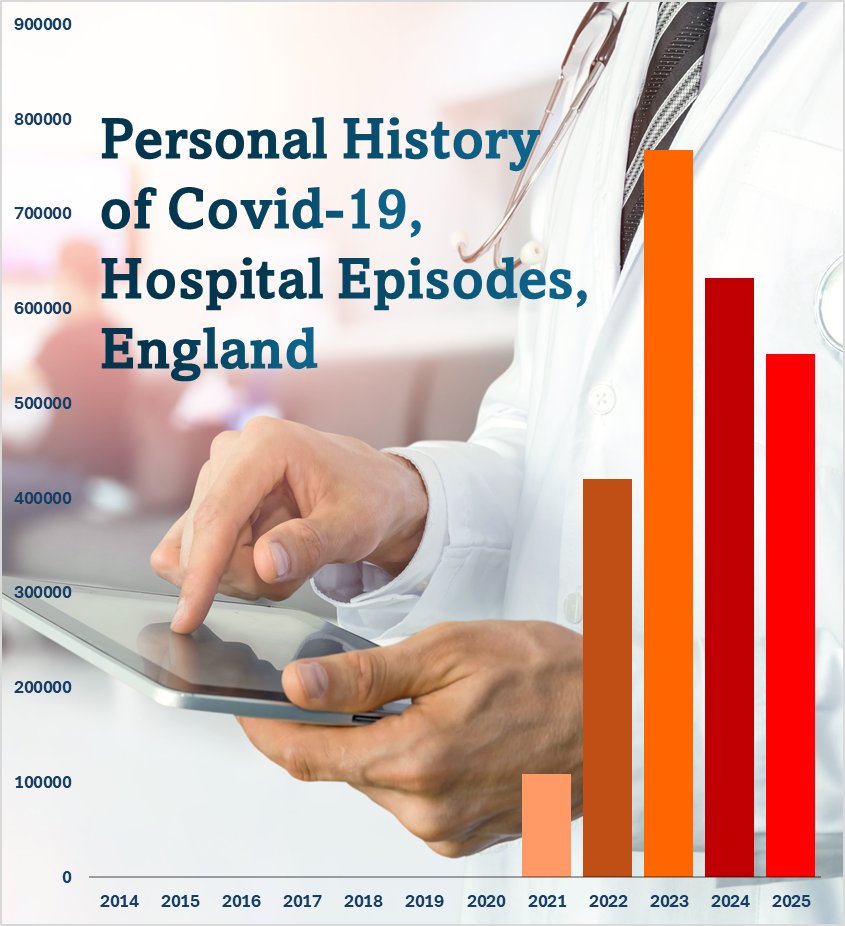
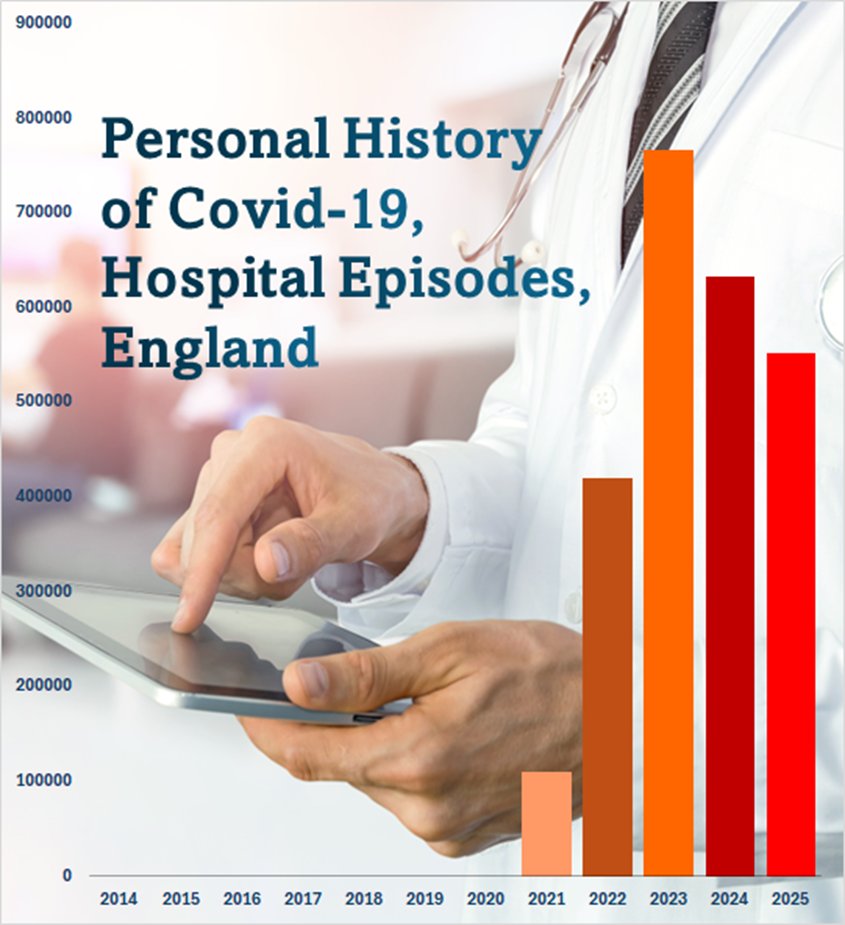
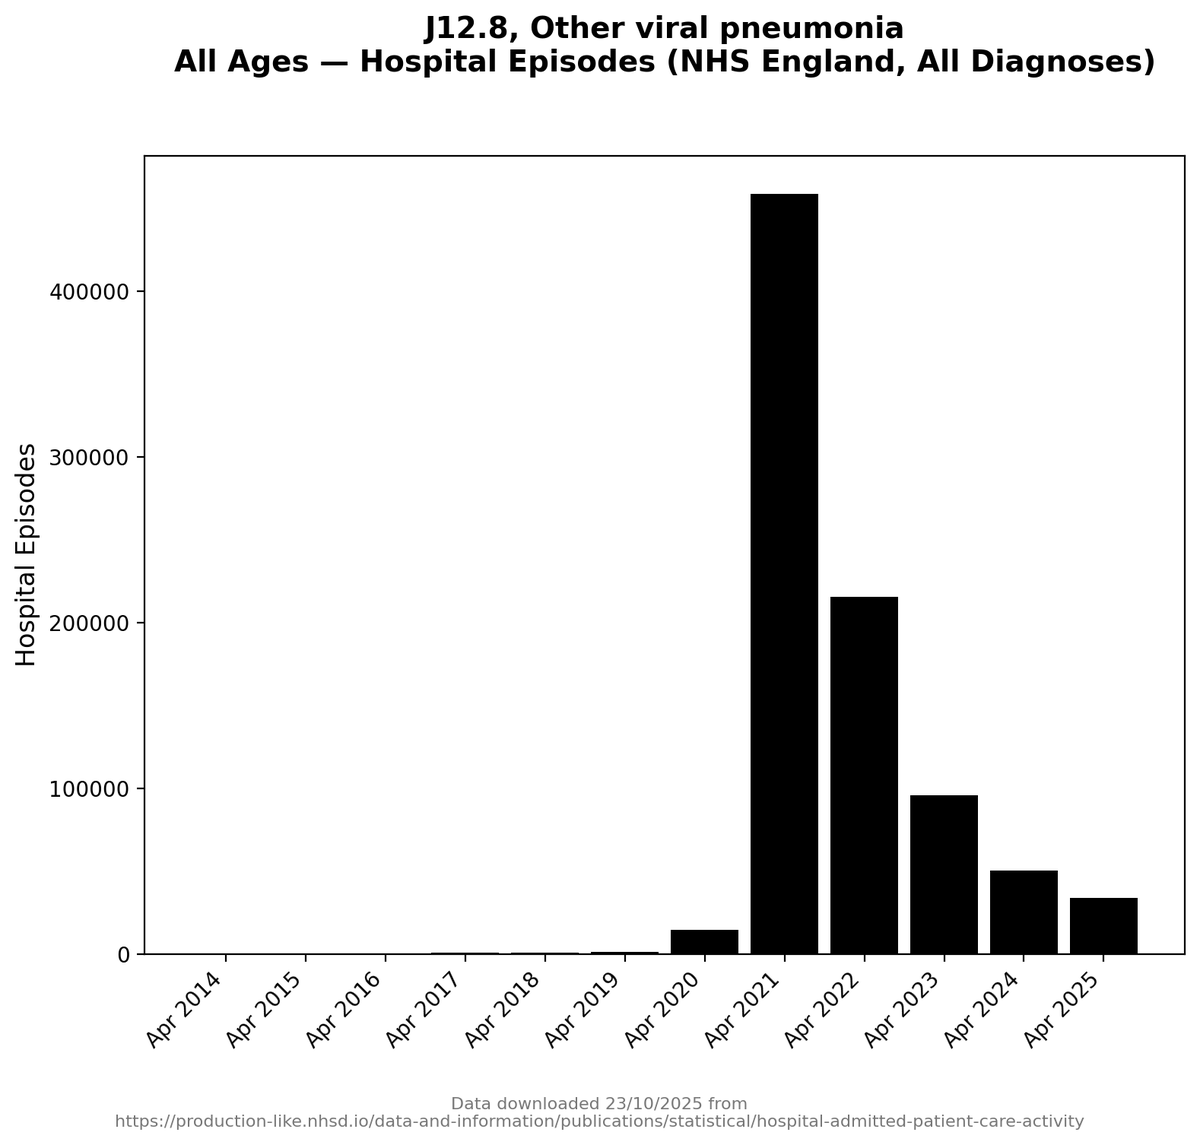
As you can see from the chart, they're still using the code for *massive numbers* of episodes of hospital treatment or consultation each year.
Media and government and public health are telling you that the after-effects of Covid infections are long over. Aren't they?
But the healthcare workers in the hospitals themselves *aren't saying that*.
In fact, the amount of times they are using it has only dropped by about 25% since 2023.
In fact, the amount of times they are using it has only dropped by about 25% since 2023.

And the healthcare workers are using this code even though everything in society is telling them that Covid is over and not important any more.
Imagine being a healthcare worker and seeing a patient, and thinking "covid infections caused this patient's health condition", then including that in the information for the hospital episode database.
You enter the code in, thinking that people somewhere must read that information and make policy based on it.
And you must assume that hardly anyone else is entering that code, because no one in charge is making any fuss about Covid any more.
And you must assume that hardly anyone else is entering that code, because no one in charge is making any fuss about Covid any more.
You don't know that actually there are tens of thousands of other healthcare workers typing in the same data about hundreds of thousands of other patients and the fact that their covid infections have an effect on their current health status.
You don't know that the number of lives this is affecting has barely fallen, because, like I said, there's absolute silence.
I mean all of that is a scandal.
It's bad.
But wait...
It's bad.
But wait...
Let’s get this straight.
There is a specific ICD-10 code for people who are no longer acutely infected but whose previous COVID infection still affects their health today.
There is a specific ICD-10 code for people who are no longer acutely infected but whose previous COVID infection still affects their health today.
Their organs... their immune system... their heart... their blood vessels... their nerves... their brain... their recovery trajectory...
Clinicians are told: use U07.3 if you think it has contributed to the current health status.
Clinicians are told: use U07.3 if you think it has contributed to the current health status.
But if that person later dies…
They must pretend that influence *did not exist*.
🚨
They must pretend that influence *did not exist*.
🚨

Yes, you are seeing that right.
>Use the code for health conditions for the living.
>DO NOT USE IT FOR THE DEAD.
>Use the code for health conditions for the living.
>DO NOT USE IT FOR THE DEAD.

The activity data shows what's *really happening*.
Emergency episodes coded with U07.3 are in the hundreds of thousands per year.
Emergency episodes coded with U07.3 are in the hundreds of thousands per year.
It appears across the entire hospital system:
Coded paired with cardiac admissions, arrhythmias, clots, strokes, lung disease, kidney injury, endocrine crises, infections, neurological events.
Coded paired with cardiac admissions, arrhythmias, clots, strokes, lung disease, kidney injury, endocrine crises, infections, neurological events.
Everywhere you look in the database U07.3 is quietly flagging Covid's ongoing effects.
It is widespread, routine clinical recognition that prior Covid infections continue to shape health.
A tag applied because the previous infection is still causing harm.
And yet the guidance explicitly says: do not count this influence when the patient dies.
A tag applied because the previous infection is still causing harm.
And yet the guidance explicitly says: do not count this influence when the patient dies.
But here's the part that takes this from puzzling to outrageous.
The "personal history of influenza" codes *are* allowed in mortality tabulation.
Flu *is* recognised as codable in the event of death.
The "personal history of influenza" codes *are* allowed in mortality tabulation.
Flu *is* recognised as codable in the event of death.
Flu's lingering effects *are* permitted into the data.
Covid - a virus with known long-term cardiovascular, neurological, and immune consequences - is deliberately excluded.
How.
Just how?
Just how?
If U07.3 were used in mortality coding the way flu history codes are, we would have a completely different understanding of what Covid is doing to population health.
We would see the after-effects.
The delayed consequences.
The deaths precipitated by damage that started months or even years earlier.
The delayed consequences.
The deaths precipitated by damage that started months or even years earlier.
🚨The things clinicians are *already flagging* in hospital datasets.
So the bif question becomes unavoidable:
How many deaths would be attributed to the after-effects of Covid infections if U07.3 were allowed to be counted.
How many deaths would be attributed to the after-effects of Covid infections if U07.3 were allowed to be counted.
How many families told "it wasn’t Covid" would, in fact, be looking at the long shadow of a past infection.
This is not a minor technicality.
This is a massive scandal.
And I am genuinely astonished.
This is a massive scandal.
And I am genuinely astonished.
And a little extra bonus...
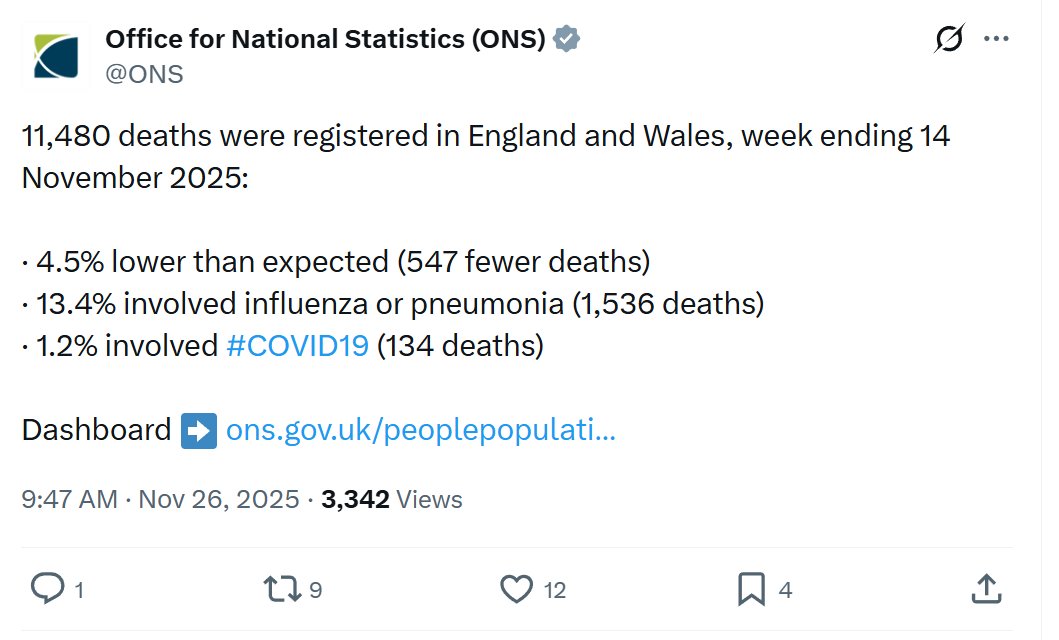
Each week, the Office of National Statistics publish this database that includes causes of death...
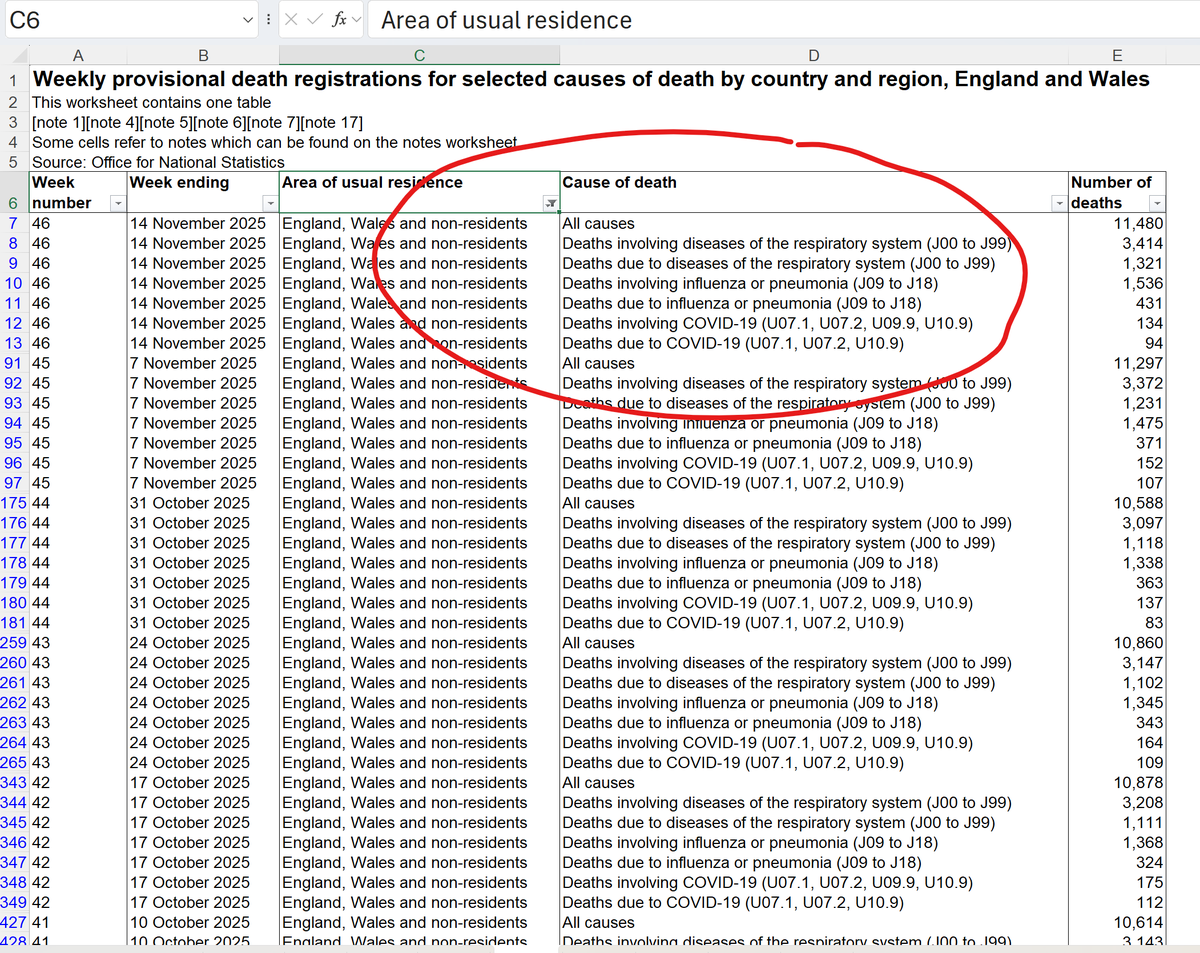
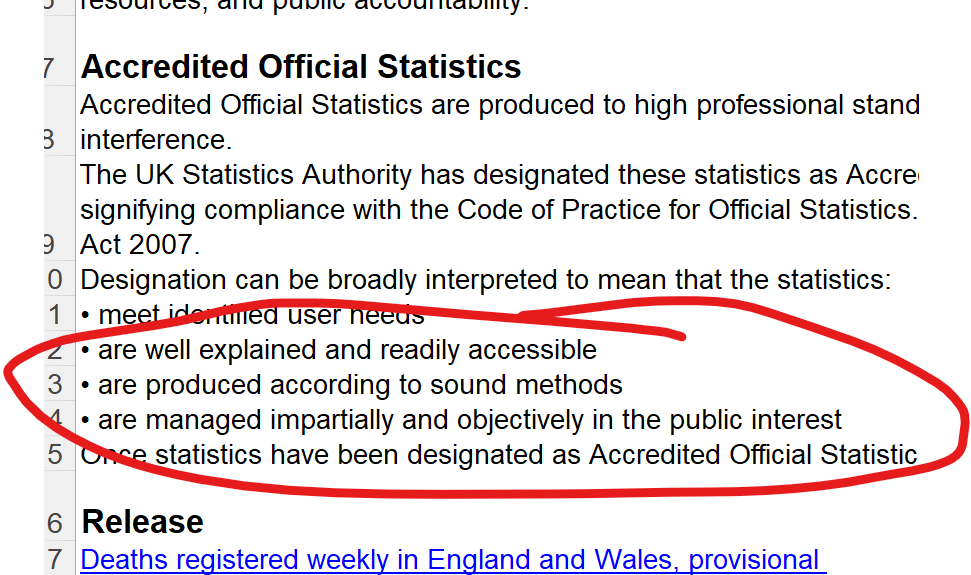
They claim that they are produced using 'sound methods'...
They assign deaths based on the flu and pneumonia codes, and the covid codes... and you can see that U07.2 is there, but not U07.3... but they list all the pneumonia codes...
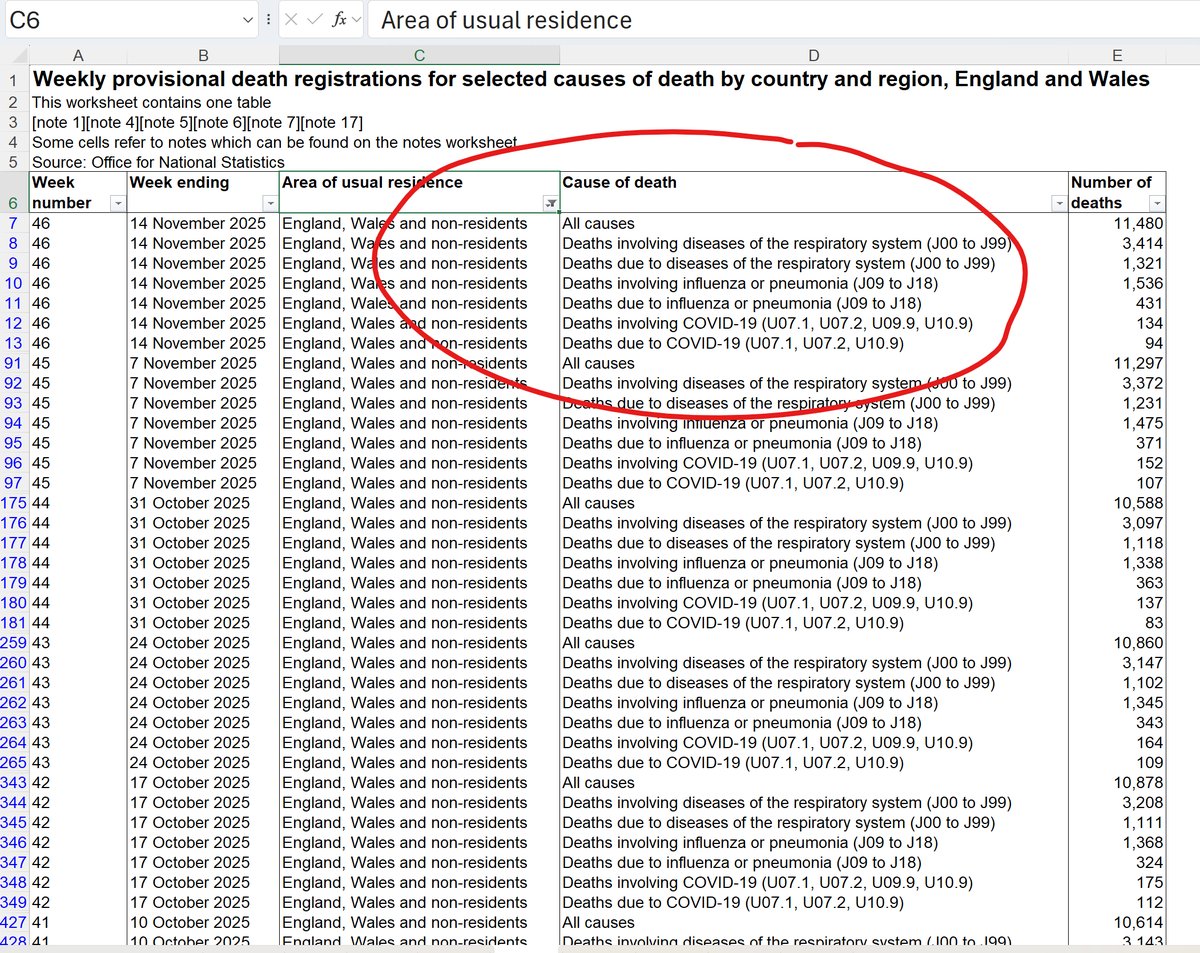
And they include within those Flu and Pneumonia codes, this one.
"J12.8"
Other viral pneumonia.
Clearly Covid related.
"J12.8"
Other viral pneumonia.
Clearly Covid related.
It's right there.
Each week they publish their smug pneumonia v covid statistics while not saying that a number of the pneumonia statistics are explicitly covid caused.
Each week they publish their smug pneumonia v covid statistics while not saying that a number of the pneumonia statistics are explicitly covid caused.
And while explicitly *excluding* the long term effects of covid from the death statistics.

I thought I couldn't be surprised by anything any more.
But these layers of deception are too much for me.
The combination of incompetence and malice is overwhelming.
And what's worse is that hardly anyone will see this thread, and no journalist anywhere will take this up and run with it.
We're a joke of a country ignoring the evidence that is right under our noses.
But I actually have a new respect for the healthcare workers who keep plugging U07.3 into the computer.
Thank you.
You matter.
❤️
Thank you.
You matter.
❤️

Deaths registered weekly in England and Wales, provisional:
ons.gov.uk/peoplepopulati…
ons.gov.uk/peoplepopulati…
NHS ICD codes emergency use instructions:
classbrowser.nhs.uk/ICD-10-5TH-Edi…
classbrowser.nhs.uk/ICD-10-5TH-Edi…
And a footnote:
Yes, I agree with David here.
I think the apparent reduction in numbers is mostly due to clinicians failing to join the dots, reduced testing, and the cultural backdrop that denies covid is a problem.
Yes, I agree with David here.
I think the apparent reduction in numbers is mostly due to clinicians failing to join the dots, reduced testing, and the cultural backdrop that denies covid is a problem.
https://x.com/DavidJoffe64/status/1993754268390789234?s=20
• • •
Missing some Tweet in this thread? You can try to
force a refresh