I have finalized the comprehensive analysis of the vertical AI startup landscape, reviewing data from 143 companies that have collectively raised over $37 Billion in total capital.
The specialization trend is evident, and the capital concentration varies sharply across industries.
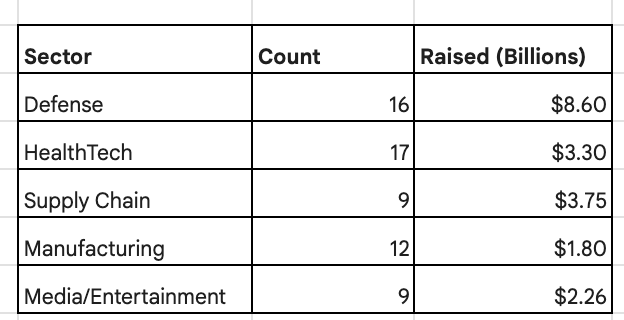
Top 5 by Total Capital Raised:
- Defense: $8.6 Billion
- Supply Chain: $3.7 Billion
- HealthTech: $3.2 Billion
- Software Development: $2.6 Billion
- Media/Entertainment: $2.3 Billion
Top 5 by Company Volume:
- HealthTech: 17 Companies
- Defense: 16 Companies
- Manufacturing: 12 Companies
- Supply Chain: 9 Companies
- Media/Entertainment: 9 Companies
The firms driving this verticalization trend are highly concentrated, confirming where venture capital is placing its largest bets for specialized AI moats.
Here is the full list of the top 10 most active investors across these 143 companies (ranked by unique companies invested in):
- Andreessen Horowitz (a16z): 20 Companies
- General Catalyst: 13
- Tiger Global: 12
- Coatue: 10
- Khosla Ventures: 10
- Sequoia: 9
- Lightspeed: 9
- Insight Partners: 8
- Kleiner Perkins: 8
- Accel: 7
This data confirms a strong shift toward domain-specific AI products built on proprietary data.
The specialization trend is evident, and the capital concentration varies sharply across industries.
Top 5 by Total Capital Raised:
- Defense: $8.6 Billion
- Supply Chain: $3.7 Billion
- HealthTech: $3.2 Billion
- Software Development: $2.6 Billion
- Media/Entertainment: $2.3 Billion
Top 5 by Company Volume:
- HealthTech: 17 Companies
- Defense: 16 Companies
- Manufacturing: 12 Companies
- Supply Chain: 9 Companies
- Media/Entertainment: 9 Companies
The firms driving this verticalization trend are highly concentrated, confirming where venture capital is placing its largest bets for specialized AI moats.
Here is the full list of the top 10 most active investors across these 143 companies (ranked by unique companies invested in):
- Andreessen Horowitz (a16z): 20 Companies
- General Catalyst: 13
- Tiger Global: 12
- Coatue: 10
- Khosla Ventures: 10
- Sequoia: 9
- Lightspeed: 9
- Insight Partners: 8
- Kleiner Perkins: 8
- Accel: 7
This data confirms a strong shift toward domain-specific AI products built on proprietary data.

Link here docs.google.com/spreadsheets/d…
• • •
Missing some Tweet in this thread? You can try to
force a refresh