Trace Cohen Profile picture
GP @ Six Point Ventures pre/seed fund - Vertical Ai US Israel // Exited Founder Operator // Weekly startup tech VC newsletter // ValueAddVC dot com
May 24 7 tweets 5 min read
NYC weekends really do feel rainier... I ran more data and built a full data investigation to see if the pattern is real.

Across 2,192 days (6yrs now!) of weather data, NYC rain rates by day of week look like this:

Mon: 27.8%
Tue: 32.9%
Wed: 31.8%
Thu: 34.5%
Fri: 38.0%
Sat: 35.8%
Sun: 32.3%

Friday is the rainiest day of the week.

You are not imagining it.

The interesting part is the possible chain reaction behind it.

NYC’s PM2.5 air pollution appears to peak midweek, with Wednesday averaging 8.5 µg/m³, roughly 23% higher than Sunday’s 6.9.

Those particles can act as cloud condensation nuclei, which may help clouds form and intensify under the right atmospheric conditions.

With a 2–3 day lag, that points to a plausible pattern:

Midweek pollution buildup → late-week cloud formation → Friday/Saturday rain risk.

But the weather does not start in NYC.

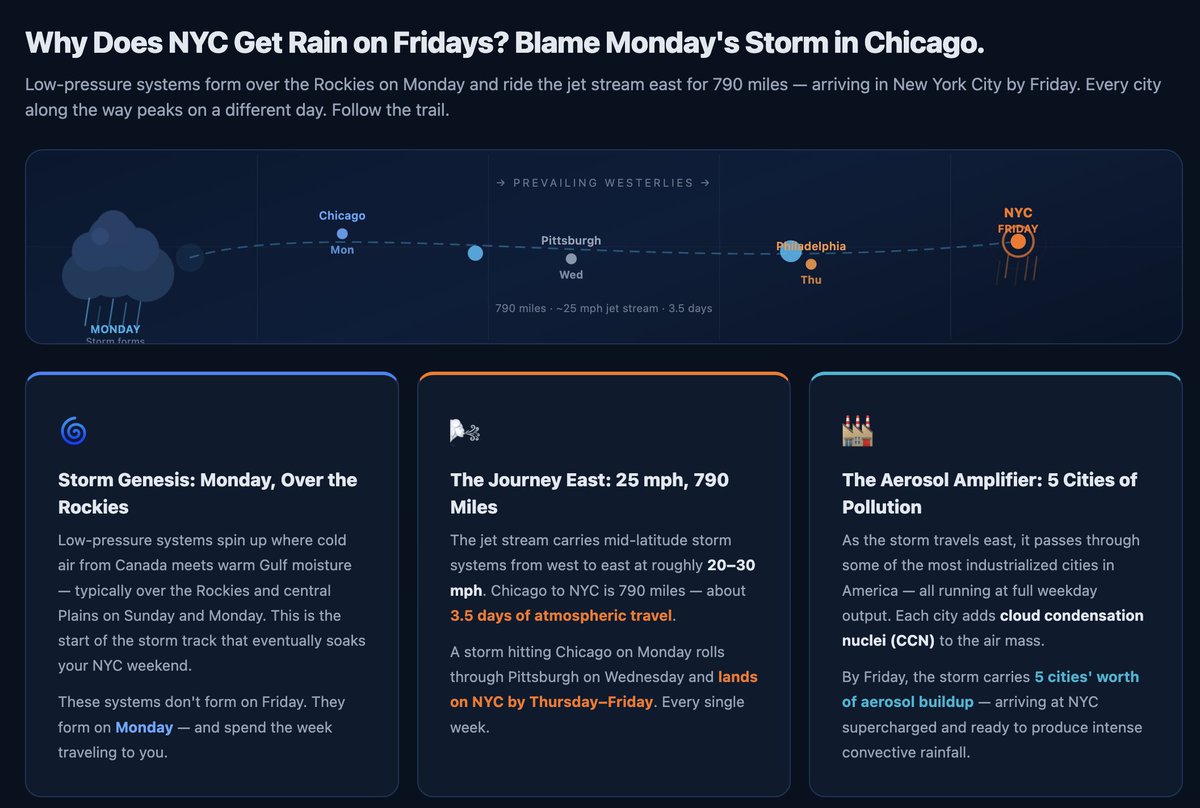
Storm systems often form or organize farther west, then move east with the prevailing flow. In the data, the rain pattern appears to travel city by city:

Chicago: Mon, 33.2%
Pittsburgh: Wed, 34.1%
Philadelphia: Thu, 35.2%
NYC: Fri, 38.0%

The storm track takes roughly 3.5 days to travel about 790 miles.

Which means it can arrive in New York right as the weekend begins.

NYC also is not only dealing with its own emissions. A meaningful share of its PM2.5 can come from upwind sources.

The I-95 corridor, including Philly, Trenton, Newark, and surrounding metro areas, sits directly southwest of NYC, which matters because prevailing winds often move pollution northeast.

In other words, NYC may be the end of the pipeline.

One of the most interesting signals came from COVID.

During lockdowns, the weekly pollution rhythm weakened sharply as traffic collapsed. With far fewer vehicle crossings and less commuter activity, the normal 7-day aerosol cycle became much less pronounced.

When traffic came back, the pattern returned.

That does not prove tailpipes alone are making it rain every weekend. Weather is complicated. But the data suggests a real and testable relationship between traffic, pollution, atmospheric particles, storm timing, and late-week rainfall.

The thesis:

Our weekly human activity cycle may be helping shape NYC’s weekly rain cycle.

Full interactive dashboard with 2,192 days of data, animated storm tracks, and live charts:

valueaddvc.com/ny-rain-dataImage The Storm Highway: Weather Travels from West to East
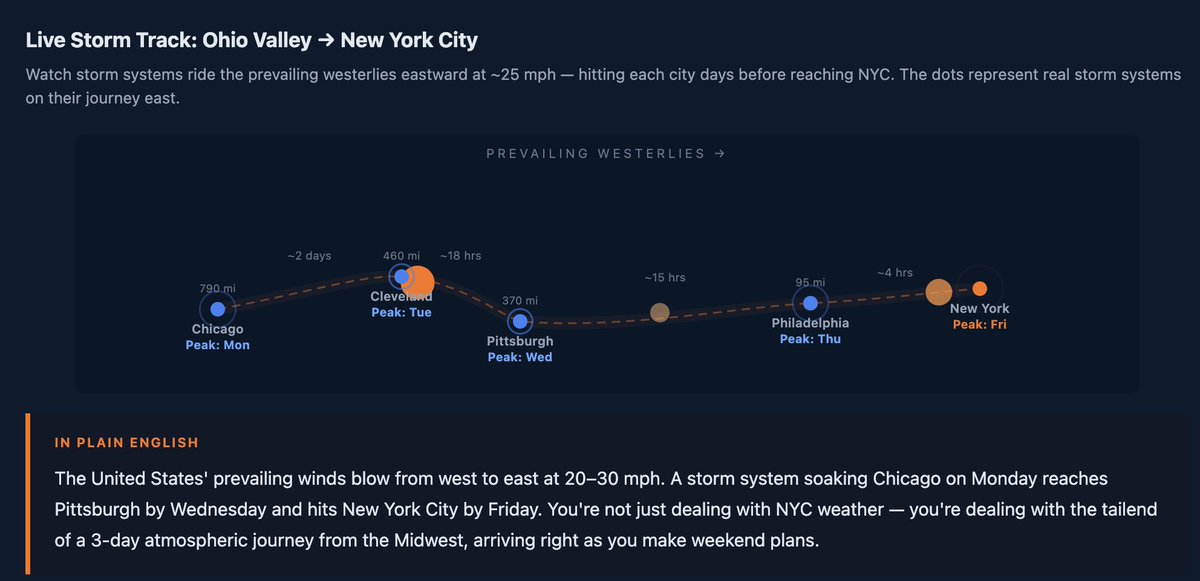
Storms born over the Ohio Valley on Monday ride the westerlies and arrive in New York by Friday — right on time to ruin your weekend.

valueaddvc.com/ny-rain-dataImage
May 28, 2024 5 tweets 2 min read
🧵Wow the @FTC did the most comprehensive BIG TECH acq overview I've ever seen...

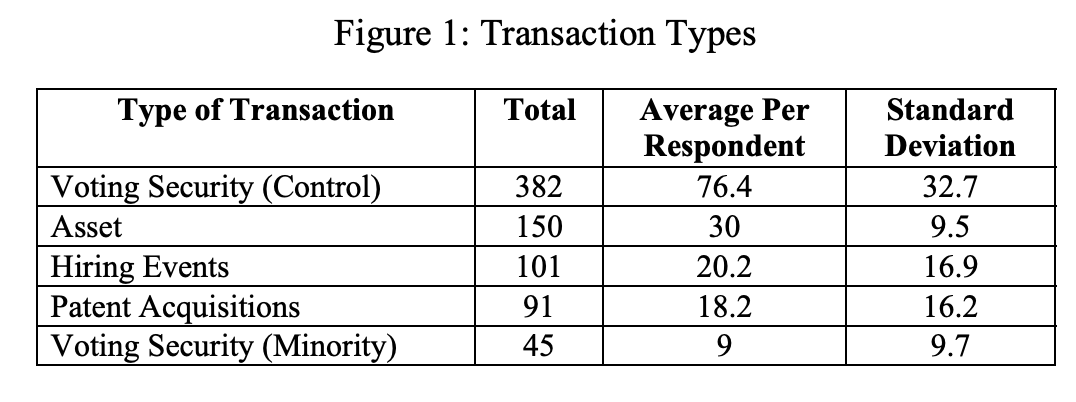
Non-HSR Reported Acquisitions by Select Technology Platforms, 2010–2019: An FTC Study

ftc.gov/system/files/d… As part of its review, staff collected information from the respondents on several key data points requested in the Special Order Image