XFG.1.1 is emerging as a new contender. It is characterised by a reversion to Spike W452R, which captured the attention of the Variant Hunters.
XFG.1.1 finished at 4%.
🧵
Mutations at position 452 have swung from near-zero to near-100% in a multiple-pendulum pattern, across the span of the pandemic. SL452W has been dominant since JN.1 emerged, the longest period of stability.
🧵
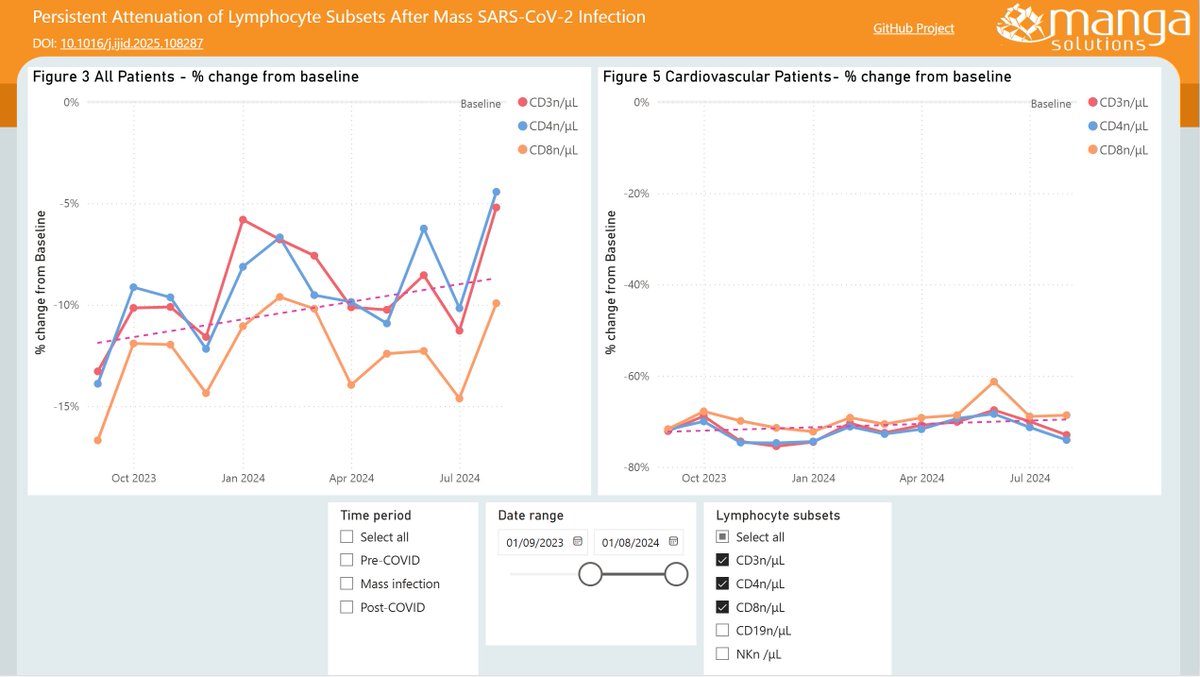
The previous variants with S:W452R (Delta & BA.5) were generally more severe in their impact on individuals.
🧵
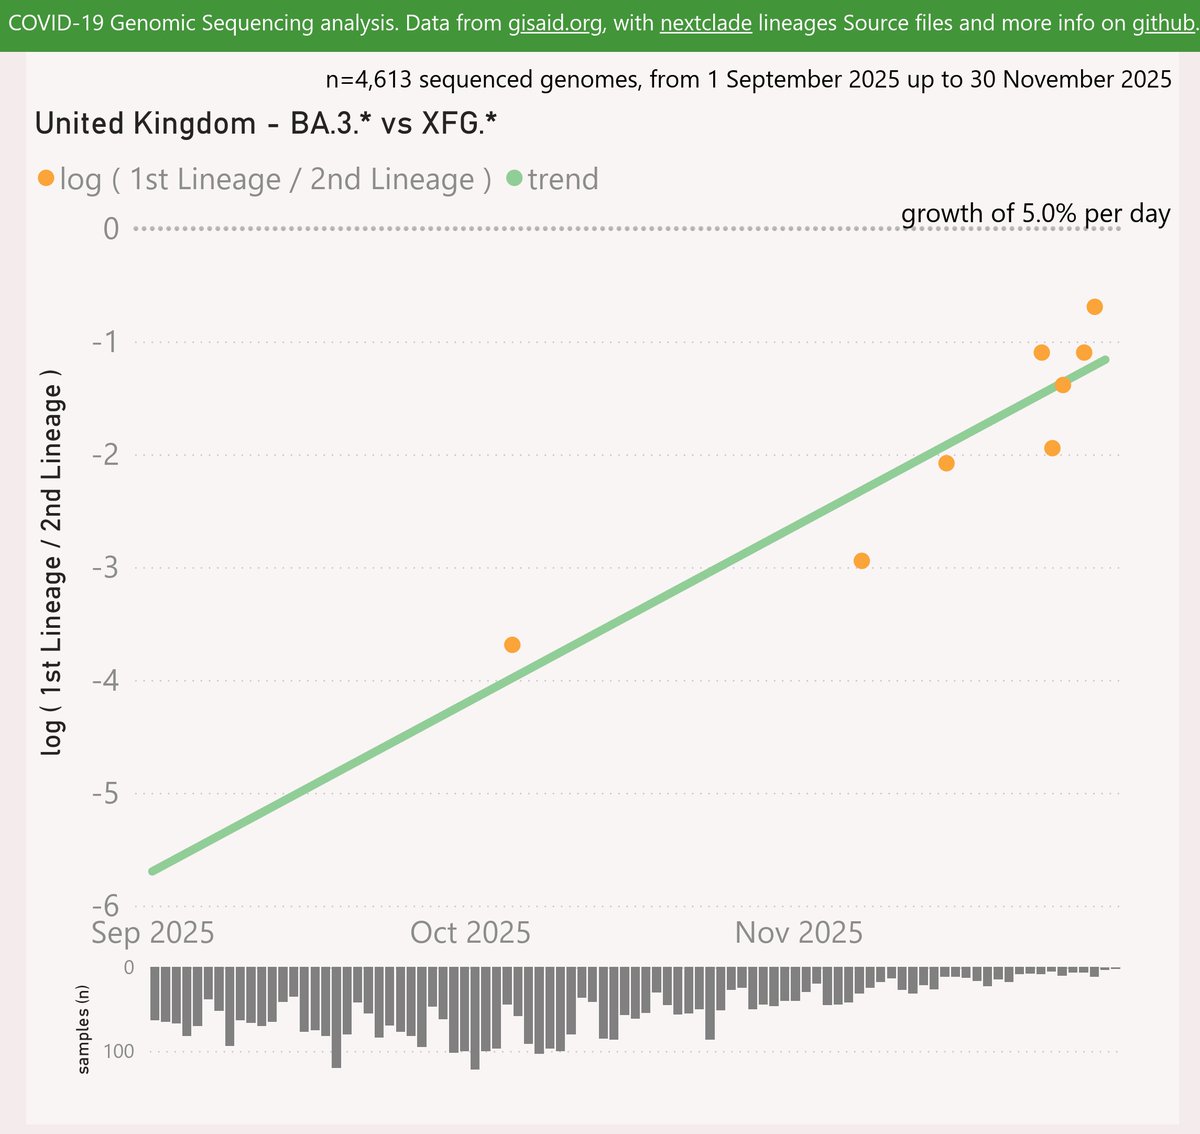
For the US, XFG.1.1 is showing a slowing advantage of 2.9% per day (20% per week) over other XFG.* "Stratus" lineages. At that pace, any crossover might be in the New Year.
🧵
Here are the leading US states reporting XFG.1.1.
Oregon has reported the highest frequency at 19%, while California reached 11% and Minnesota hit 10%.
🧵
It became clear during November that a unusual second wave is underway in Australia, driven by the new "clade K" (H3N2 clade 2a.3a.1, subclade K).
Tasmania, New South Wales and South Australia are currently the hardest-hit.
#Influenza #Australia
🧵
Western Australia had been spared the worst of this second wave until the last week or so. But now there’s a signal of a sharp change in case momentum there also.
🧵
The latest Australian Respiratory Surveillance Report confirms my earlier speculation that the new "clade K" (H3N2 clade 2a.3a.1, subclade K) is driving the "unusual" second wave of influenza in Australia.
Here's the latest variant picture with a global scope, to mid-November.
BA.3.2.* has continued to show signs of growth. Recent samples have been reported from South Africa, Australia, across Europe, and a traveller entering the US from Kenya.
I’ve used WA Health’s COVID-19 wastewater surveillance page to estimate the number of infections of BA.3.2.
I estimate ~400 BA.3.2.* infections in Perth for the latest week, and ~4,600 over the 9 weeks since BA.3.2.* was first detected.
#BA_3_2 #Australia #WA #Perth
🧵
WA Health revamped their dashboard using Power BI, so it is more interactive now and a bit easier to get precise values. However they paused the wastewater variant analysis for 3 weeks, so I’ve estimated the values in that gap.
With the NB.1.8.1.* "Nimbus" and XFG.* "Stratus" variants carving up dominance around the globe, it is time to ponder which variant might drive the next wave.
The leading contenders at this point are PY.1.1.1 and XFV.
#COVID19 #SARSCoV2 #PY_1_1_1 #XFV #XFZ
🧵
Both are at low frequencies globally, but are already remarkably widespread geographically. New entrant XGA might be flattered by the low recent sample volumes.
I added some other contenders for monitoring, although they are less significant: XEC.27.2(.1), XFW, XFY and XFZ.
🧵
PY.1.1.1 is presumed to have originated from India, rising sharply to 11% frequency there in by early July. It has also shown signs of growth in several other countries, notably rising to 3% in Canada.
🧵
If you match the current level of the navy blue line to the cases/100K scale on the left, it looks like ~2.5K cases per 100K population (from all variants).
Perth's population is 2.3M, so that scales up to ~58K cases.
🧵
But early-2023 testing levels were far from perfect. I'll multiply by 3 to get an estimate of ~170K infections. That's surely very conservative.
15% of 170K gives an estimate of ~25K infections with BA.3.2, in Perth that week.
🧵