Here's an animated map showing the spread of the BA.3.2.* variant, nicknamed "Cicada".
The other main hotspots have been South Africa, Western Australia (since July) and Germany (from mid-October).
Locations are approximate - typically country and state/province.
🧵
The other main hotspots have been South Africa, Western Australia (since July) and Germany (from mid-October).
Locations are approximate - typically country and state/province.
🧵
Audio credit:
Crickets Cicada Catbirds Ephemeral Wetland by KevinSonger -- -- License: Attribution 4.0
🧵freesound.org/s/687109/
Crickets Cicada Catbirds Ephemeral Wetland by KevinSonger -- -- License: Attribution 4.0
🧵freesound.org/s/687109/
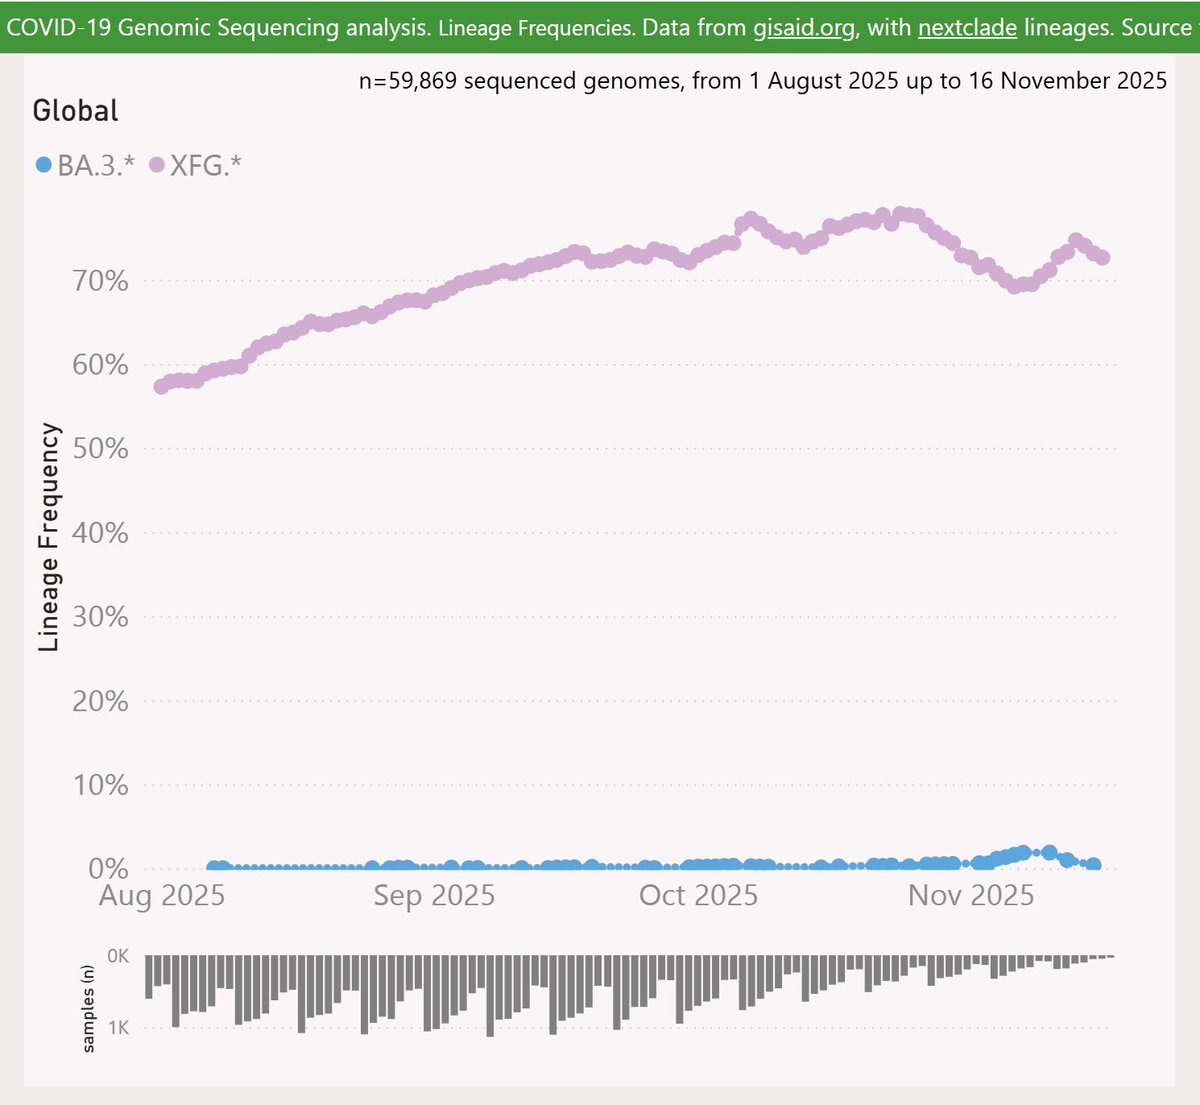
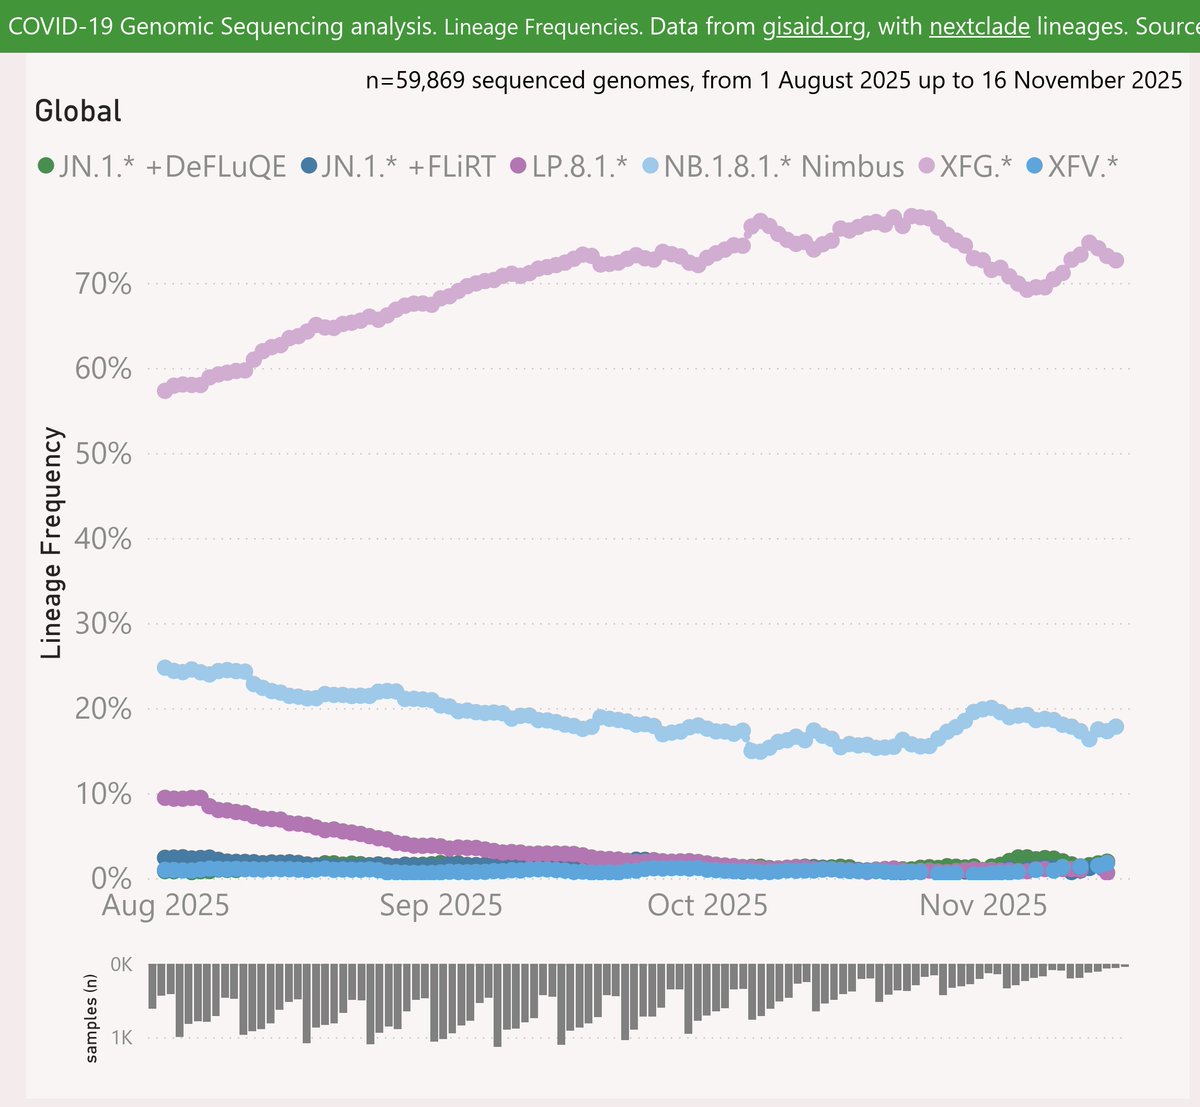
Here's the latest variant picture with a global scope, to mid-November.
BA.3.2.* has continued to show signs of growth. Recent samples have been reported from South Africa, Australia, across Europe, and a traveller entering the US from Kenya.
#COVID19 #Global #BA_3_2
🧵
BA.3.2.* has continued to show signs of growth. Recent samples have been reported from South Africa, Australia, across Europe, and a traveller entering the US from Kenya.
#COVID19 #Global #BA_3_2
🧵
Here are the sub-lineages of BA.3.2.*. The new RE.1.1 and RE.2.2 sub-lineages are driving the recent growth, rising to 2.1% frequency.
The Variant Hunters expect that these will likely be superseded by further child lineages with added mutations, to boost transmission.
🧵
The Variant Hunters expect that these will likely be superseded by further child lineages with added mutations, to boost transmission.
🧵

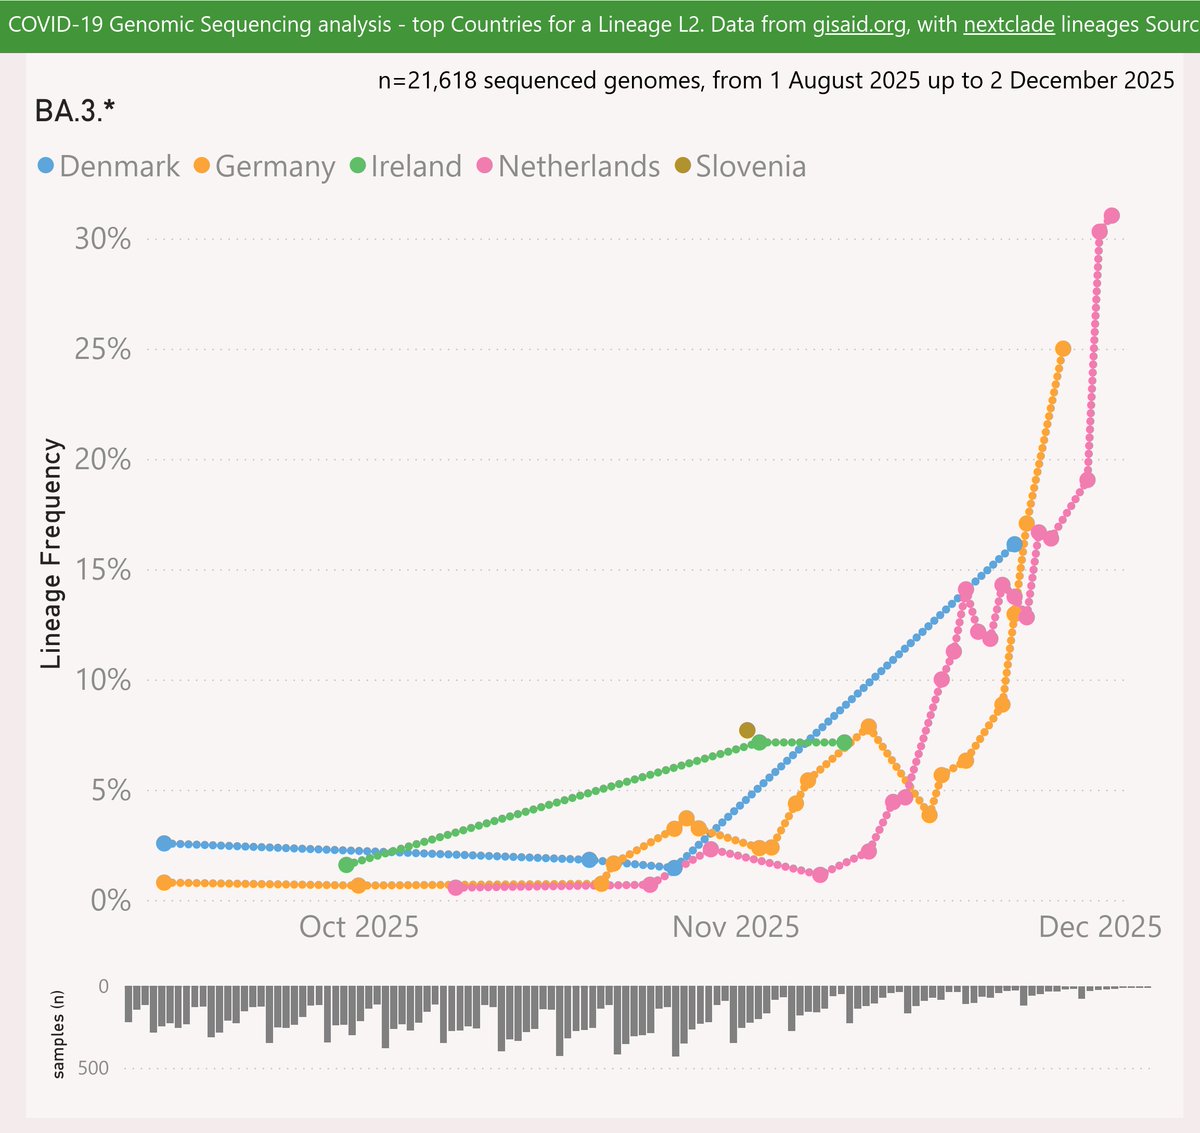
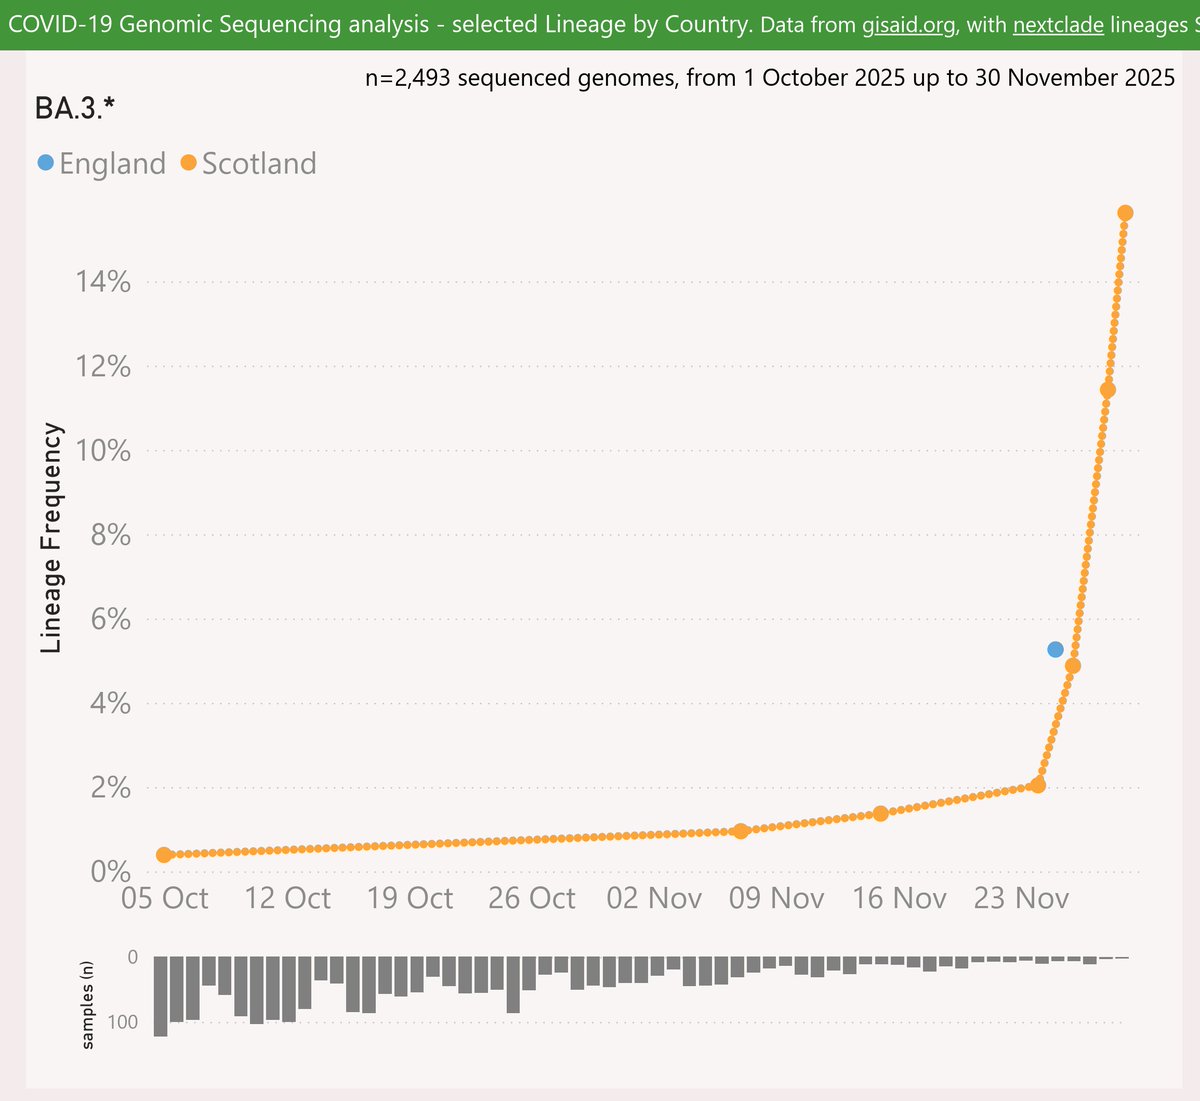
Here are the leading countries reporting BA.3.2.*.
Further samples were shared from Australia (13%), Germany (10%), Ireland (7%) and the UK (1%). Multiple chains of local transmission are underway.
🧵
Further samples were shared from Australia (13%), Germany (10%), Ireland (7%) and the UK (1%). Multiple chains of local transmission are underway.
🧵

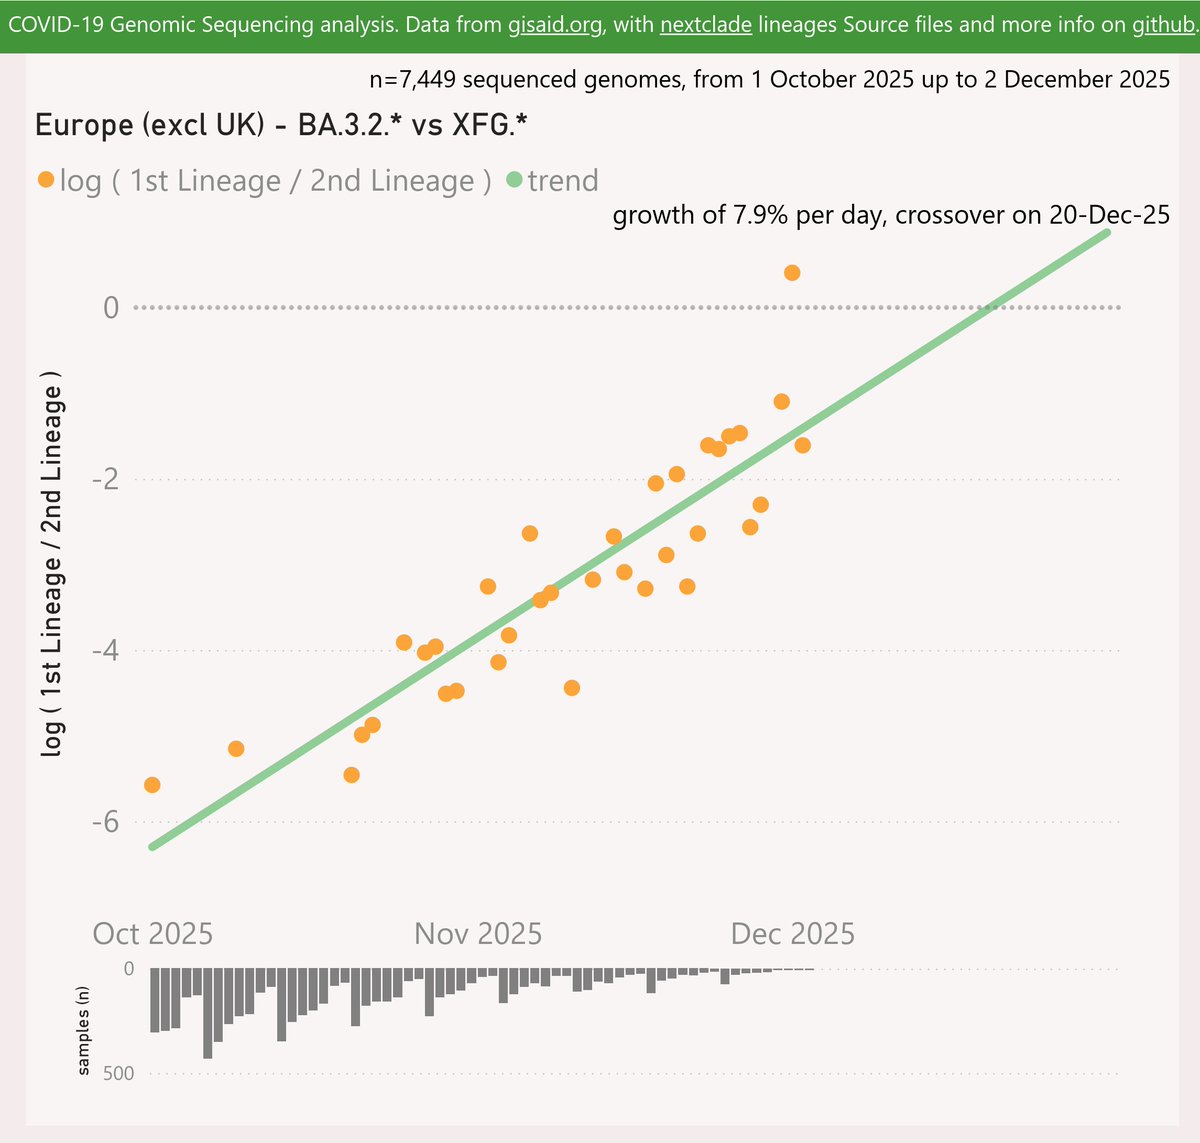
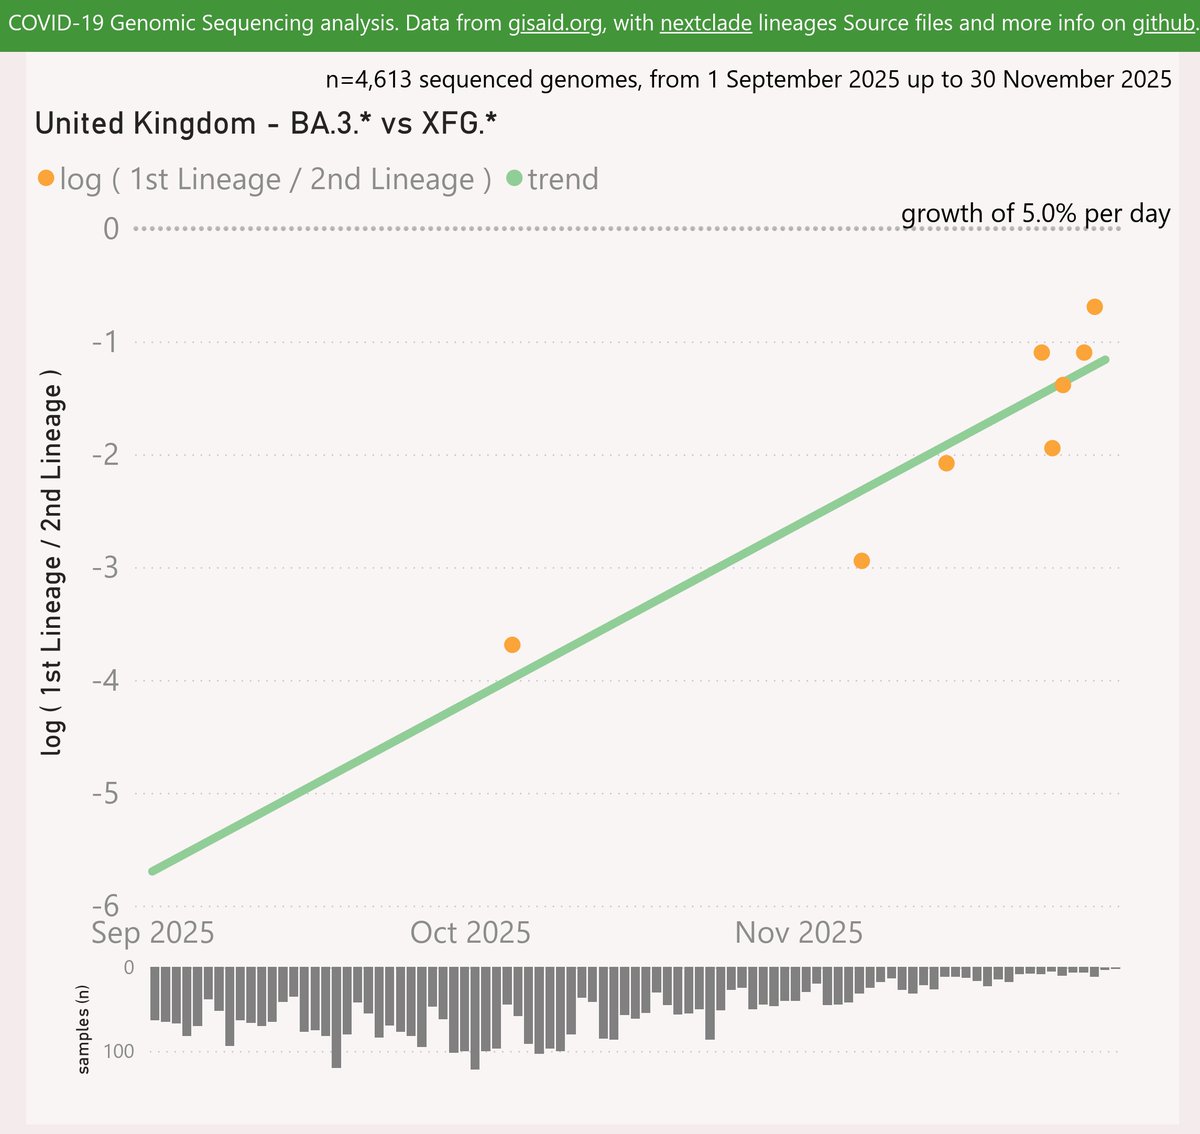
Globally, BA.3.2.* showed a slightly slowing growth advantage of 3.5% per day (25% per week) over XFG.* "Stratus". Any crossover looks a couple of months away at that pace.
🧵
🧵

New child lineage XFG.1.1.1 is emerging as another contender. The parent XFG.1.1 was characterised by a reversion to Spike W452R, which captured the attention of the Variant Hunters.
XFG.1.1.1 has grown to 2% in the US, and reached 5% in France.
🧵
XFG.1.1.1 has grown to 2% in the US, and reached 5% in France.
🧵

Globally, XFG.1.1.1 is showing a very strong growth advantage of 3.5% per day (25% per week) over other XFG.* "Stratus". Any crossover looks a couple of months away at that pace.
🧵
🧵

As usual, I will go into more depth for the countries and regions that have shared enough recent data for a coherent analysis, on separate threads over the next day or so.
Report link:
🧵 endsmike-honey.github.io/covid-19-genom…
Report link:
🧵 endsmike-honey.github.io/covid-19-genom…
PS: here’s a thread from @TRyanGregory for more context on BA.3.2.* Cicada
https://x.com/TRyanGregory/status/1996949831227486407?s=20
• • •
Missing some Tweet in this thread? You can try to
force a refresh