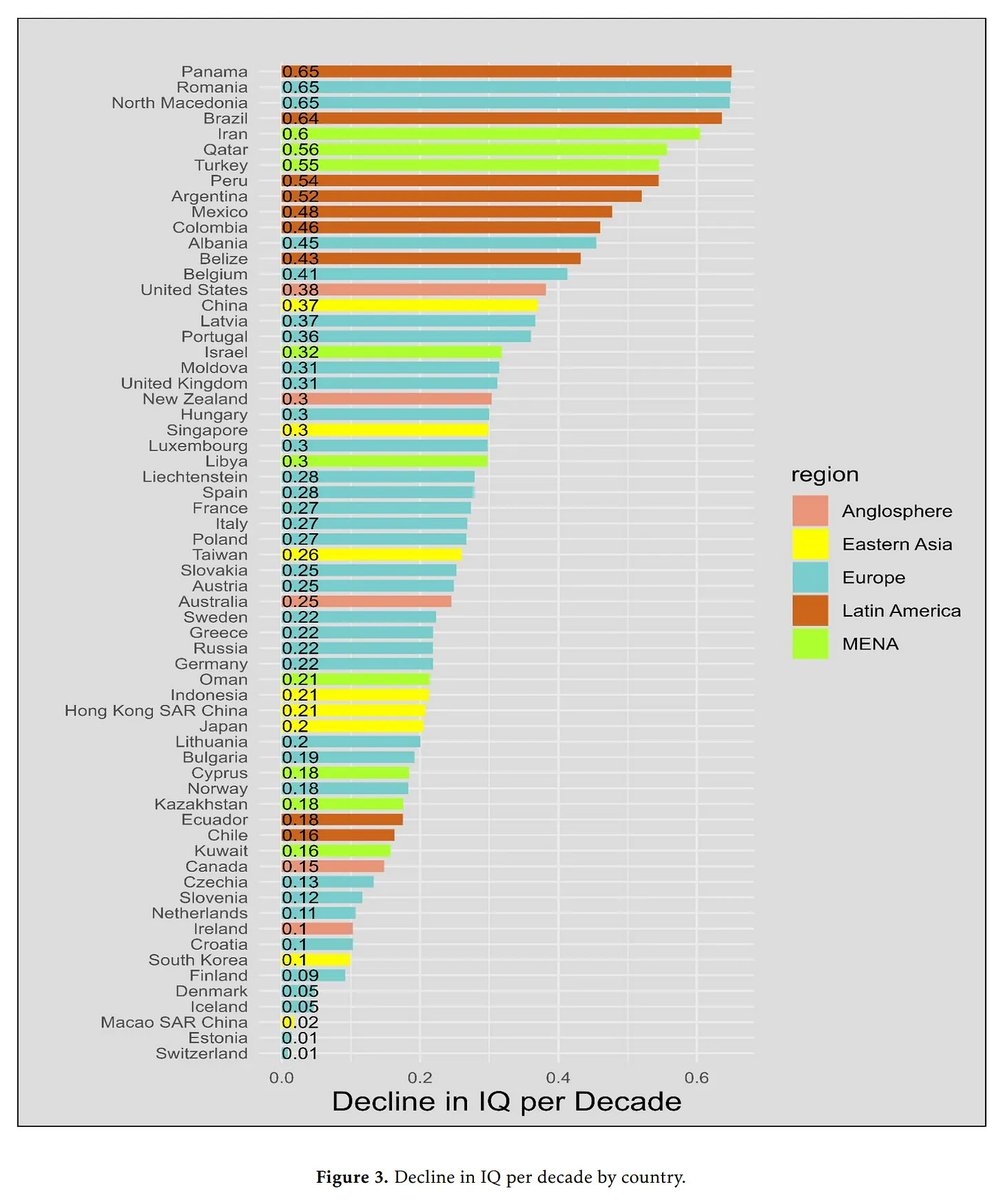
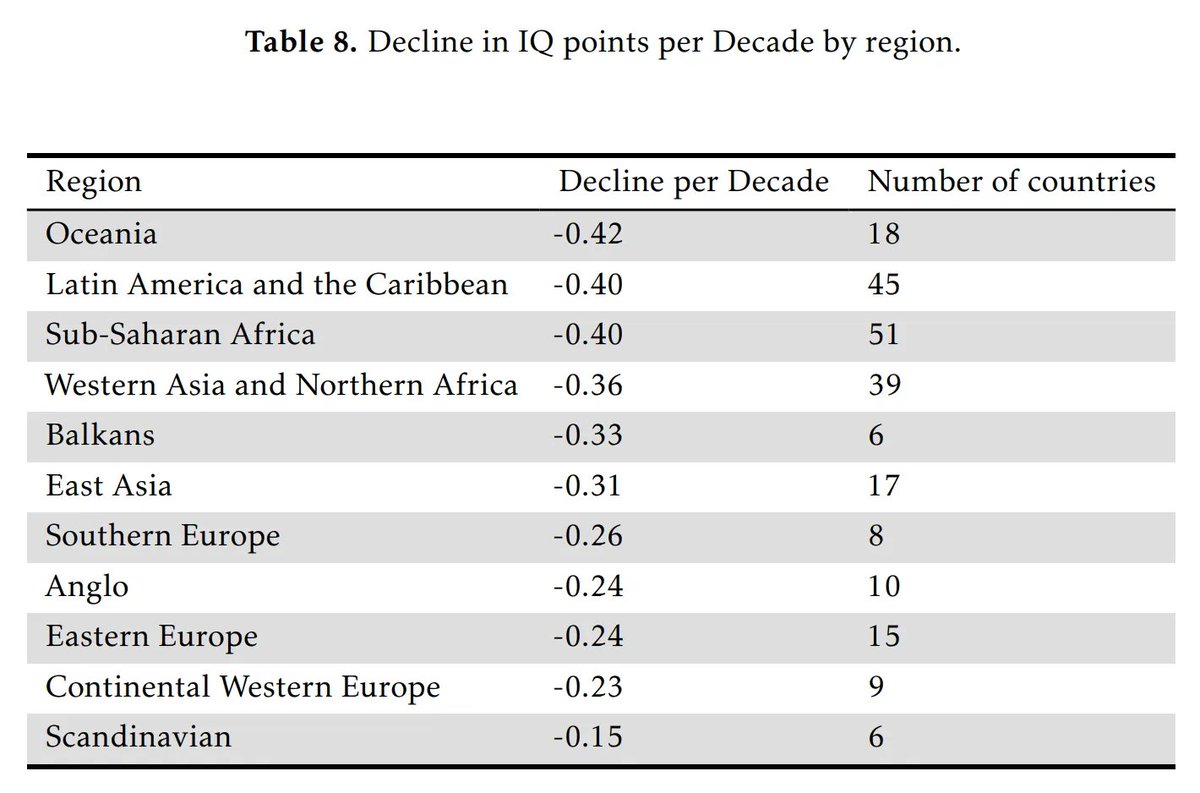
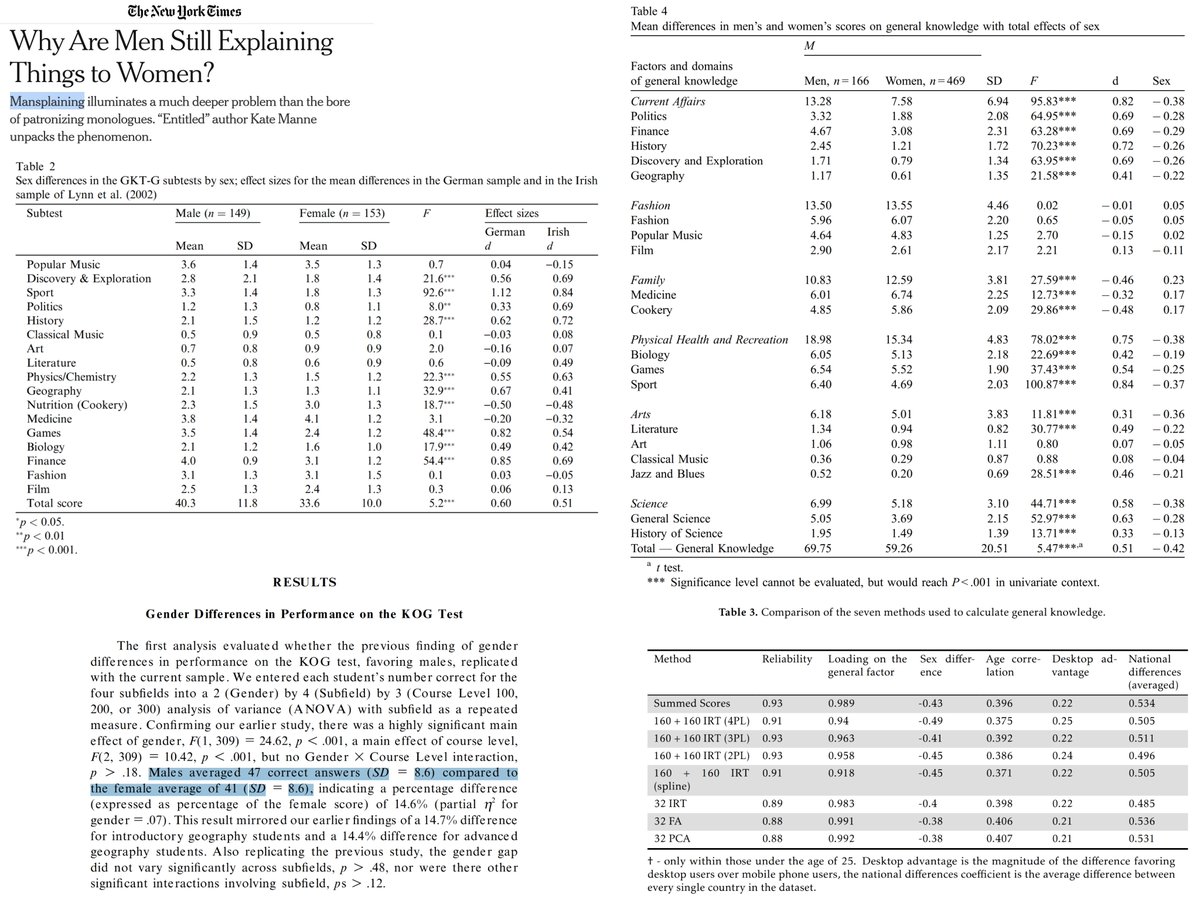
Happy to release our newest and largest admixture project. 🧵 Thread with the main findings. 
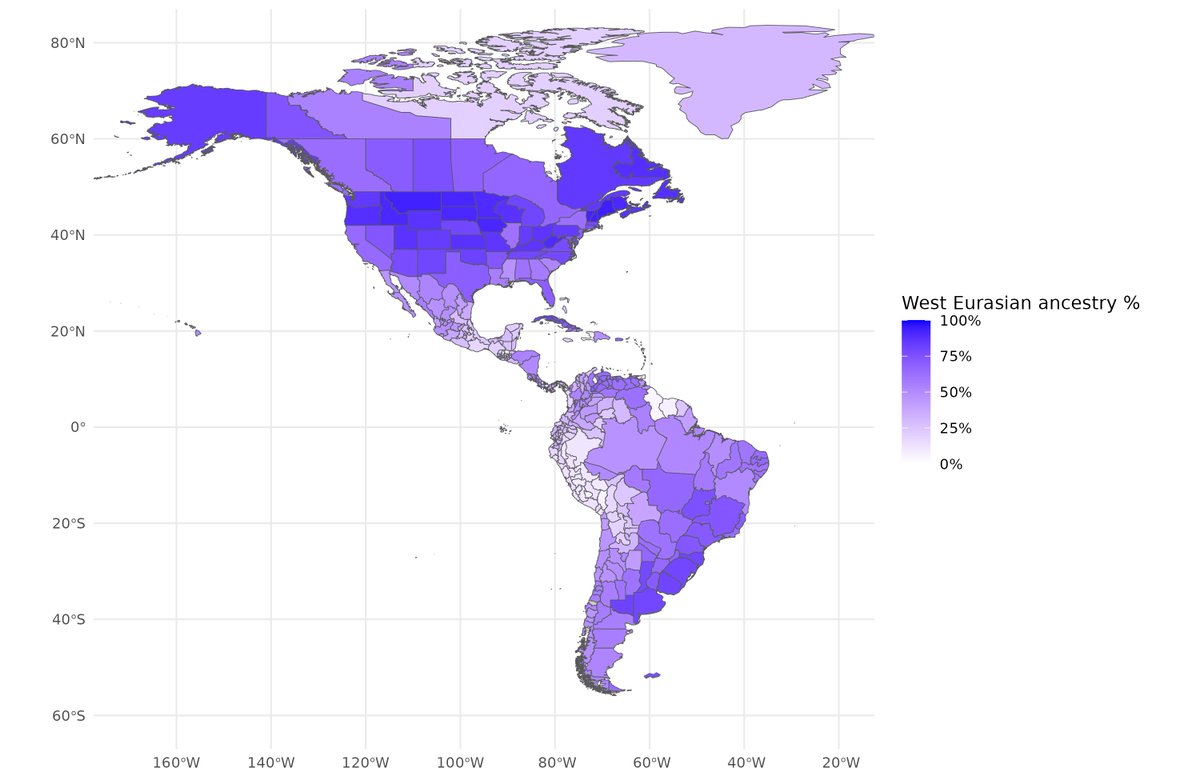
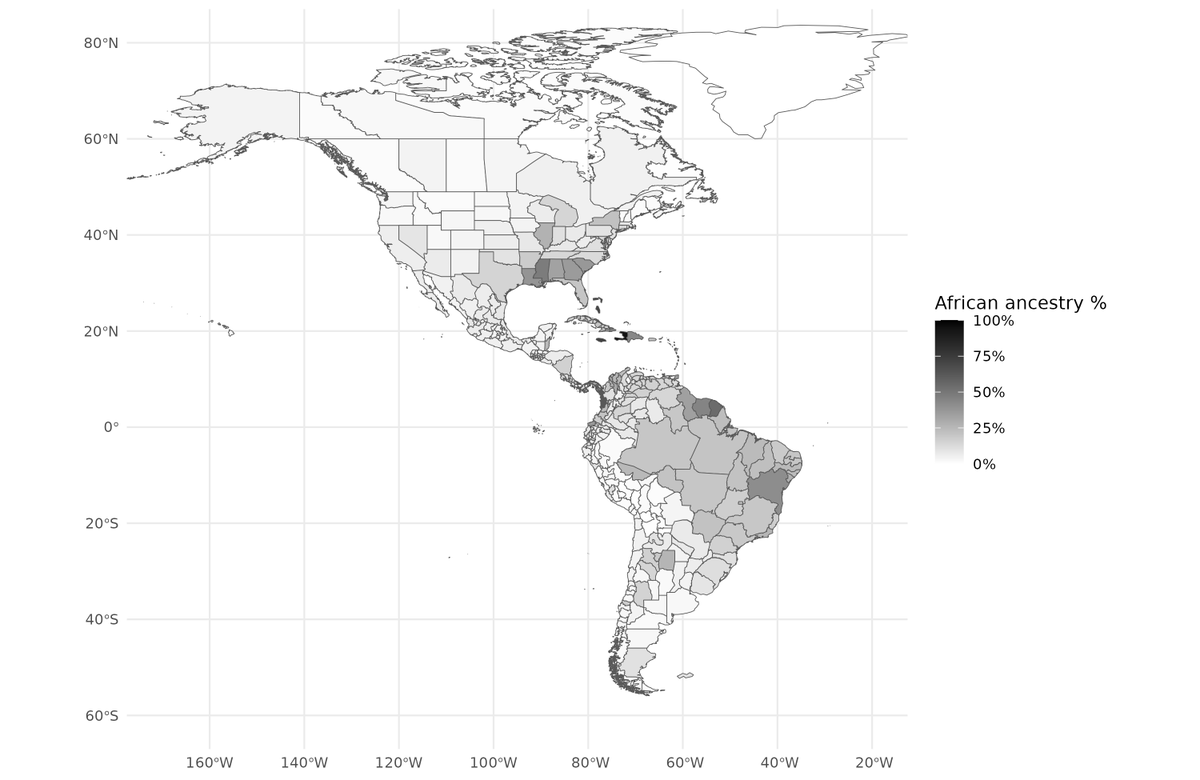
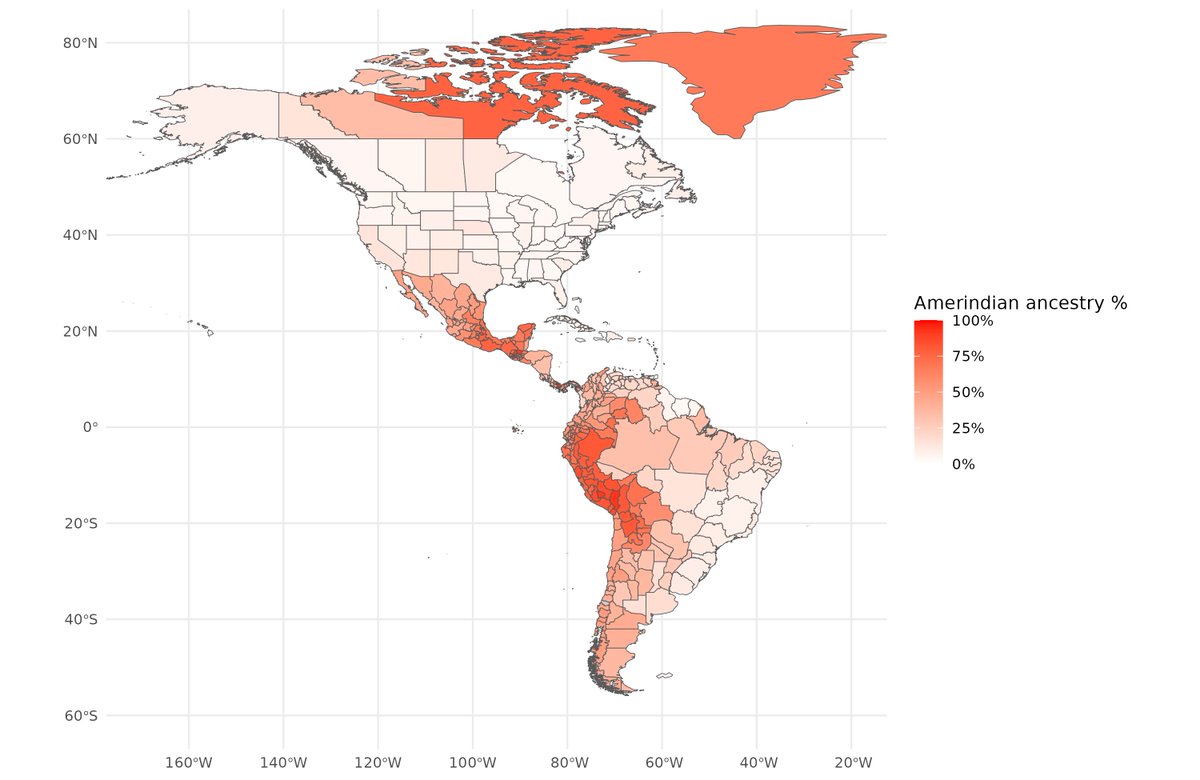
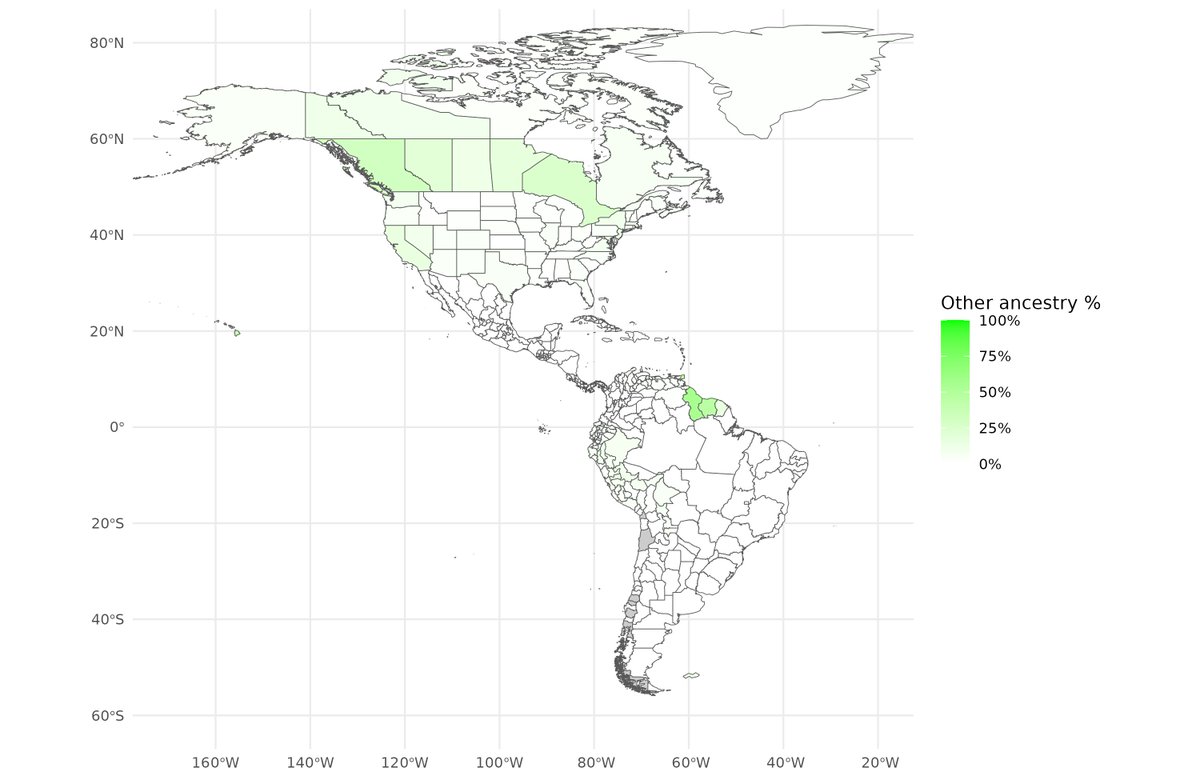
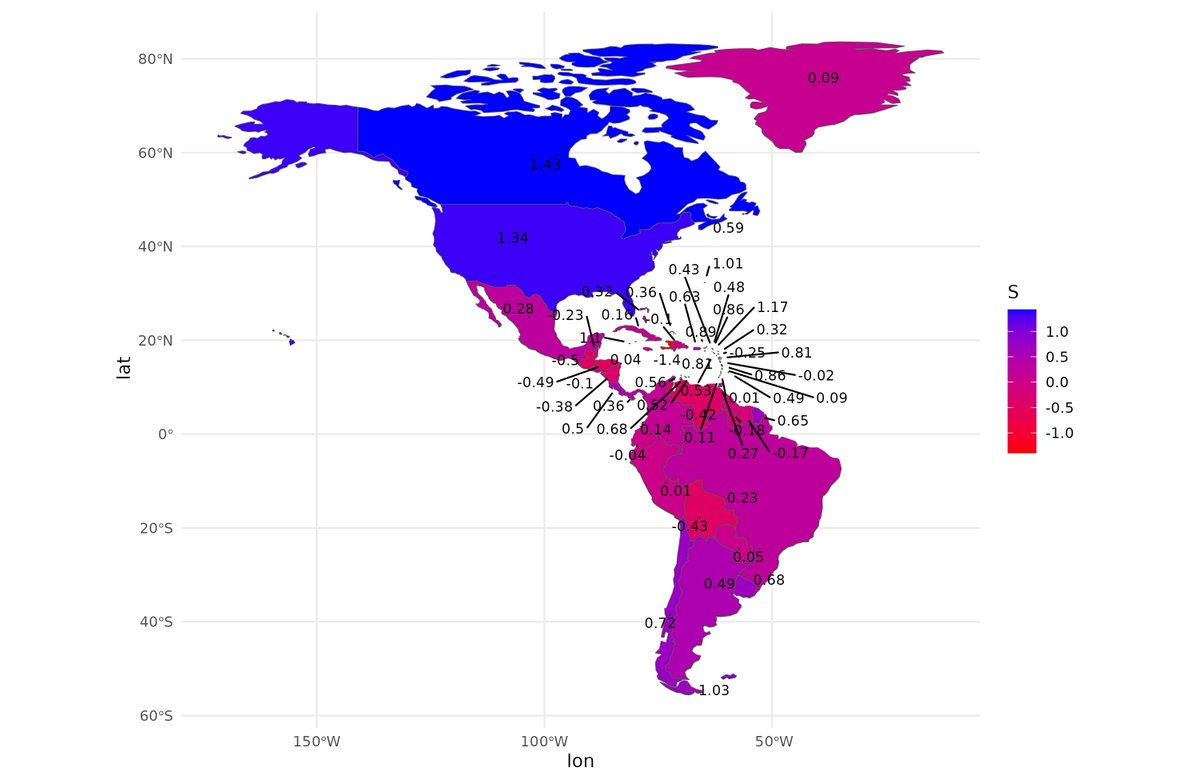
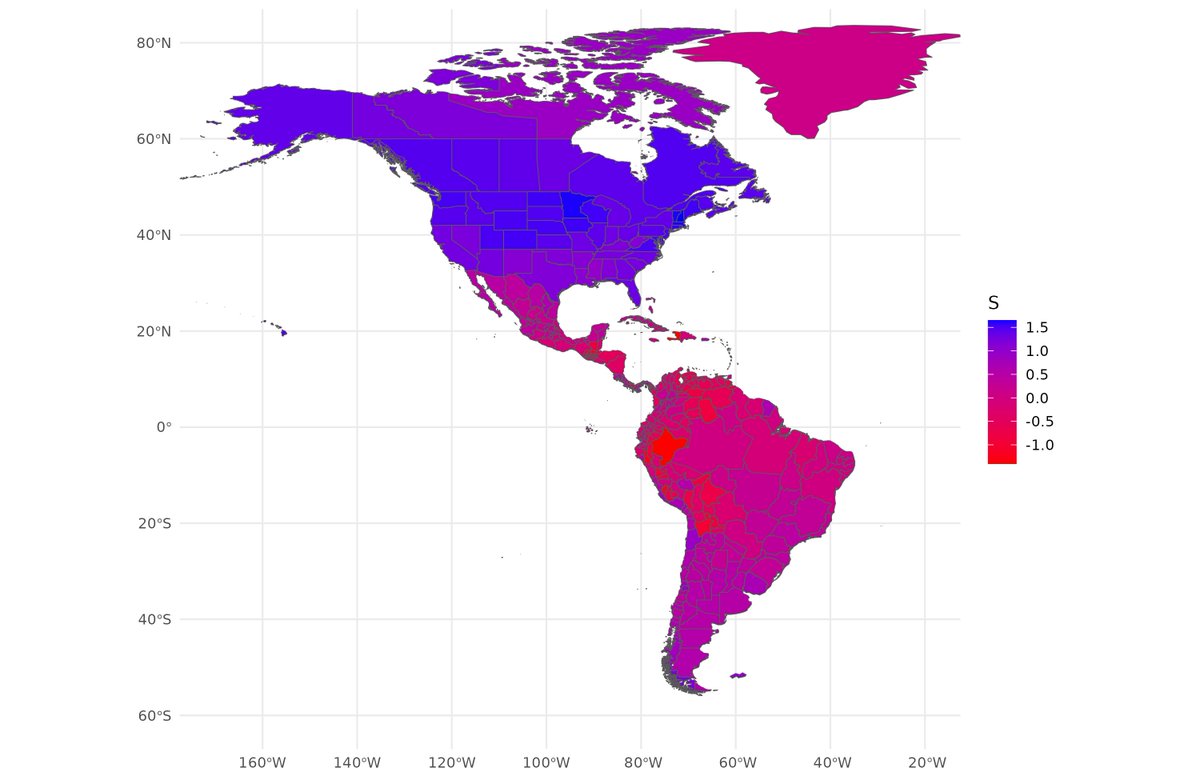
First, we compiled data from 100s of sources to estimate genetic ancestry for over 400 units in the Americas. These are countries and subnational divisions of the larger countries, such as US states, Canadian provinces, various Caribbean islands. Results can be seen in these 4 maps.
It was a real pain in the ass to merge the spatial data to produce the maps!
It was a real pain in the ass to merge the spatial data to produce the maps!
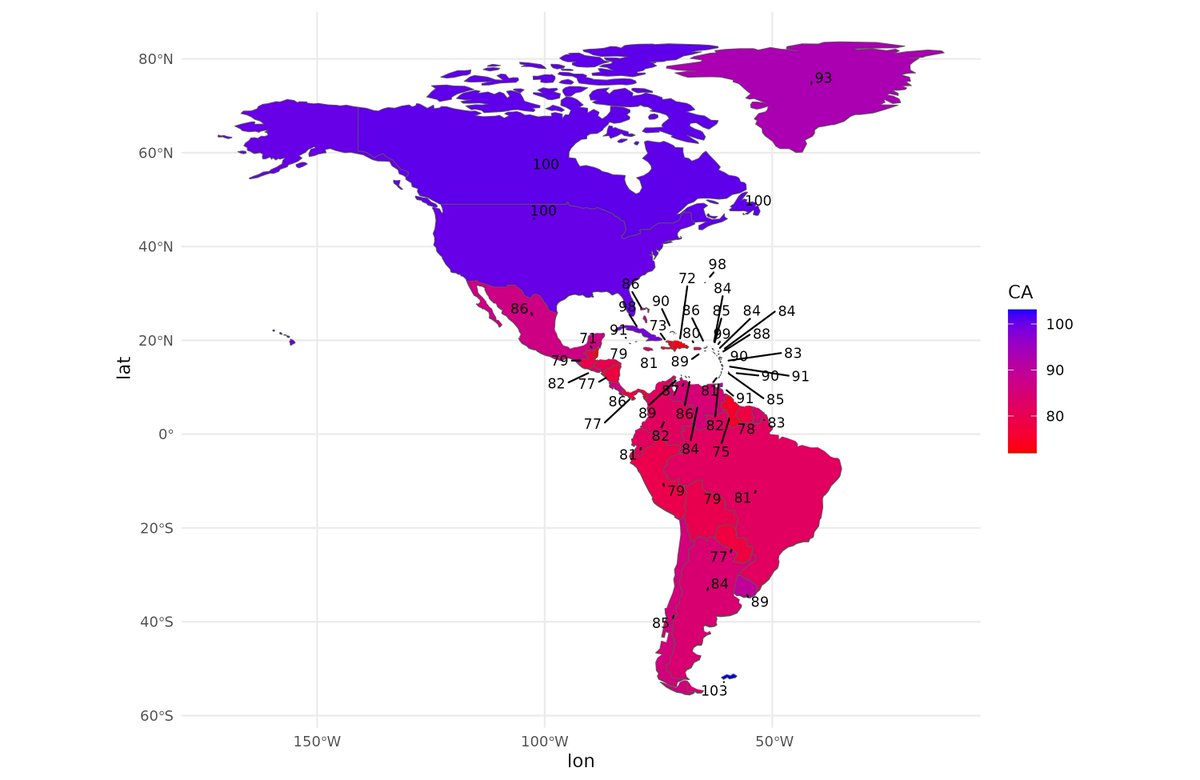
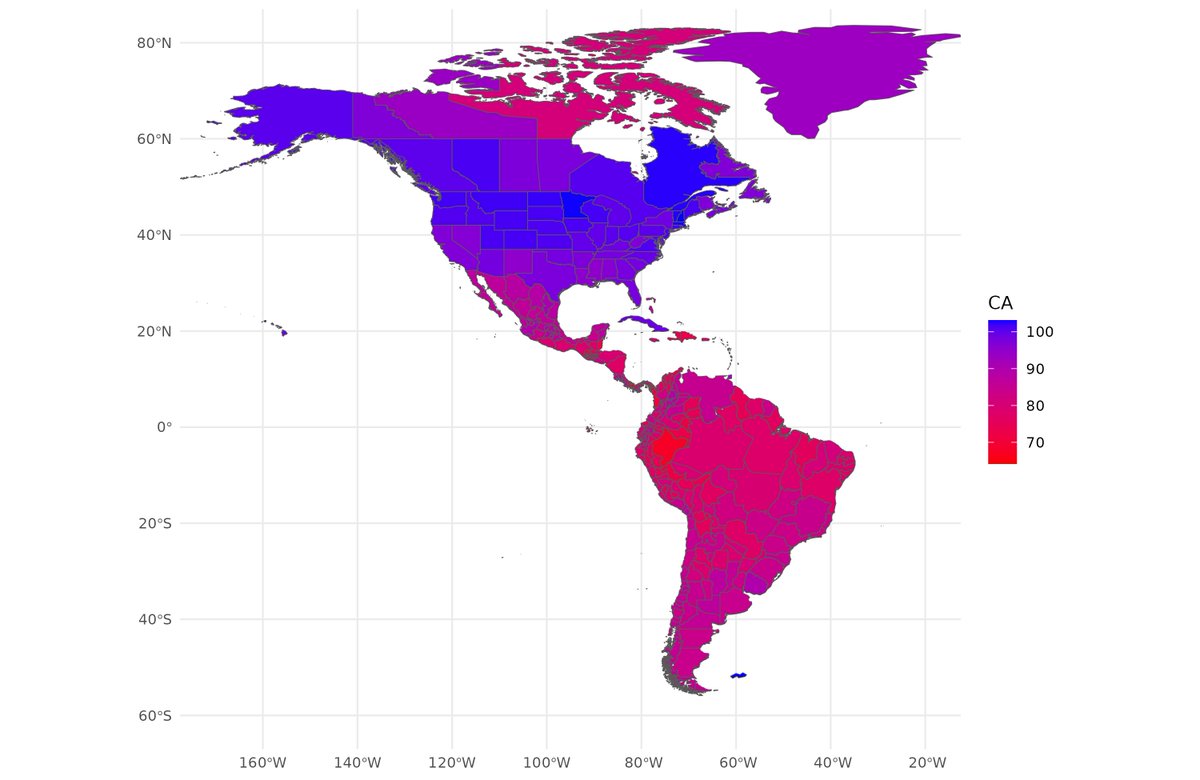
Next up, we gathered cognitive ability data from international datasets, and various regional and subnational scholastic tests, and any other source of standardized testing we could find. These were then converted to British international norms (Greenwich mean IQ) as best we could. It gives this map.
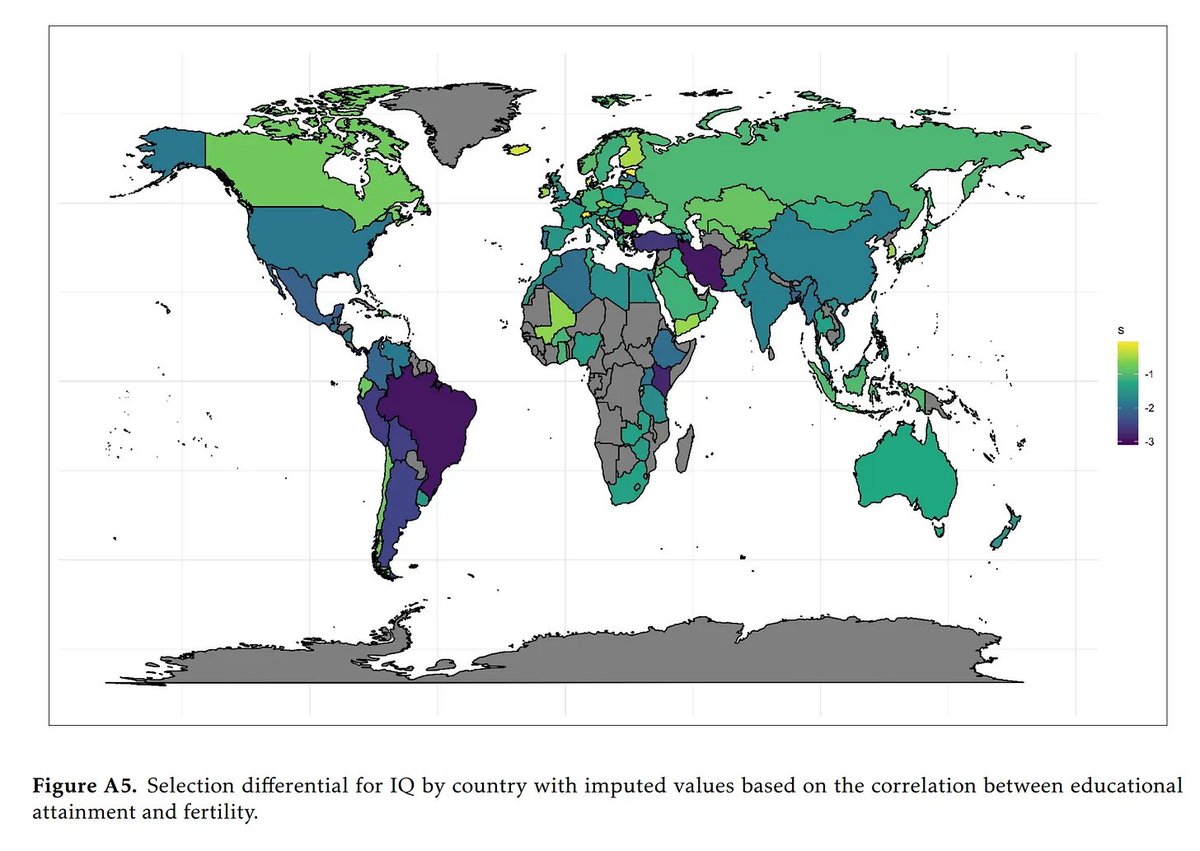
In the same way, we gathered data for the level of development of the same units. For nations, we used the indicators of Social Progress Index and others. For subnational data, we looked for composite indexes made by others. These are usually poverty indexes. These were then averaged to produce a single value. Since these subnational data have no particular scale, we set the weighted mean equal to the country's international mean, and set the SD equal to the ratio of international to subnational HDI SD. It gives this map.
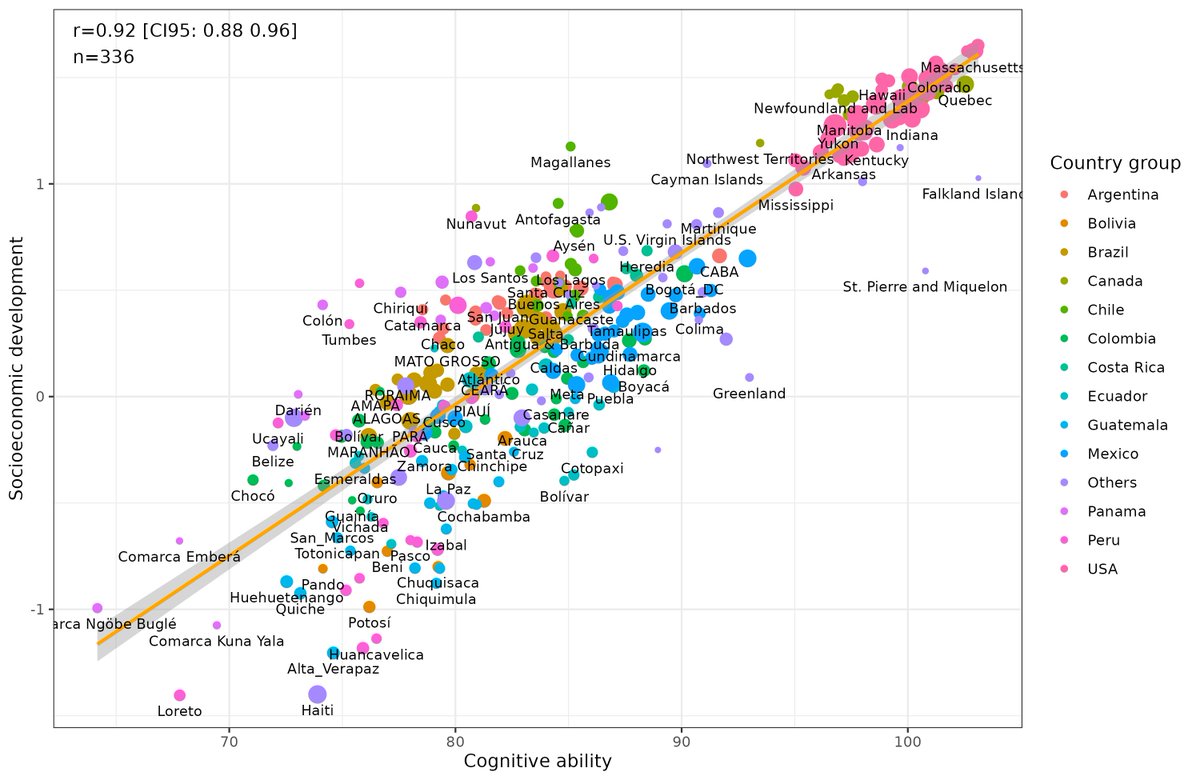
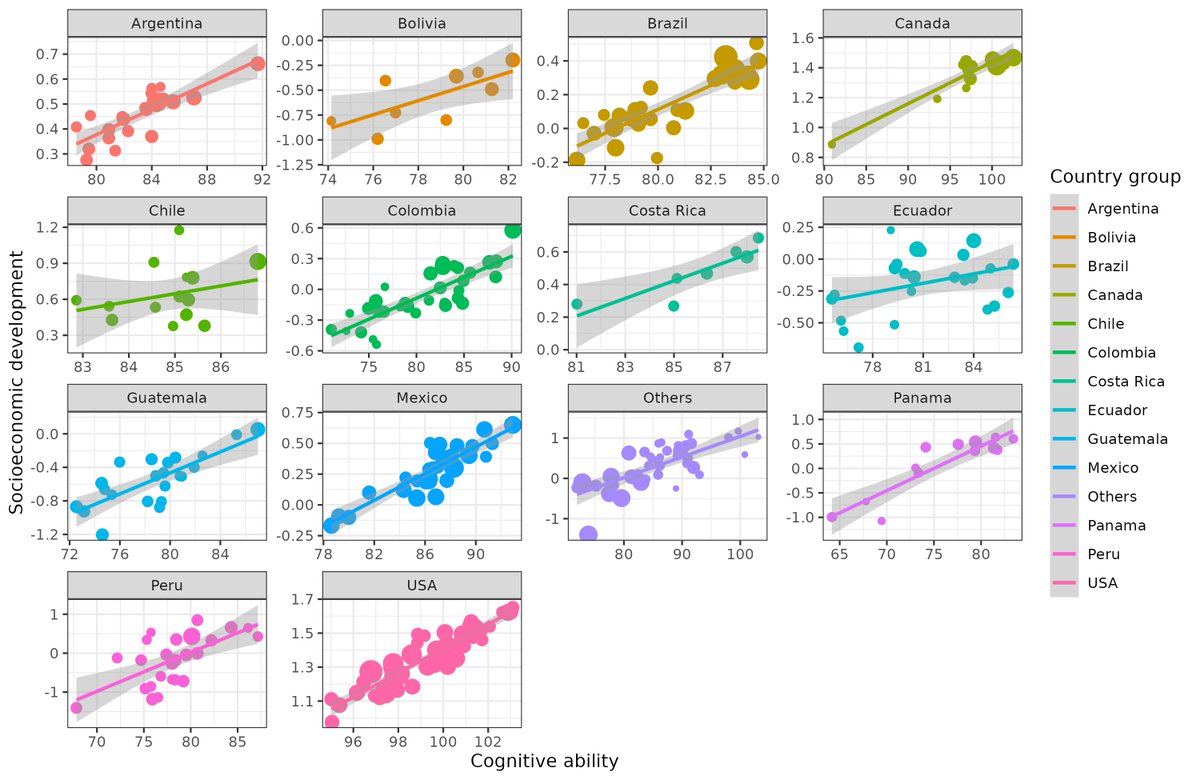
Finally, we were ready to do some scatter plots. First, socioeconomic development as a function of cognitive ability.
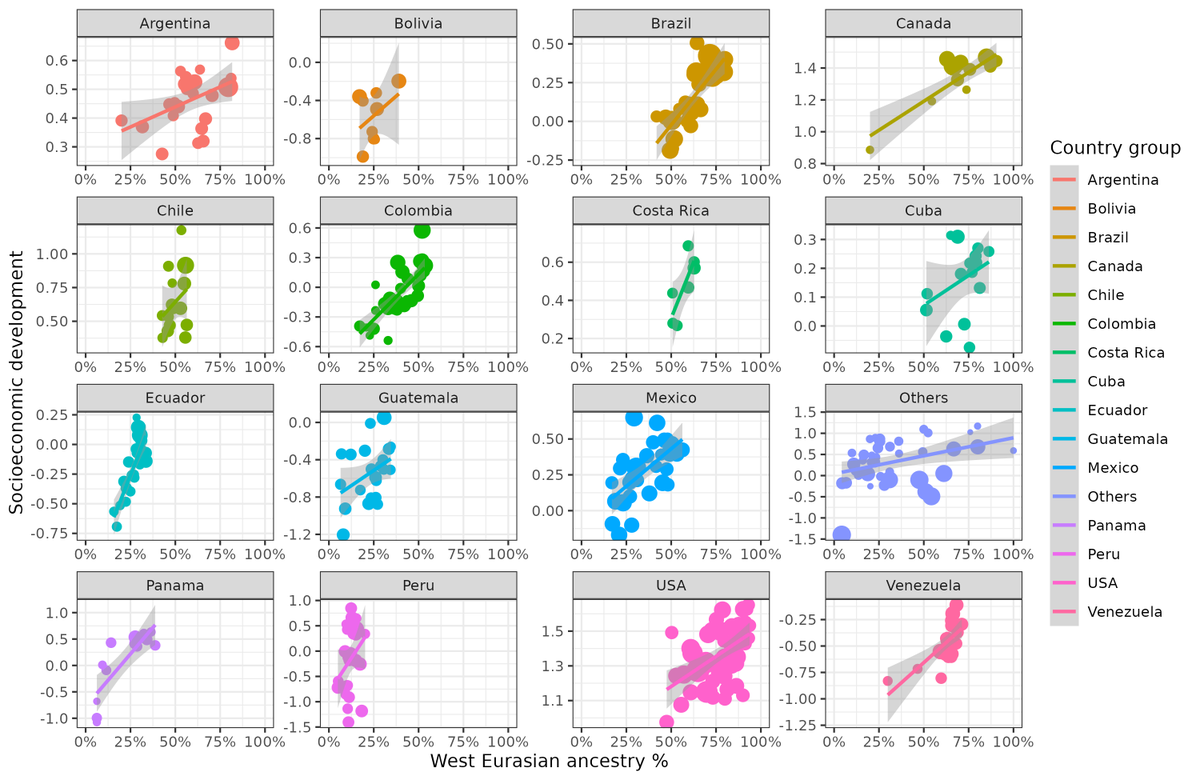
Socioeconomic development as a function of West Eurasian ancestry. We had to call it this because Levantine etc. ancestry will go into the European cluster. The variable mostly tracks European ancestry, but not entirely.

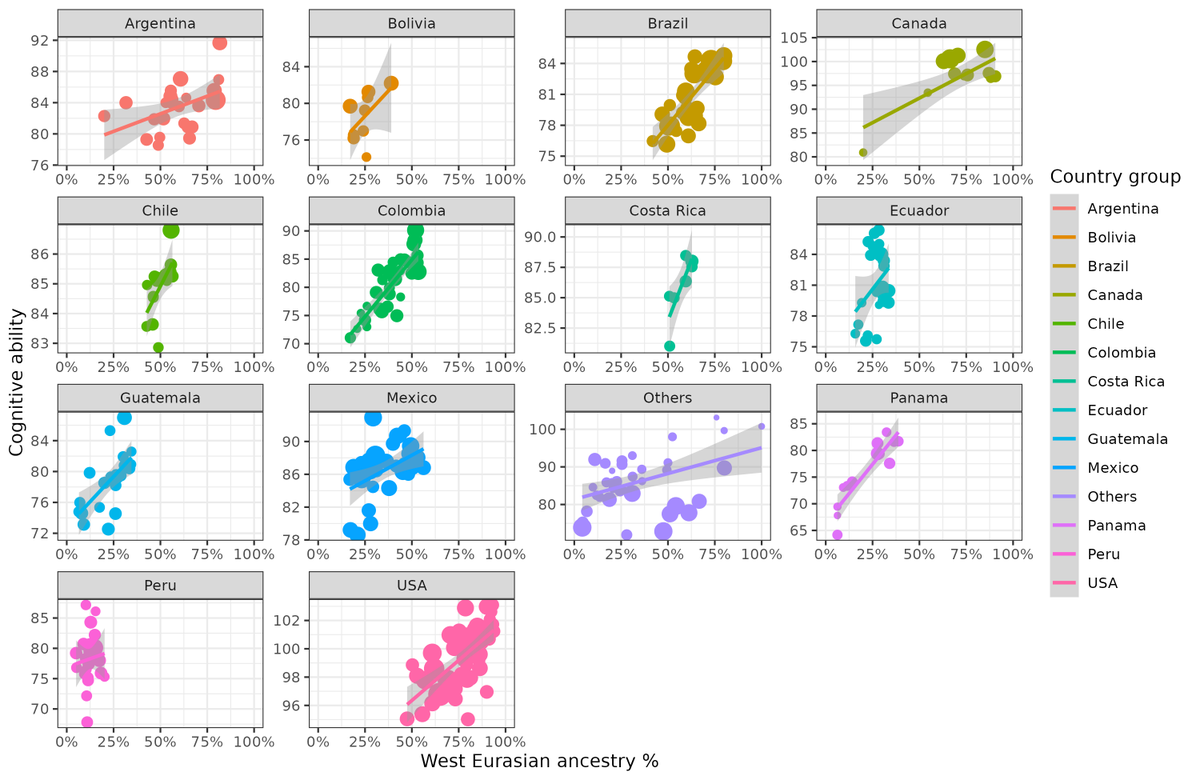
Cognitive ability as a function of West Eurasian ancestry.

You can see from the plots that the relationships in general also exist within countries. Here's the within-country plots:
We fit a variety of different regression models to the data:
1) OLS with few controls
2) OLS with lots of controls
3) OLS with spatial lags (pseudo-spatial model)
4) spatial error models (to deal with spatial autocorrelation)
5) multi-level (lmer) allowing for random slopes/intercepts
6) true fixed effects (with demeaning)
Overall, though, the results were pretty consistent in that ancestry is highly predictive of country level outcomes, and cognitive ability is the chief mediator. Mediation models suggested about 50% mediation.
The model details are too complex to present here in detail, read the paper!
Preprint:
Continental Genetic Ancestries as Predictors of Socioeconomic and Cognitive Variation Across the Americas
osf.io/preprints/soca…
Continental Genetic Ancestries as Predictors of Socioeconomic and Cognitive Variation Across the Americas
osf.io/preprints/soca…
By the way, open data! Here's the gigantic spreadsheet with various subcalculations. Go wild.
docs.google.com/spreadsheets/d…
docs.google.com/spreadsheets/d…
• • •
Missing some Tweet in this thread? You can try to
force a refresh