
The UKHSA have started publishing this goldmine again - but this year it's even more valuable *because they've reset it to a period when testing was consistent*.
This is very important and it shows yet again:
Covid infection makes you vulnerable to other infection.
This is very important and it shows yet again:
Covid infection makes you vulnerable to other infection.

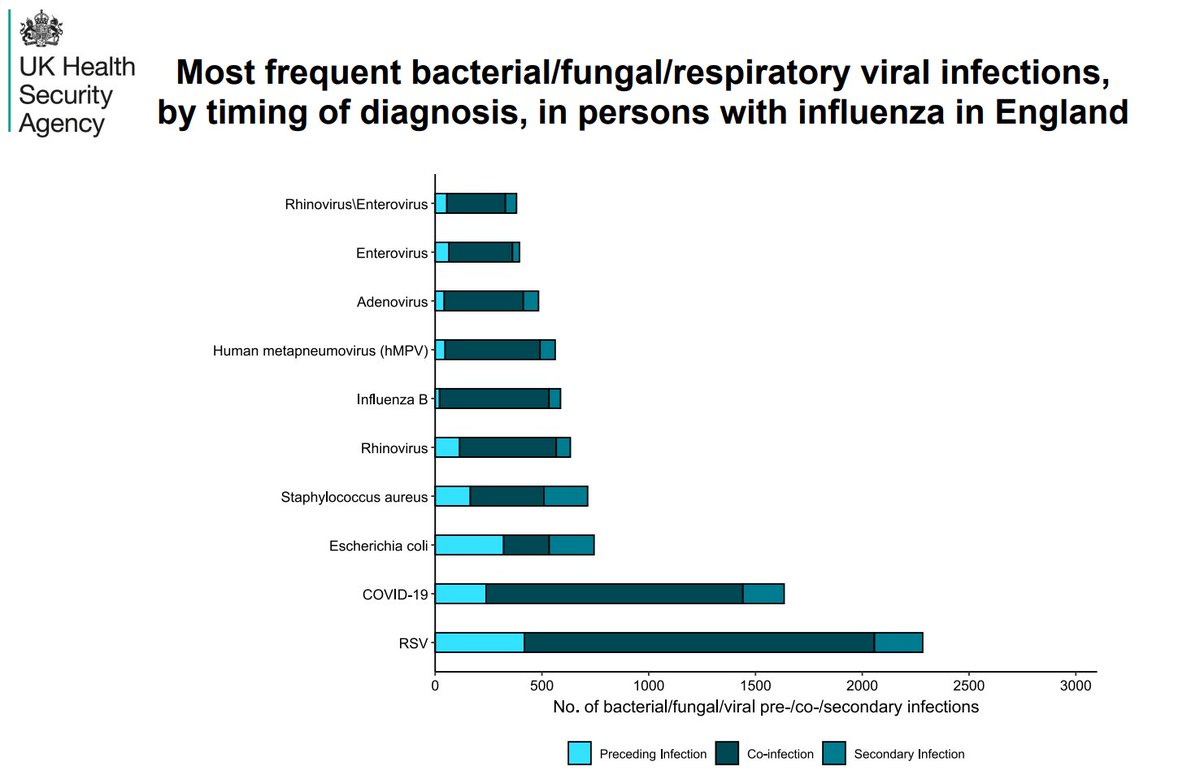
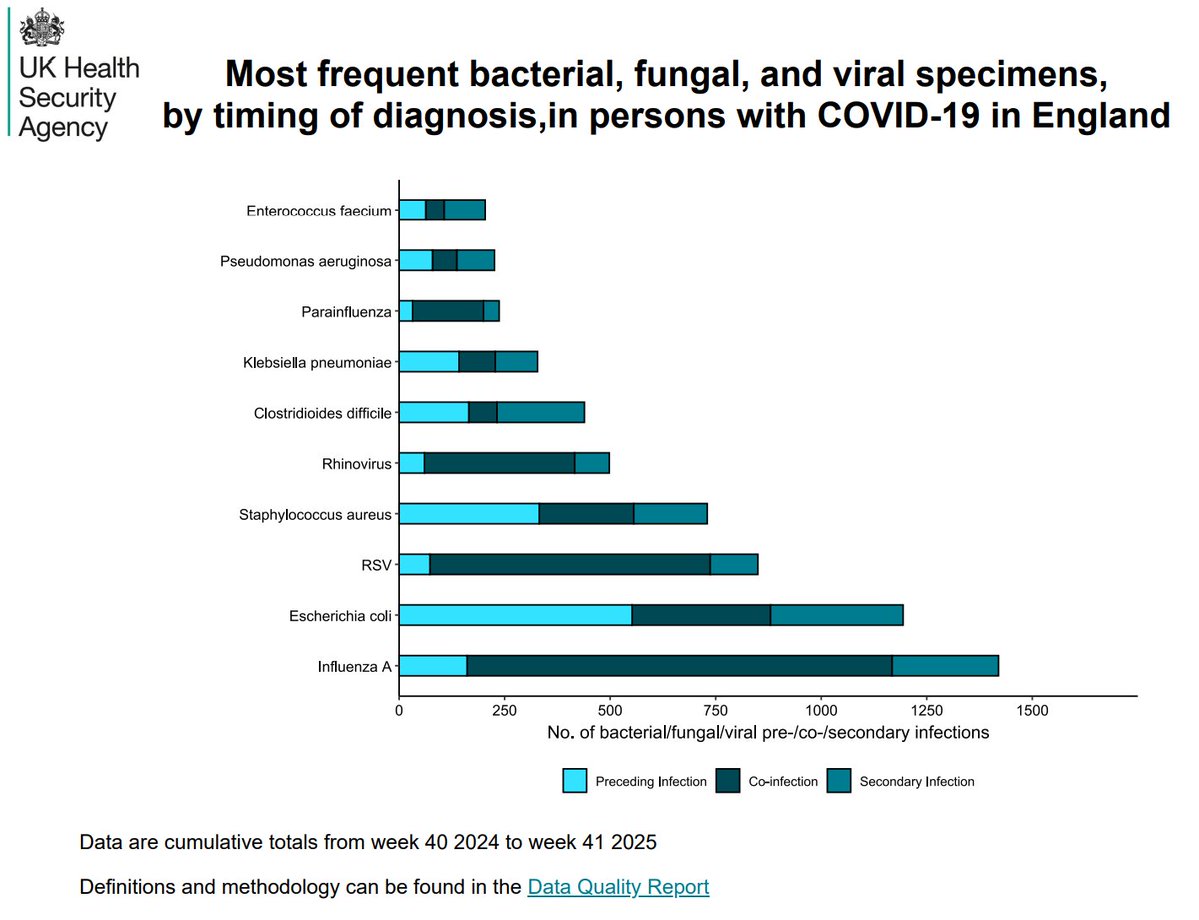
So... in the weekly flu and covid surveillance report (that also covers other respiratory infections too), they publish these two charts.


Covid and Flu's interactions with other infections.
They include:
They include:
'Preceding Infections' - so infections that you have had just before you have had flu or covid.
'Co-infections' - infections that you have at the same time as flu or covid.
'Secondary Infections' - infections that you have *within twenty eight days* of your flu or covid infection.
And they list the top ten for flu and for covid by *total volume* of all those categories.
But look at those two charts for just a fraction of a moment and you'll spot something very profound.
Look at the difference in the numbers of infections in that *third category*: Secondary infections.
It's actually quite hard to see the information clearly on that chart, and they don't publish the data breakdown in the attached data file, so I've measured each of those bars for you to reproduce just that data on its own.
It's as stunning this year as it was last year.
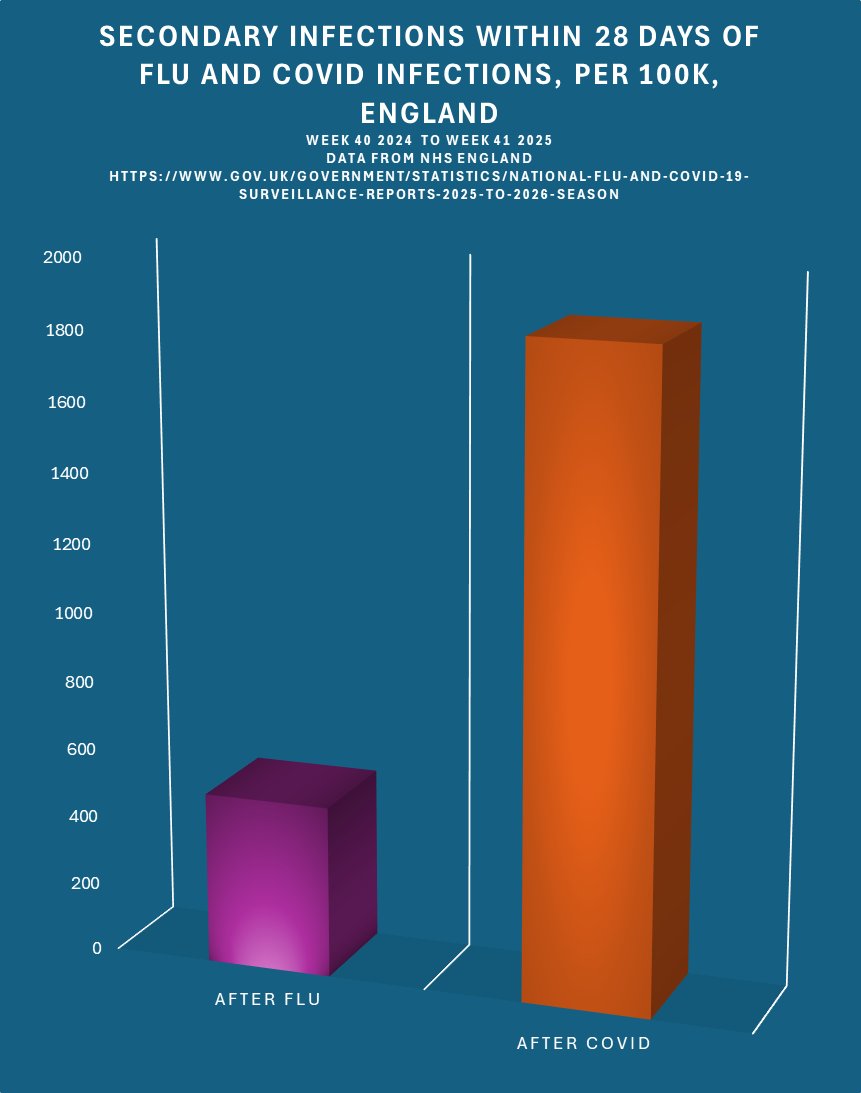
We know how many people tested positive for both flu and covid during that period, so we can see the exact proportion of how many secondary infections people suffer in the 28 days after catching Flu, and the 28 days after catching Covid.
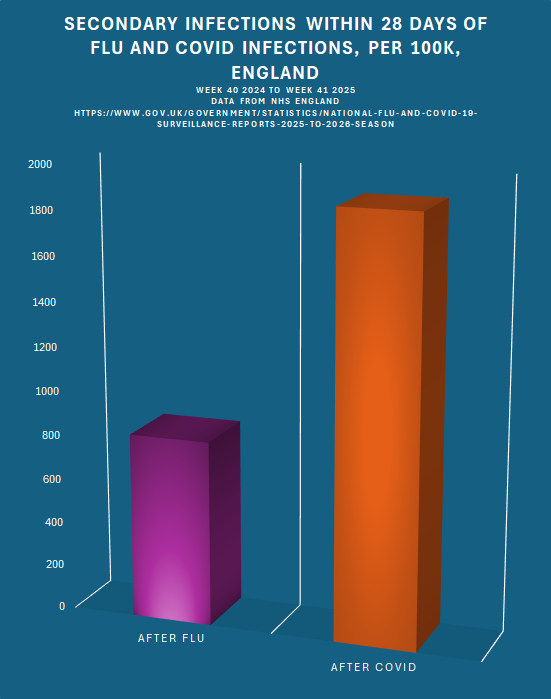
We couldn't work that proportion out with the data that we had last year, but now we know when the data was gathered, and we know that flu and covid testing have remained roughly consistent during that time period, so it's possible to work out the chart above.
From week 40 2024 to week 41 2025, people who tested positive for Flu were officially diagnosed with 884 secondary infections per 100k cases.
People who tested positive for Covid were officially diagnosed with 1887 secondary infections per 100k cases.
People who tested positive for Covid were officially diagnosed with 1887 secondary infections per 100k cases.
Flu infection makes you more vulnerable to secondary infections for a short time period.
But Covid infection makes you EVEN MORE vulnerable to secondary infection during that time period.
But Covid infection makes you EVEN MORE vulnerable to secondary infection during that time period.
But this only scratches the surface, because study after study after study has also shown that Covid infection causes dysfunction in your immune system not just four 28 days, but 280 days or more...
... whereas flu *doesn't*.
So this chart is stunning, but it's *only the first 28 days*.
Covid makes you vulnerable for months and months and months after the data for this chart ends:
Covid makes you vulnerable for months and months and months after the data for this chart ends:

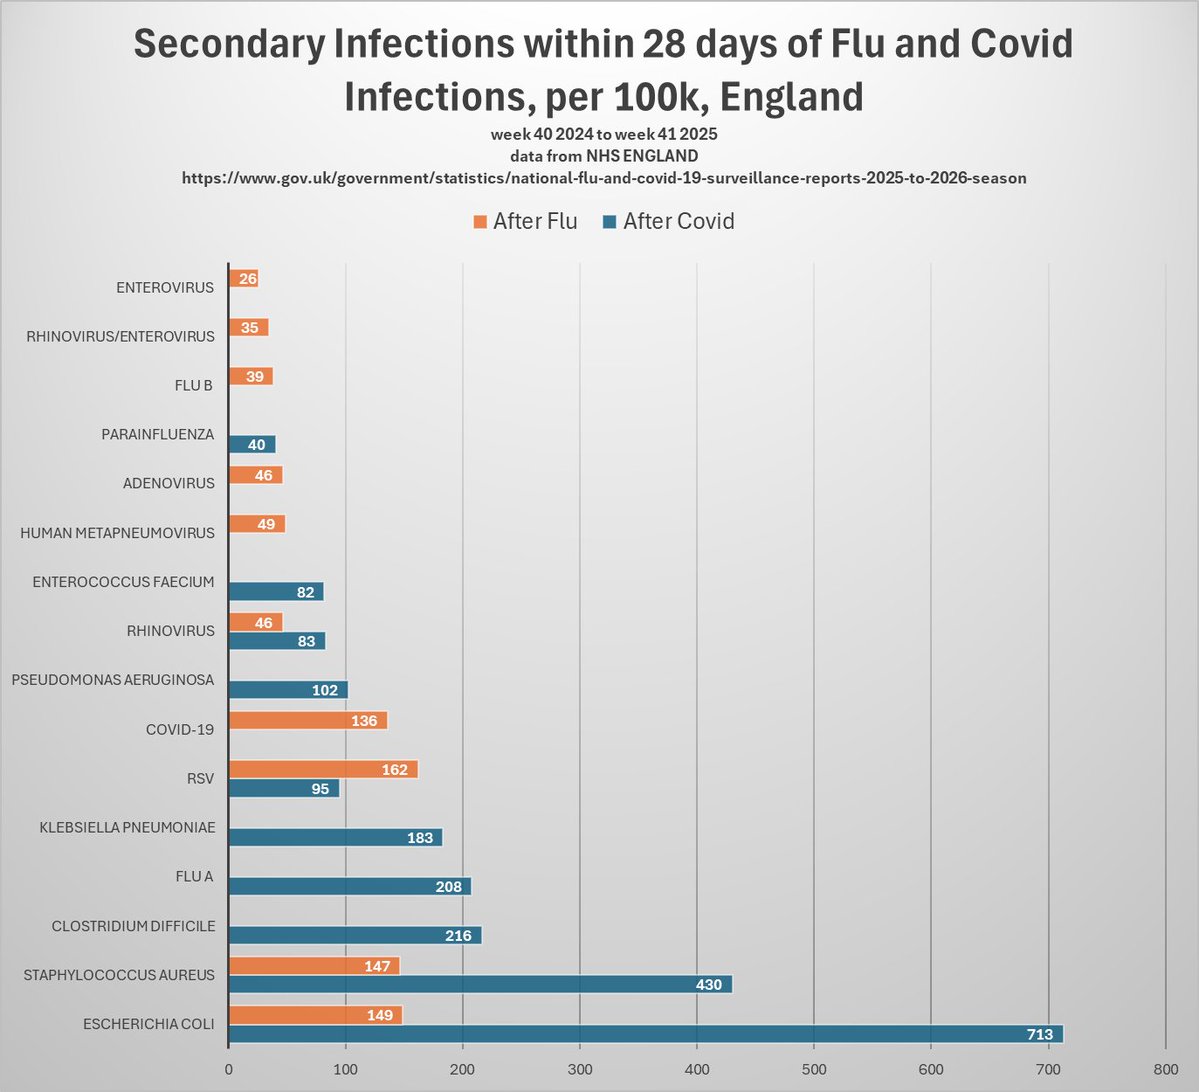
So that's the totals... but let's look at the breakdowns of the individual infections.
Now... the data on the two charts on the surveillance report only covers the top ten for flu and for covid by *total volume* of all the categories - preceding, co-infection, and secondary infection.
And those top tens are different.
Only four of the pathogens are on both charts.
Only four of the pathogens are on both charts.
And here they are:

You're nearly twice as likely to test positive for rhinovirus after you've had Covid than Flu.
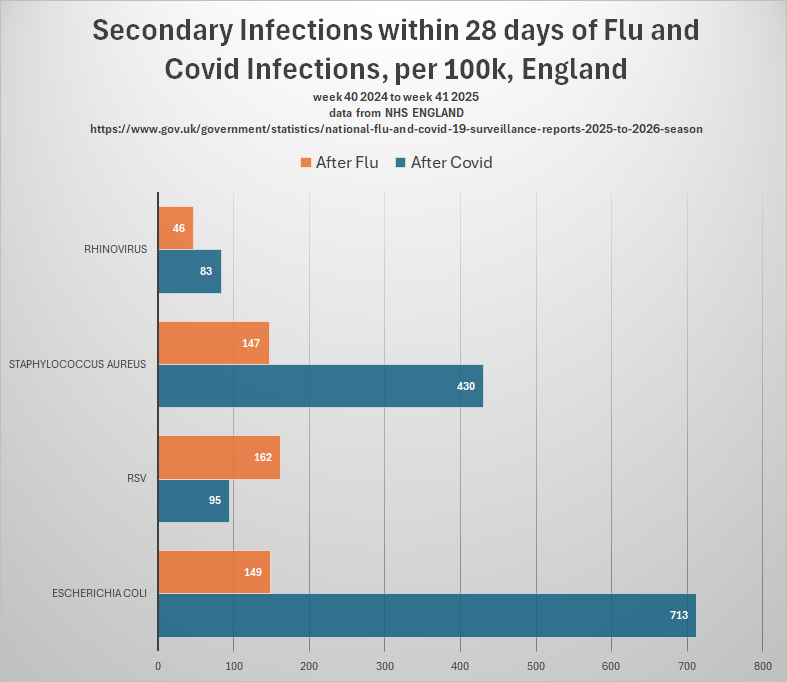
You're nearly THREE times as likely to test positive for Staphylococcus Aureus after Covid than after Flu.
(and you know what MRSA stands for, right?)
(and you know what MRSA stands for, right?)

And you're nearly FIVE times as likely to test positive for E coli after Covid than after Flu.

RSV is a bit of a tricky one - Flu and RSV generally hit in very similarly timed waves each year, so I think it's inevitable that you're going to have more overlap with flu.
I don't think that's statistically important.
I don't think that's statistically important.
And this is what it looks like when you list the top tens of both after covid and after flu on the same chart.
It's just boggling.
It's just boggling.
But it feels a bit weird to have covid after flu on there and flu after covid on there (although, yes, you're more likely to catch covid after flu than flu after covid).
And it also feels weird to have RSV on there because that comes exactly in Flu's season... so...
And it also feels weird to have RSV on there because that comes exactly in Flu's season... so...
Look at that.
That is just incredible.
Seriously.
Just look at it for five minutes.
Let it soak in.
That is just incredible.
Seriously.
Just look at it for five minutes.
Let it soak in.

And here's the earlier graph when you take out flu, covid, and rsv from the *top ten infections*.
And the other kicker about this is that the infections after covid are so numerous that the most common infection after flu would come FIFTH on the infections after Covid list.
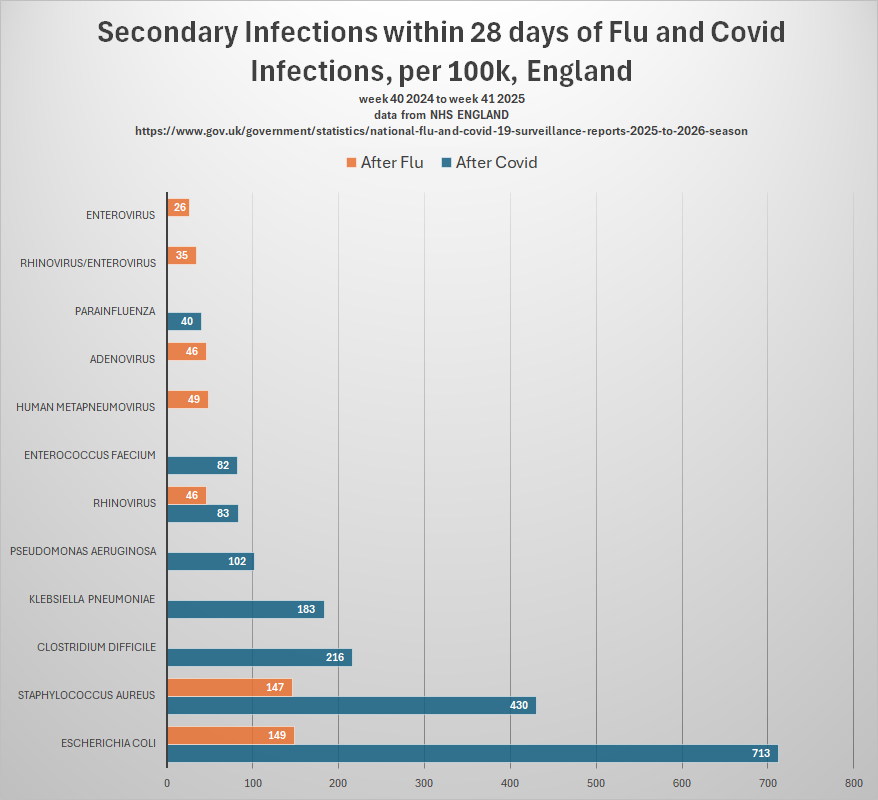
So the chances are that even the infections that would come 20th on a top infections after Covid list would still beat many on the top ten of infections after Flu.
Covid infection makes you massively more vulnerable to secondary infections.
And, again, this is only in the short 28 day window after the initial infection.
I say 'short'.
Actually, it's quite long for flu.
Flu causes problems instantly, then is gone.
I say 'short'.
Actually, it's quite long for flu.
Flu causes problems instantly, then is gone.
Covid infection causes problems with your immune system for months, and even *years* afterwards.
And what's worse:
That effect is cumulative with every covid infection you get.
Your government has the data.
But they just aren't reading it.
But they just aren't reading it.
Or they are reading it, and they're sentencing you to lifelong immune deficiency.
And we all know where that leads, right?
And we all know where that leads, right?
Oh, and of course you know that testing of Covid is only a fraction of the total number of actual cases, so on every front this data is going to be higher.
Hundreds of thousands of infections made possible by covid infections.
Hooray.
Hooray.
• • •
Missing some Tweet in this thread? You can try to
force a refresh


