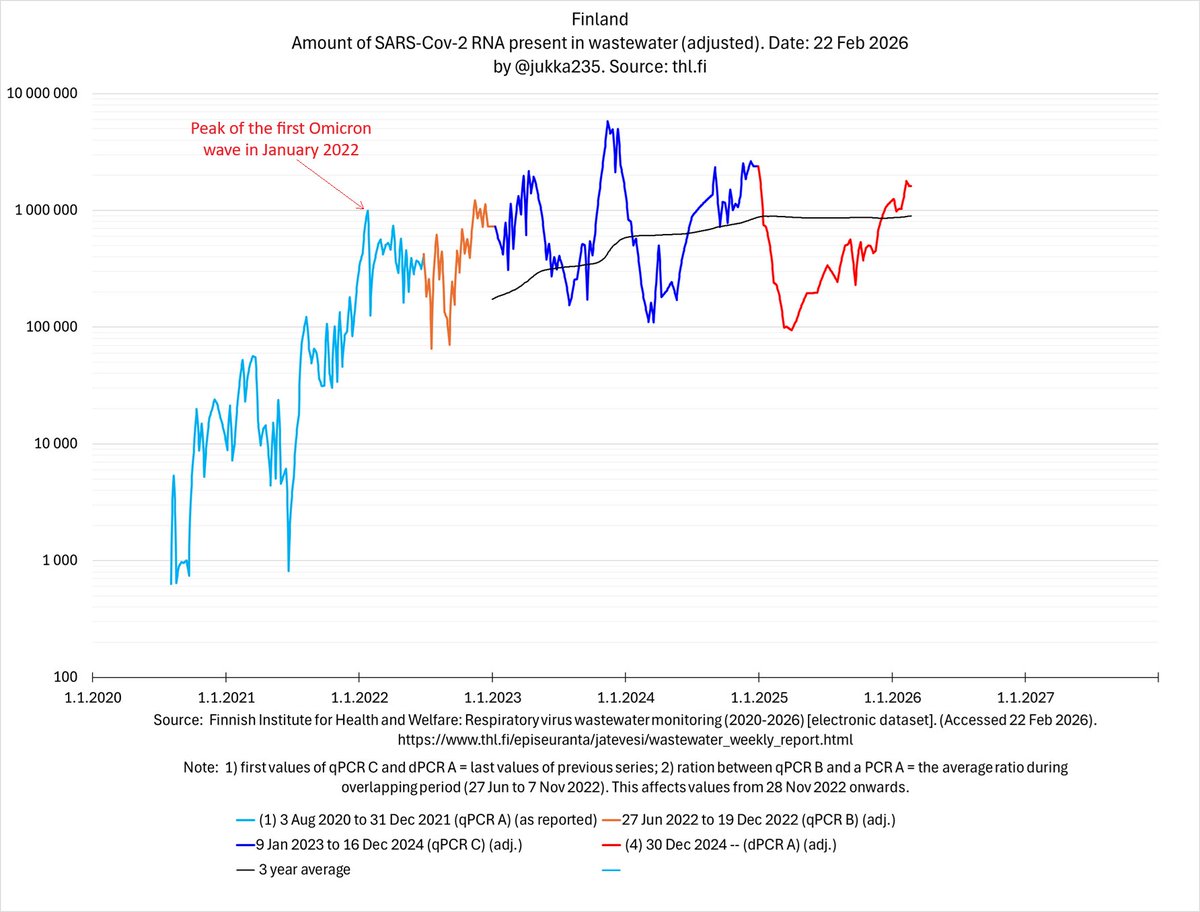
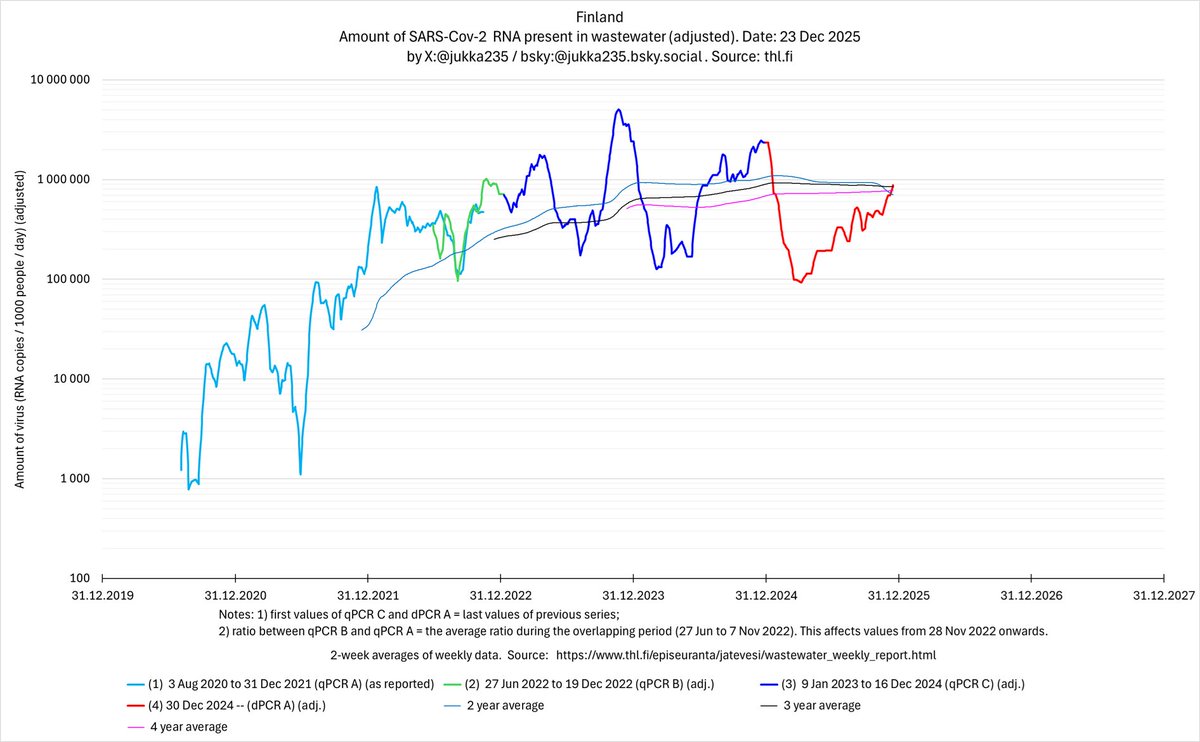
Finland's epidemic 23 Dec 2025: amount of virus in wastewater appears to have risen above the first Omicron wave. Post-Omicron baseline is permanently higher than pre-Omicron; repeated waves are showing no diminishing.
1/x
1/x
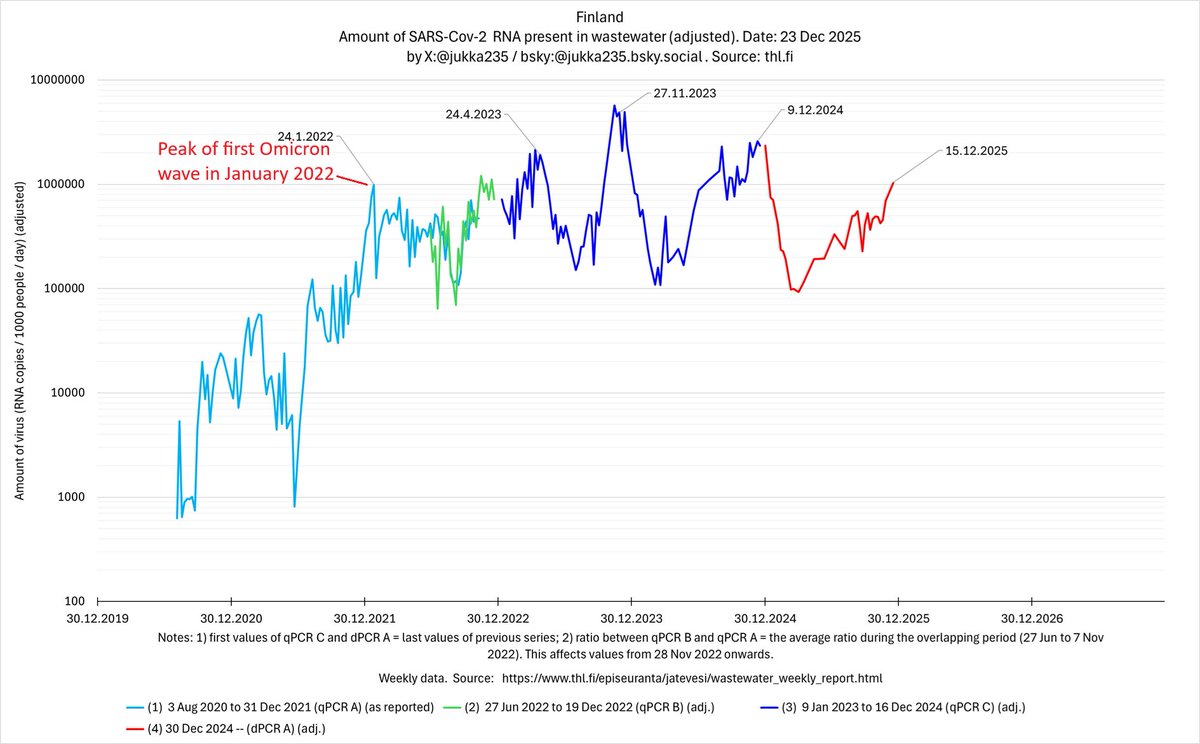
Post-Omicron baseline is permanently higher than pre-Omicron
- before late 2021, levels were mostly 10³–10⁴.
- from 2022 onward, even troughs sit around 10⁵, or 10-100x higher
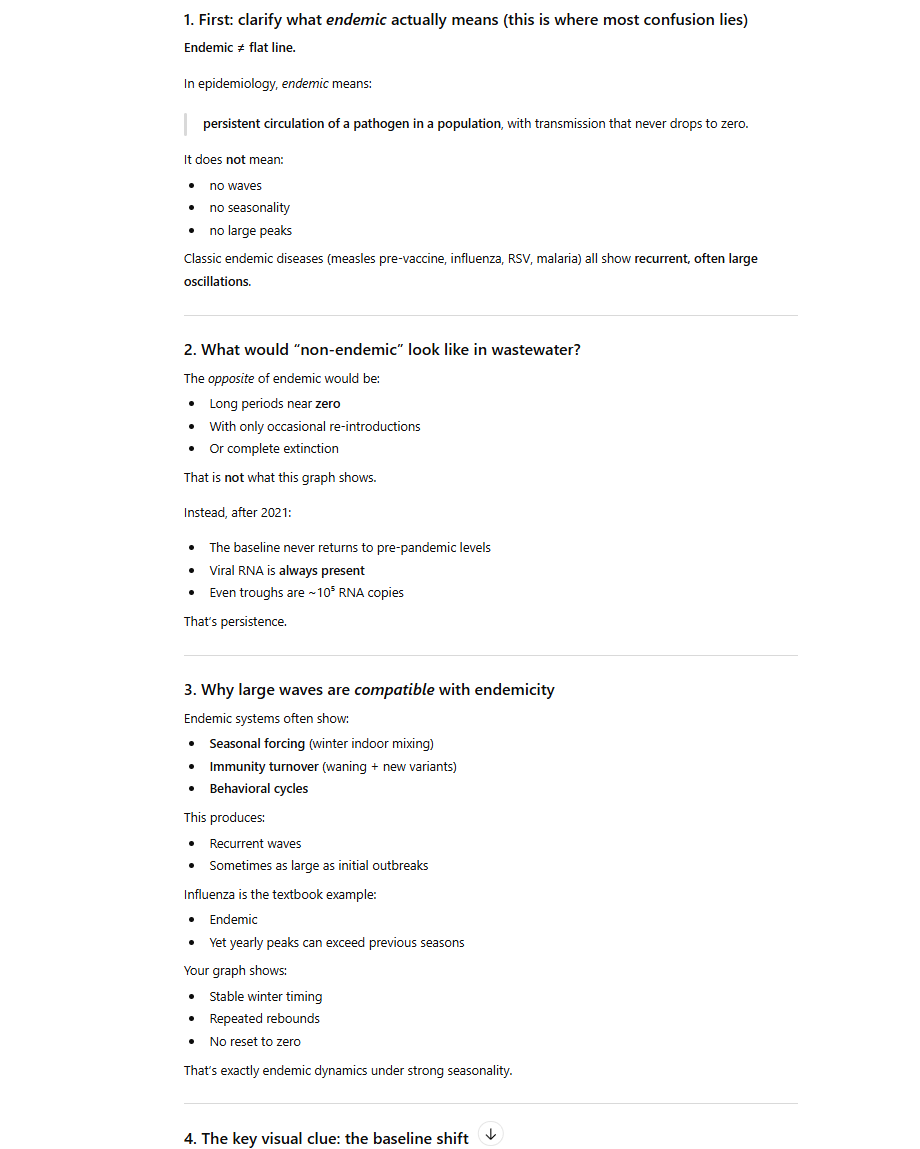
- C19 has become endemic
- constant background transmission, even outside waves
2/x
- before late 2021, levels were mostly 10³–10⁴.
- from 2022 onward, even troughs sit around 10⁵, or 10-100x higher
- C19 has become endemic
- constant background transmission, even outside waves
2/x

Repeated large waves in 2023–2024, not diminishing. Notable peaks:
- Apr 2023
- Nov 2023 (highest for the entire pandemic)
- Dec 2024
These peaks are:
- comparable to or higher than Omicron 2022
- evidence against a simple “each wave gets smaller” narrative
3/x
- Apr 2023
- Nov 2023 (highest for the entire pandemic)
- Dec 2024
These peaks are:
- comparable to or higher than Omicron 2022
- evidence against a simple “each wave gets smaller” narrative
3/x

Public perception vs reality gap
Despite much lower public attention after 2022:
- viral circulation in 2023–2025 often equals or exceeds Omicron 1 levels
This highlights:
- Surveillance fatigue ≠ virus disappearance
- Policy and media attention are diverging from epidemiological reality
4/x
Despite much lower public attention after 2022:
- viral circulation in 2023–2025 often equals or exceeds Omicron 1 levels
This highlights:
- Surveillance fatigue ≠ virus disappearance
- Policy and media attention are diverging from epidemiological reality
4/x

Finland has transitioned from pandemic waves to a high, seasonally surging endemic state, with:
- persistent high baseline
- winter peaks rivaling early Omicron
- surveillance, media attention down
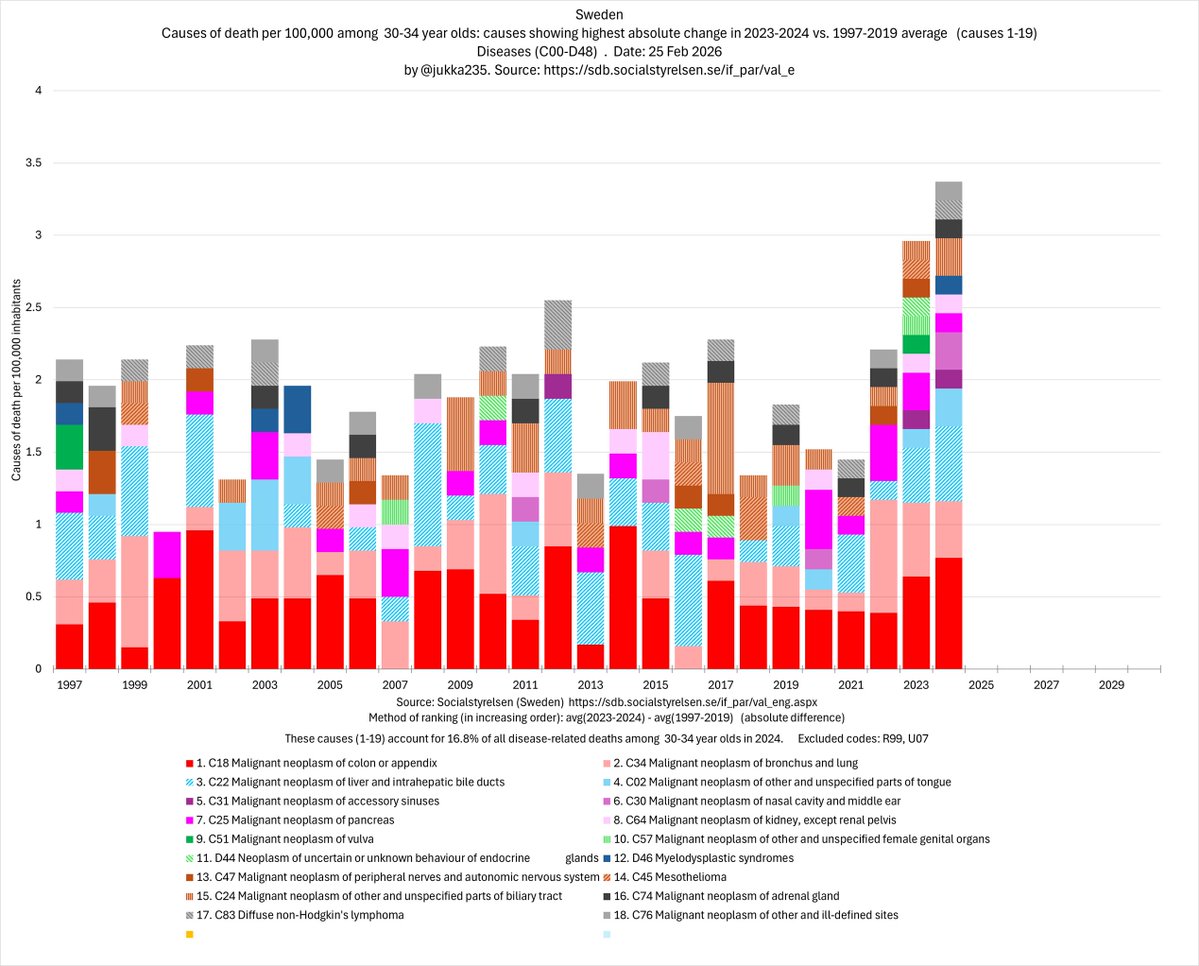
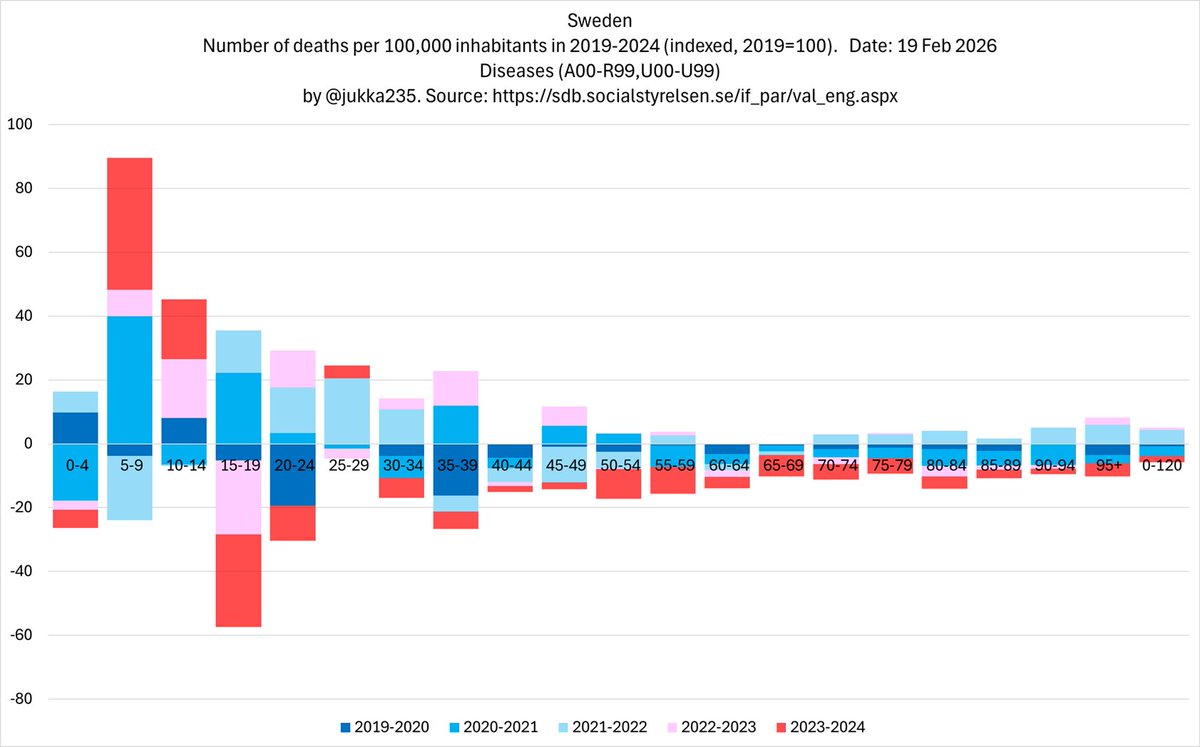
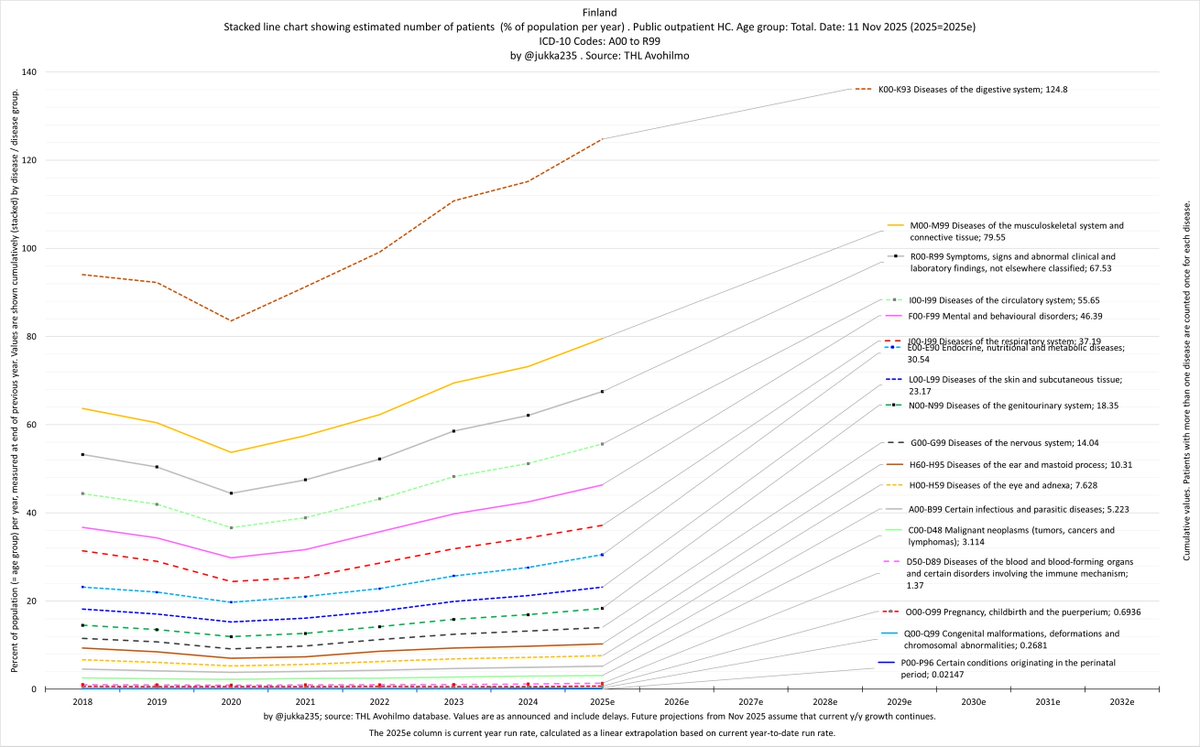
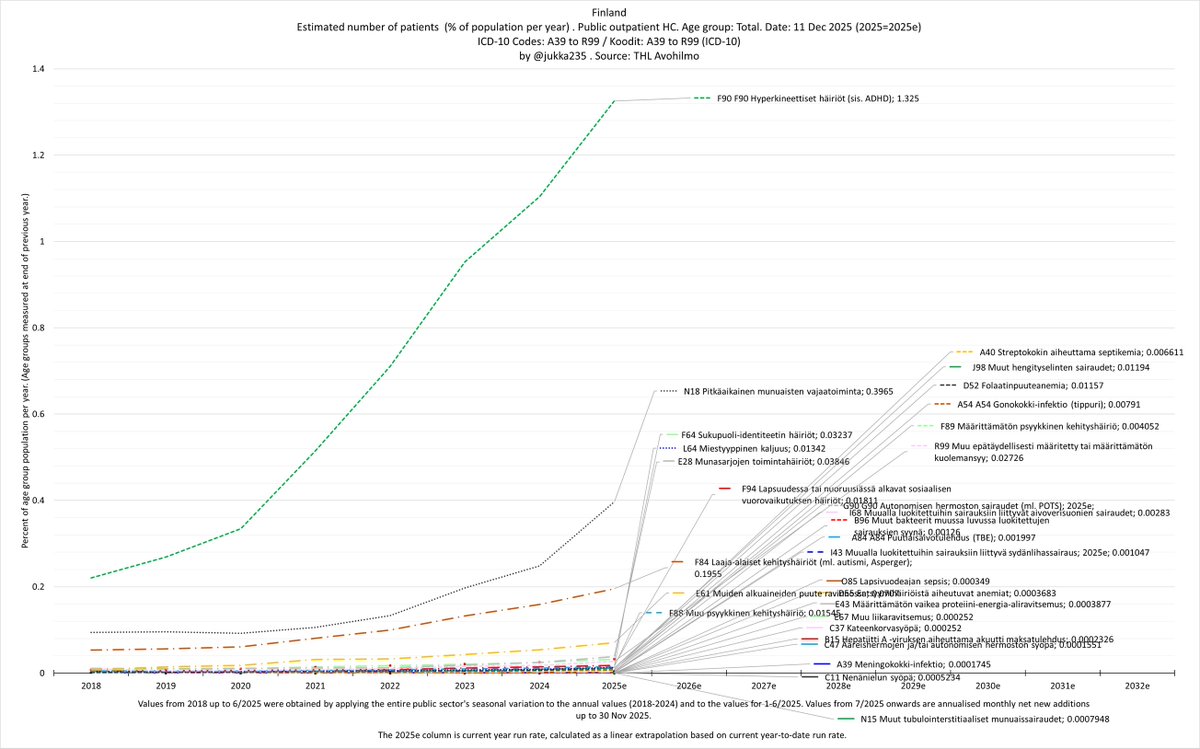
- 100s of diseases showing remarkable patient growth across all age groups; no growth before 2020
5/x
- persistent high baseline
- winter peaks rivaling early Omicron
- surveillance, media attention down
- 100s of diseases showing remarkable patient growth across all age groups; no growth before 2020
5/x
It's an endemic alright. The key point is the floor virus level (around 10⁵) post-Omicron.
6/x
6/x


It looks that they got the endemic both they and WEF (Davos) spoke about in 2021. But I guess they were not planning for this across-the-board increase of hundreds of diseases across all age groups. There is nothing endemic in this graph about all 1704 ICD-10 diseases.
7/x
7/x
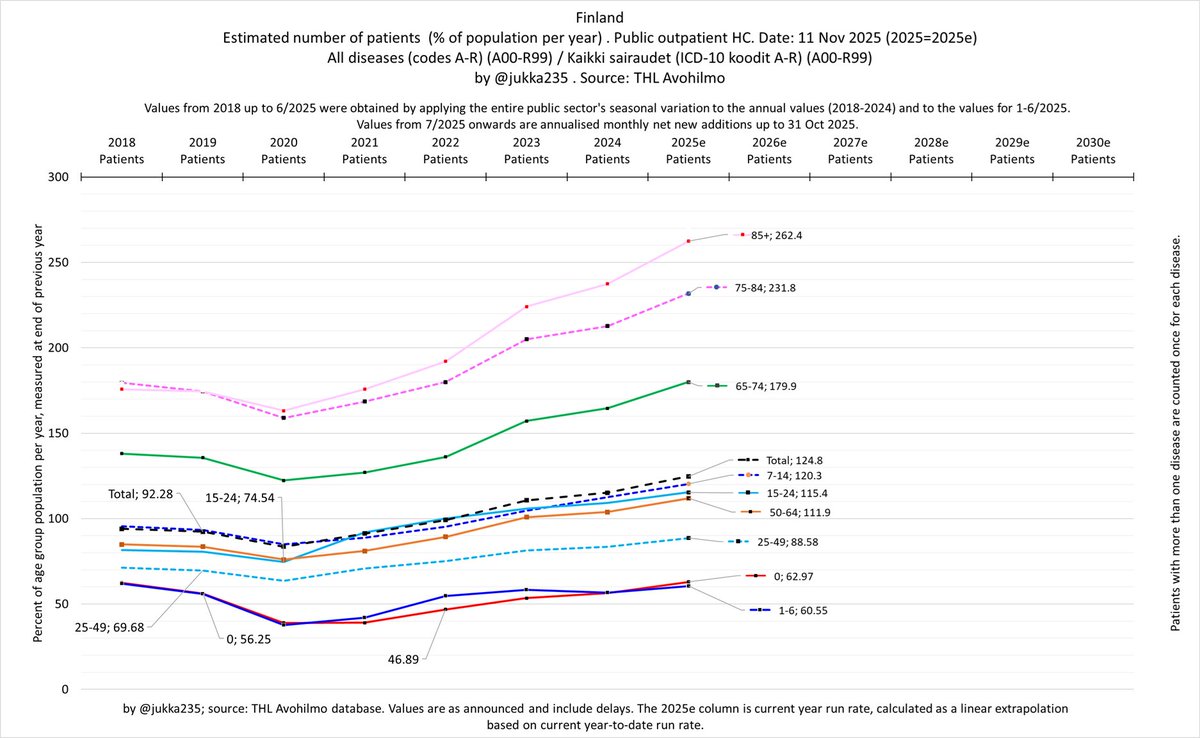
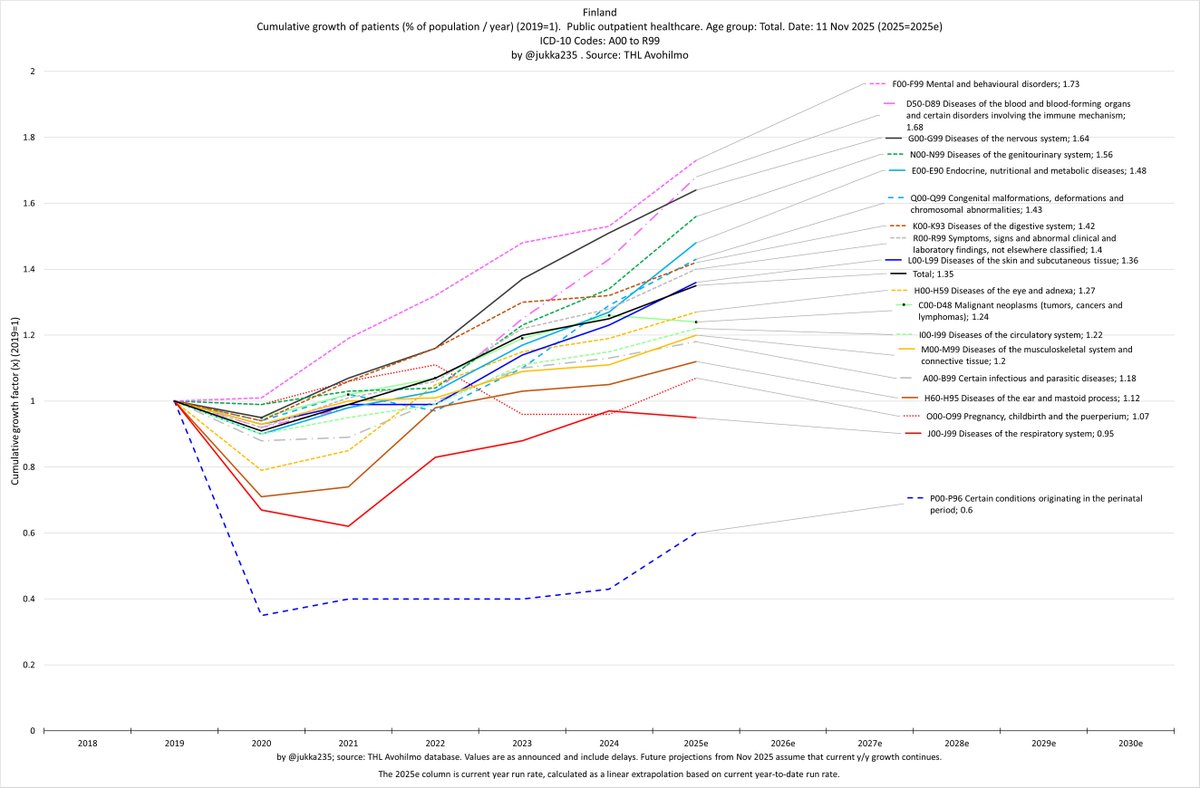
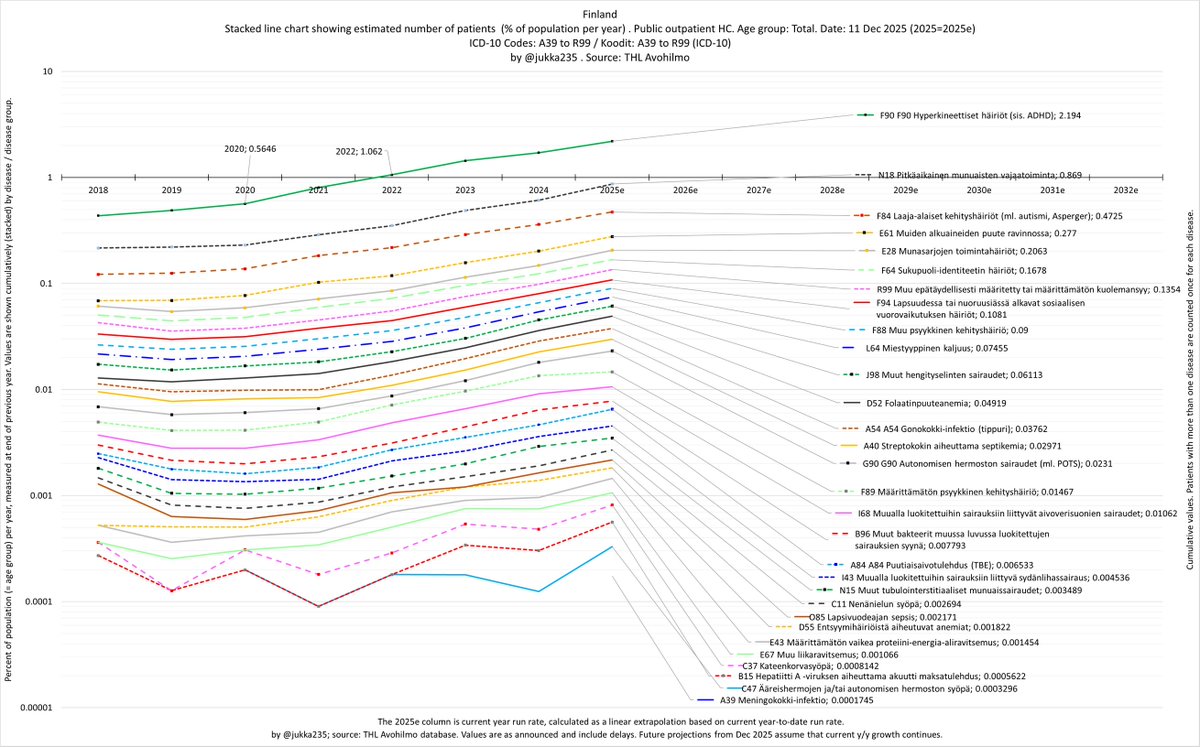
In fact, we’re seeing exponential growth in patient numbers across all disease and age groups in Finland. The trend is strikingly linear on a log scale, with no sign of any slowdown since 2020.
No health system can take this for long. It's just a matter of time.
8/x
No health system can take this for long. It's just a matter of time.
8/x

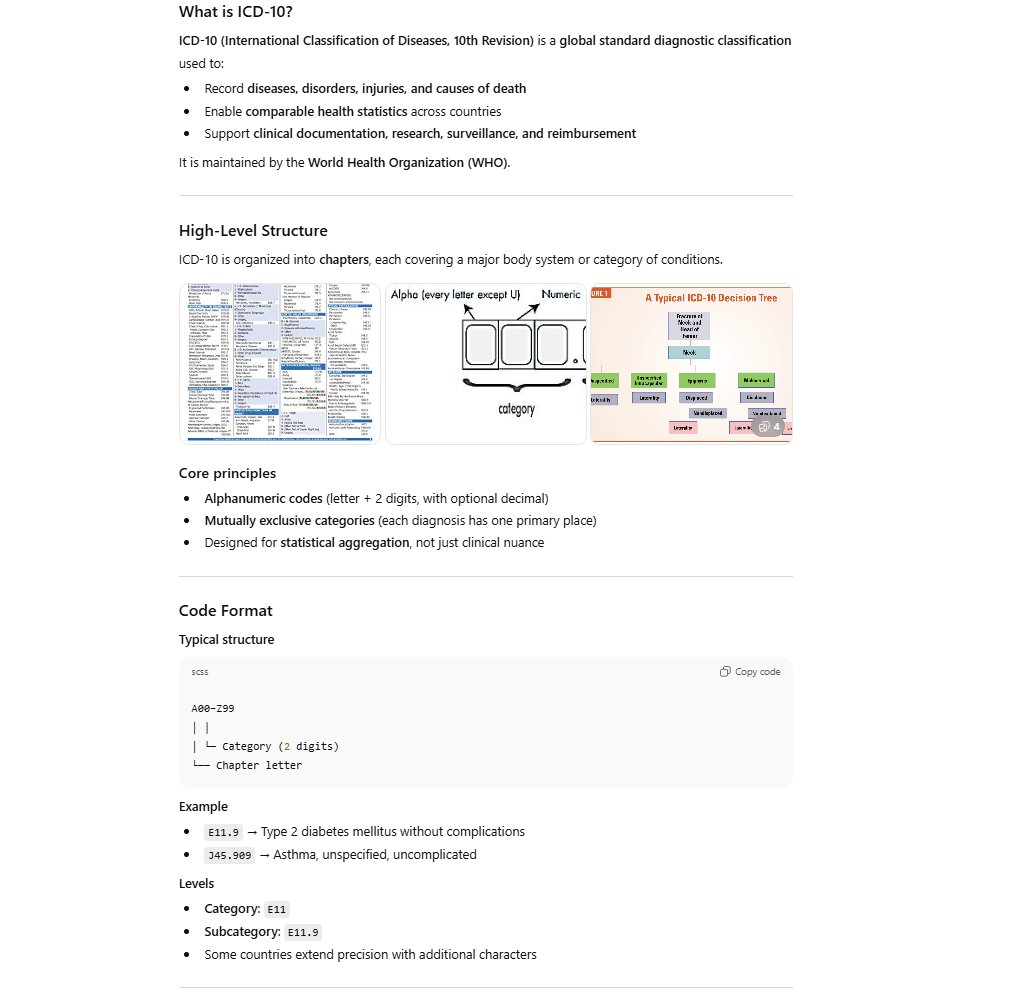
I have covered the top level disease groups (called chapters) from A to R. These divide into 1393 disease categories reported by THL (and me) and further into approx. 10500 individual diseases or conditions (not reported). (I call disease categories "diseases".)
9/x
9/x
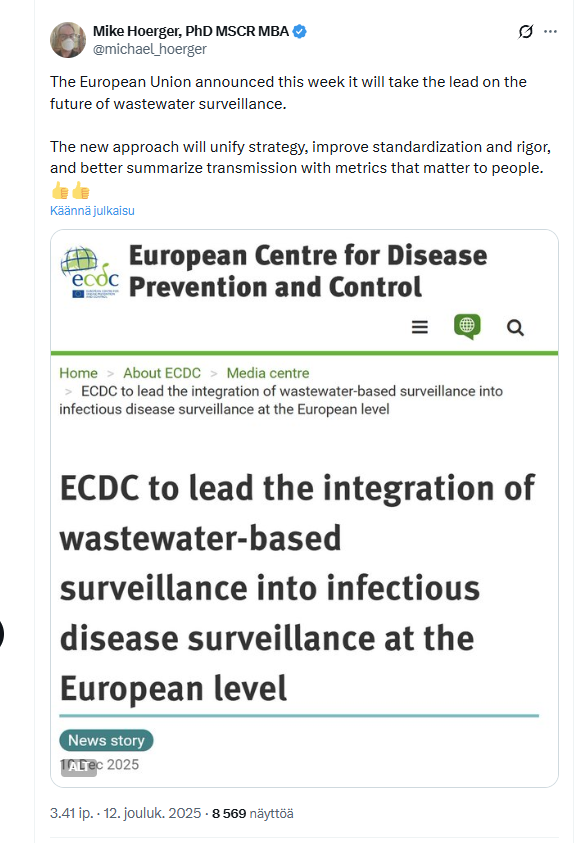
There is hope that wastewater analysis will continue to improve. Finland normally wants to be the model student in EU.
10/x
10/x
https://x.com/michael_hoerger/status/1999474568789151846
Here is the graph with 2-, 3-, and 4-year averages. The troughs and peaks don’t usually fall in the same months every year, so the average needs to capture a period longer than one year.
11/x
11/x
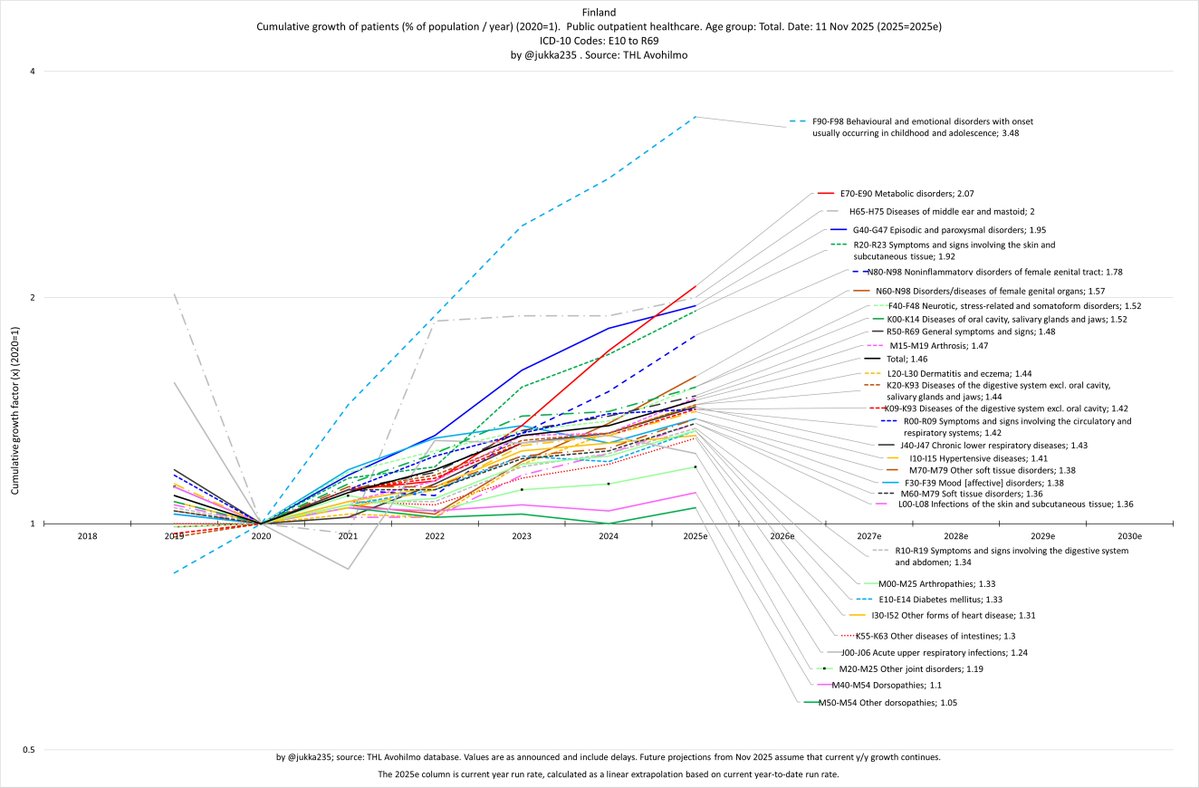
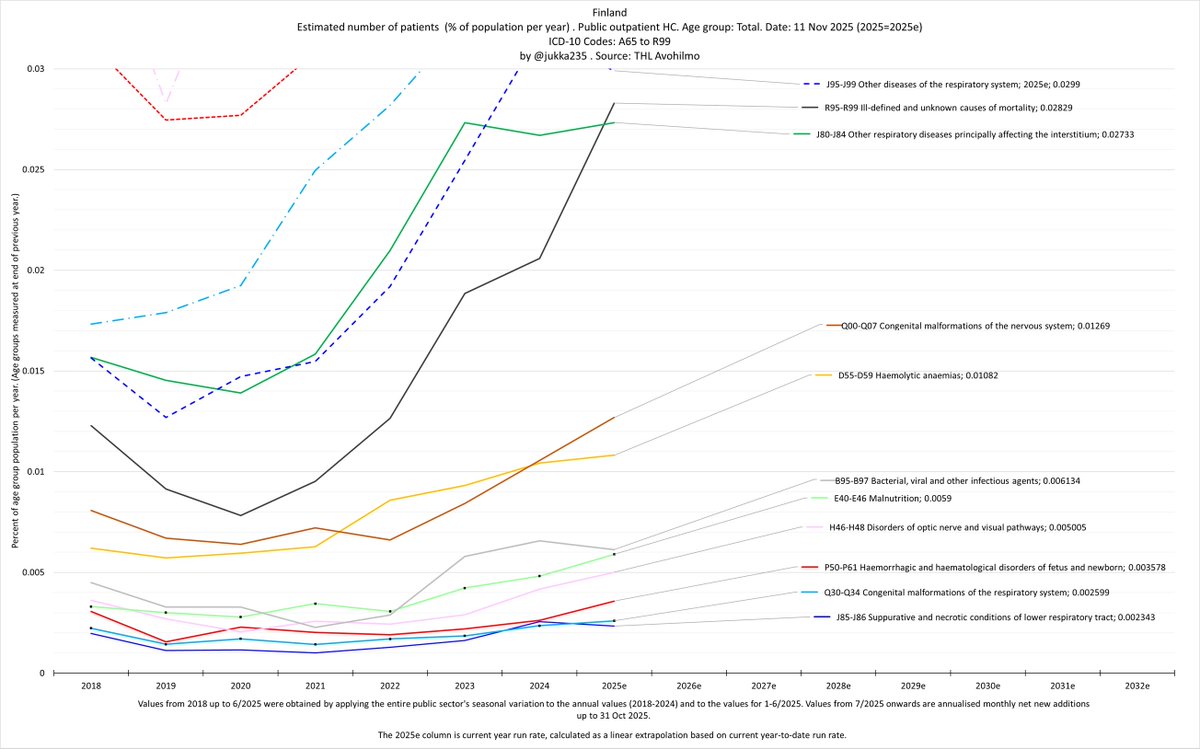
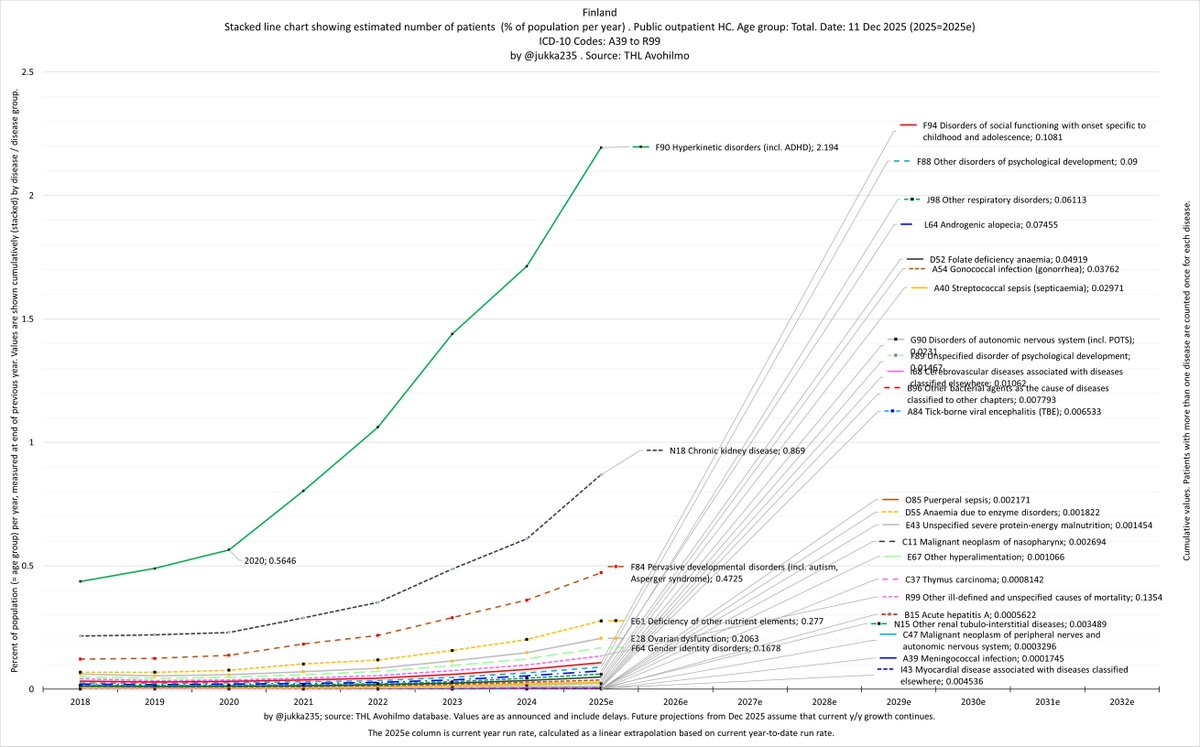
These are the most common disease groups in the total population by patient count. All of them are up, with an average rise of 47% since 2020.
12/x
12/x
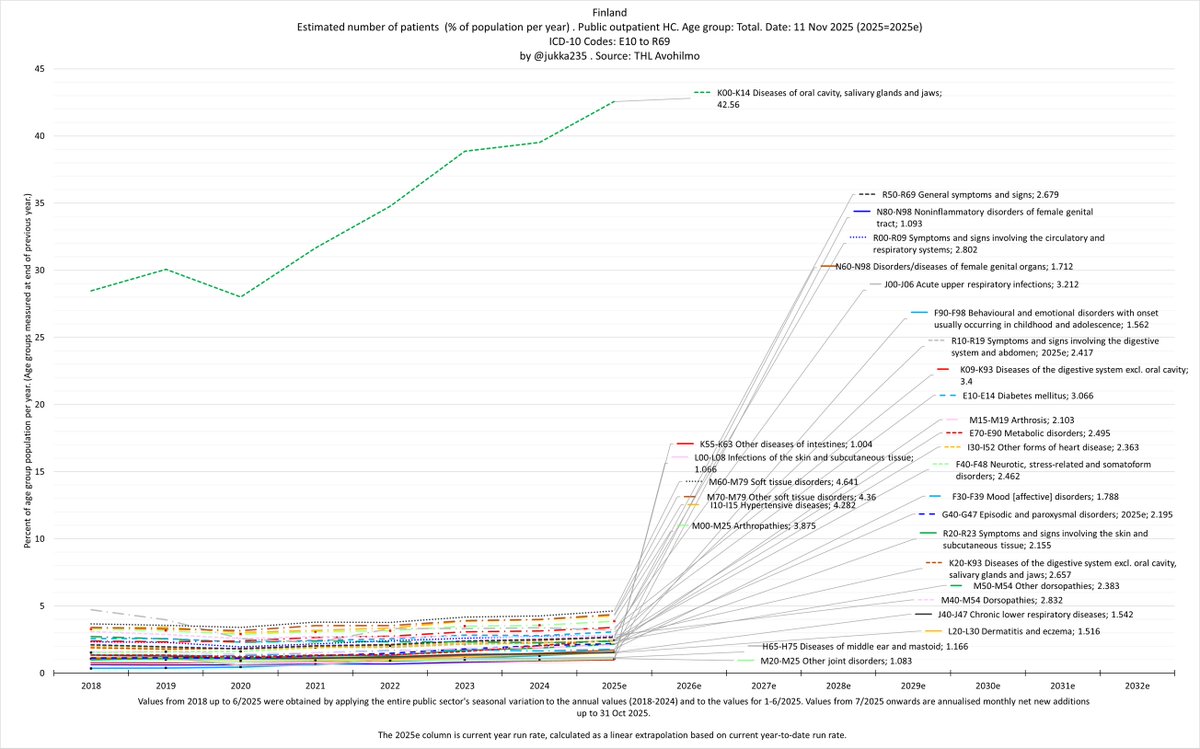
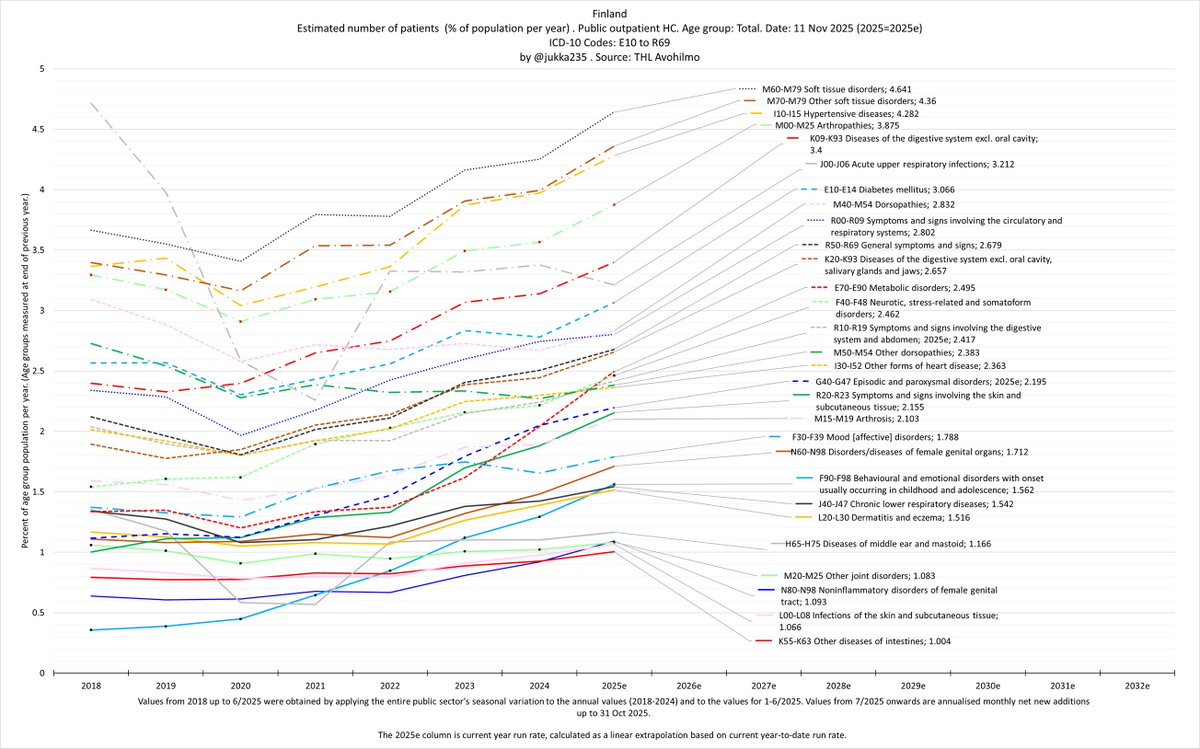
All of the top 30 most common disease groups are showing patient growth between 2020 and 2025e. Fastest growth:
- behavioural/emotional disorders (incl. ADHD) (28% per year = 10x in 9.2 years)
- metabolic disorders (15.7% per year)
- middle ear and mastoid (14.8% per year)
13/x
- behavioural/emotional disorders (incl. ADHD) (28% per year = 10x in 9.2 years)
- metabolic disorders (15.7% per year)
- middle ear and mastoid (14.8% per year)
13/x
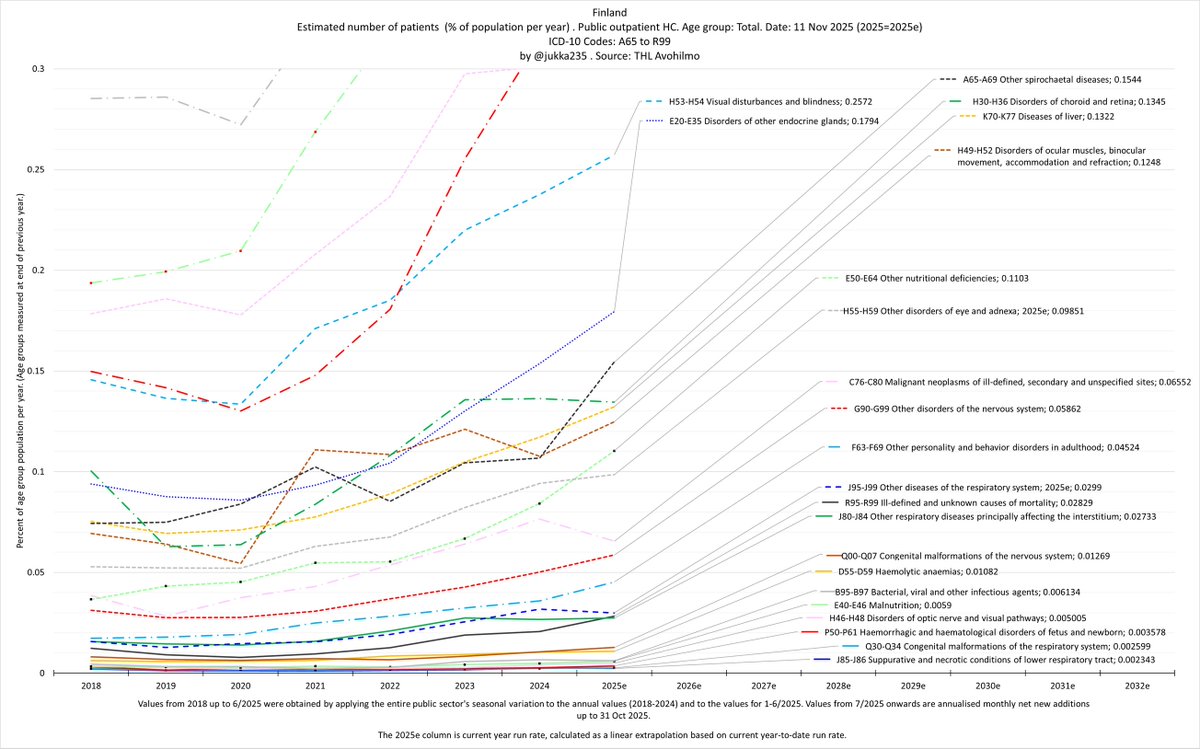
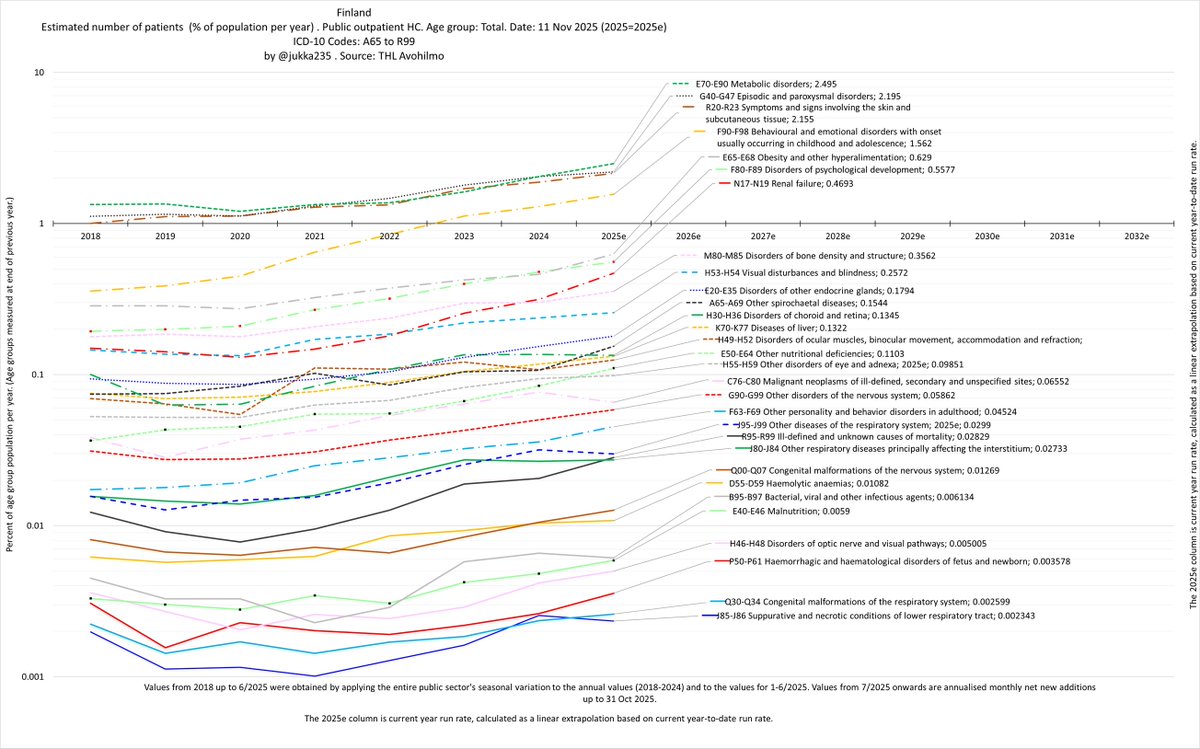
These are disease groups showing fastest patient growth in total population. Among them:
- the 2nd fastest growing disease in Finland: POTS (Postural orthostatic tachycardia syndrome, G90) in Other disorders of the nervous system (G90-G99)
14/x
- the 2nd fastest growing disease in Finland: POTS (Postural orthostatic tachycardia syndrome, G90) in Other disorders of the nervous system (G90-G99)
14/x
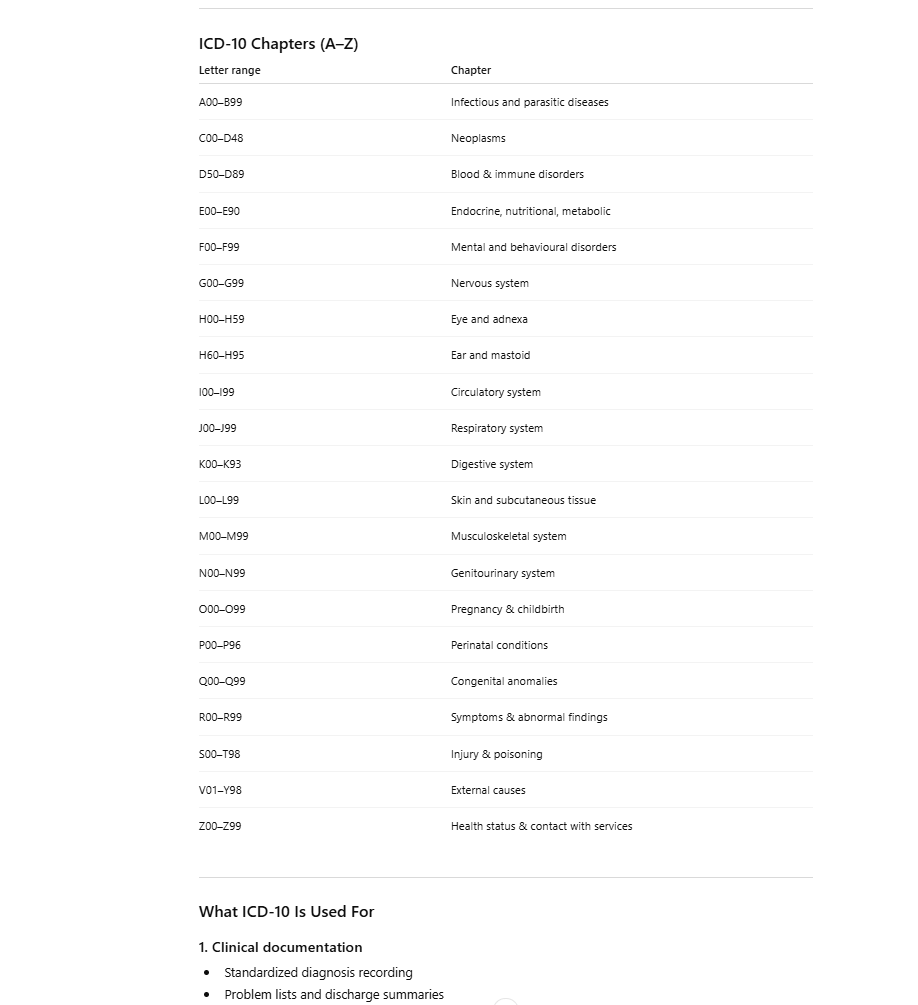
Codes A00-R99 (diseases and lab findings) = 1393 first level diseases. A00-B99 = infectious diseases.
A00-B99 Certain infectious and parasitic diseases
C00-D48 Malignant neoplasms (tumors, cancers and lymphomas)
D50-D89 Diseases of the blood and blood-forming organs and certain disorders involving the immune mechanism
E00-E90 Endocrine, nutritional and metabolic diseases
F00-F99 Mental and behavioural disorders
G00-G99 Diseases of the nervous system
H00-H59 Diseases of the eye and adnexa
H60-H95 Diseases of the ear and mastoid process
I00-I99 Diseases of the circulatory system
J00-J99 Diseases of the respiratory system
K00-K93 Diseases of the digestive system
L00-L99 Diseases of the skin and subcutaneous tissue
M00-M99 Diseases of the musculoskeletal system and connective tissue
N00-N99 Diseases of the genitourinary system
O00-O99 Pregnancy, childbirth and the puerperium
P00-P99 Certain conditions originating in the perinatal period
Q00-Q99 Congenital malformations, deformations and chromosomal abnormalities
R00-R99 Symptoms, signs and abnormal clinical and laboratory findings, not elsewhere classified
@suzyg001 Found it.
pxdata.stat.fi/PxWeb/pxweb/fi…
pxdata.stat.fi/PxWeb/pxweb/fi…
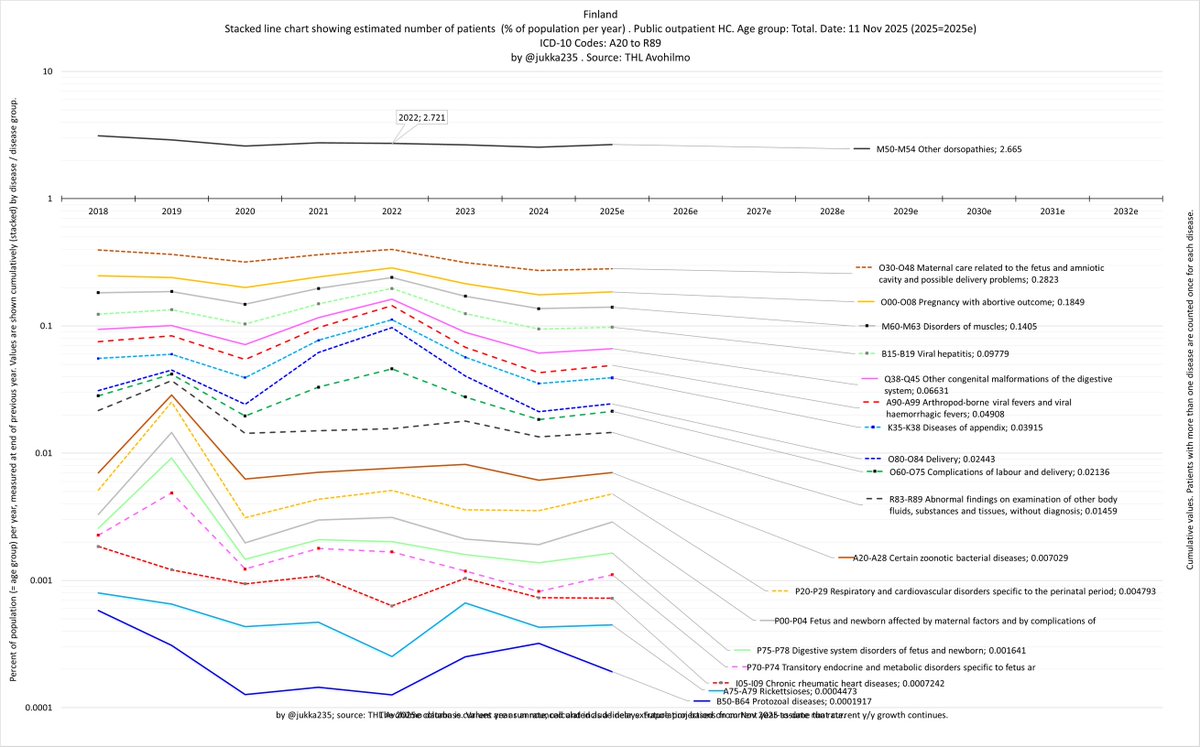
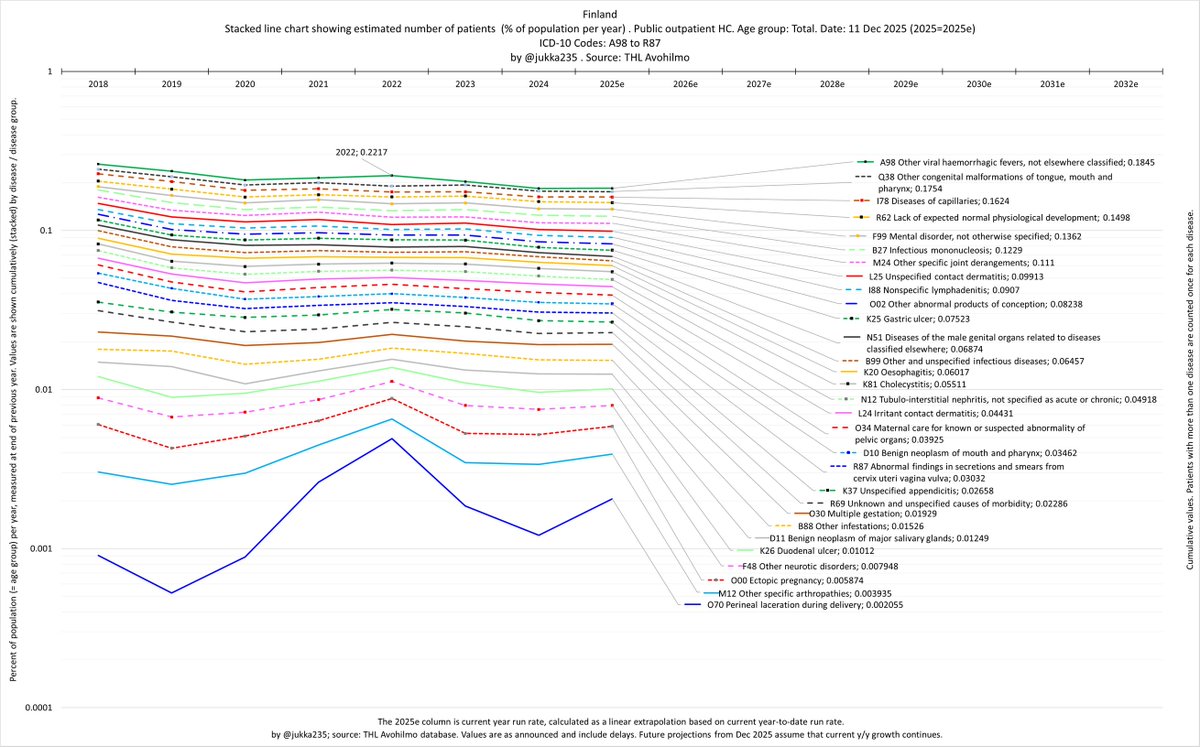
On balance, these are all 2nd level disease groups showing negative patient growth in 2025e vs. 2019-2022 average. The average rate of growth is power(2.665/2.721;1/3) = -0.7% per year.
15/x
15/x
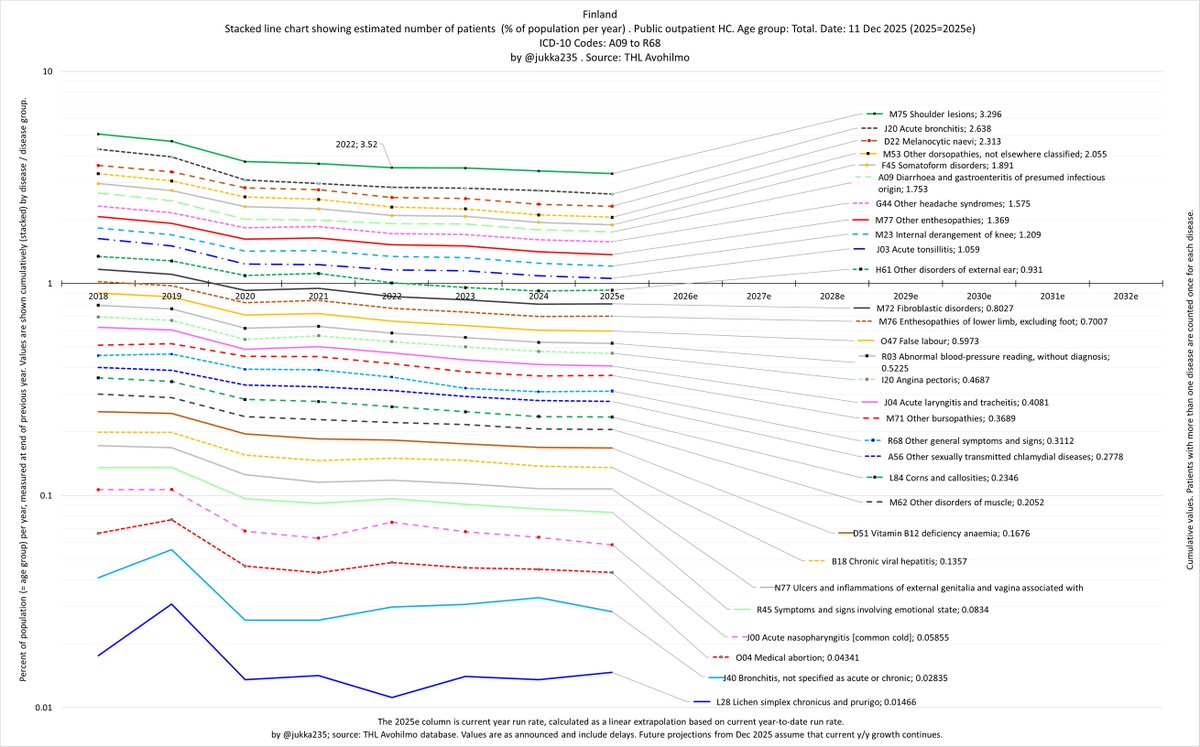
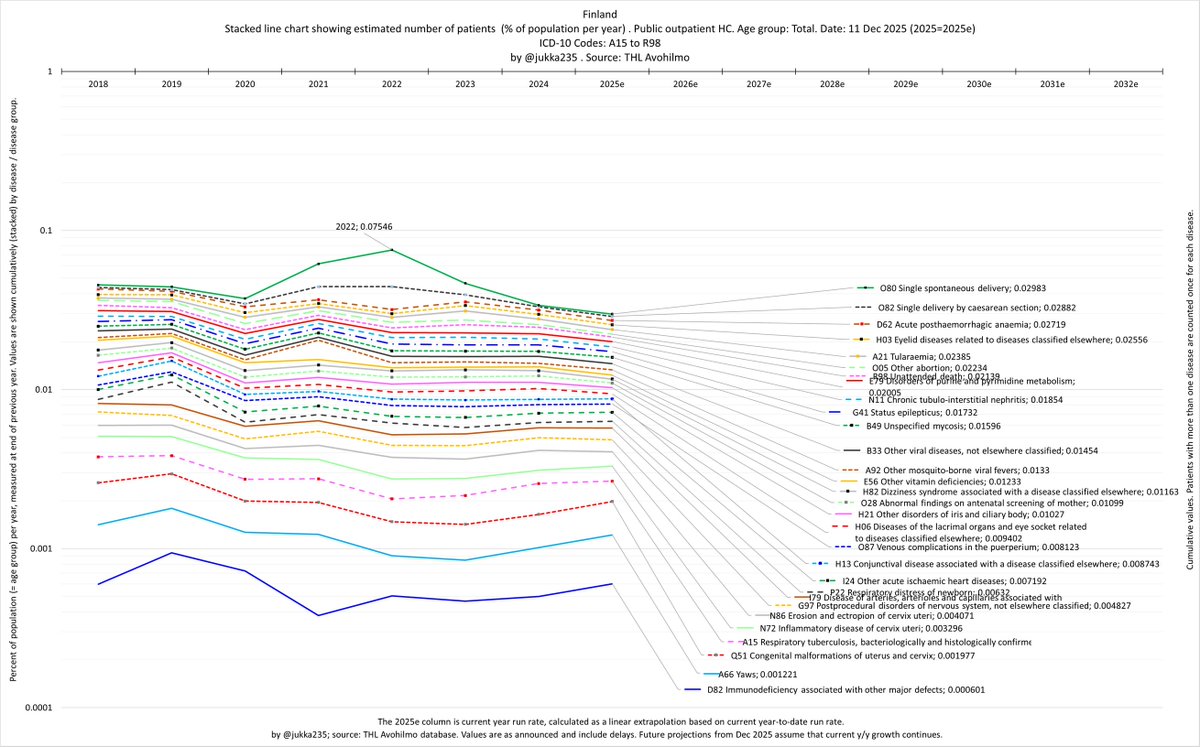
Here are the top 90 diseases and conditions (94% of all patients) with negative patient growth between 2022 and 2025e. In some cases the decline is due to changes in how certain diseases are coded (e.g., haemorrhoids were moved from I84 to K64, etc.).
16/x
16/x
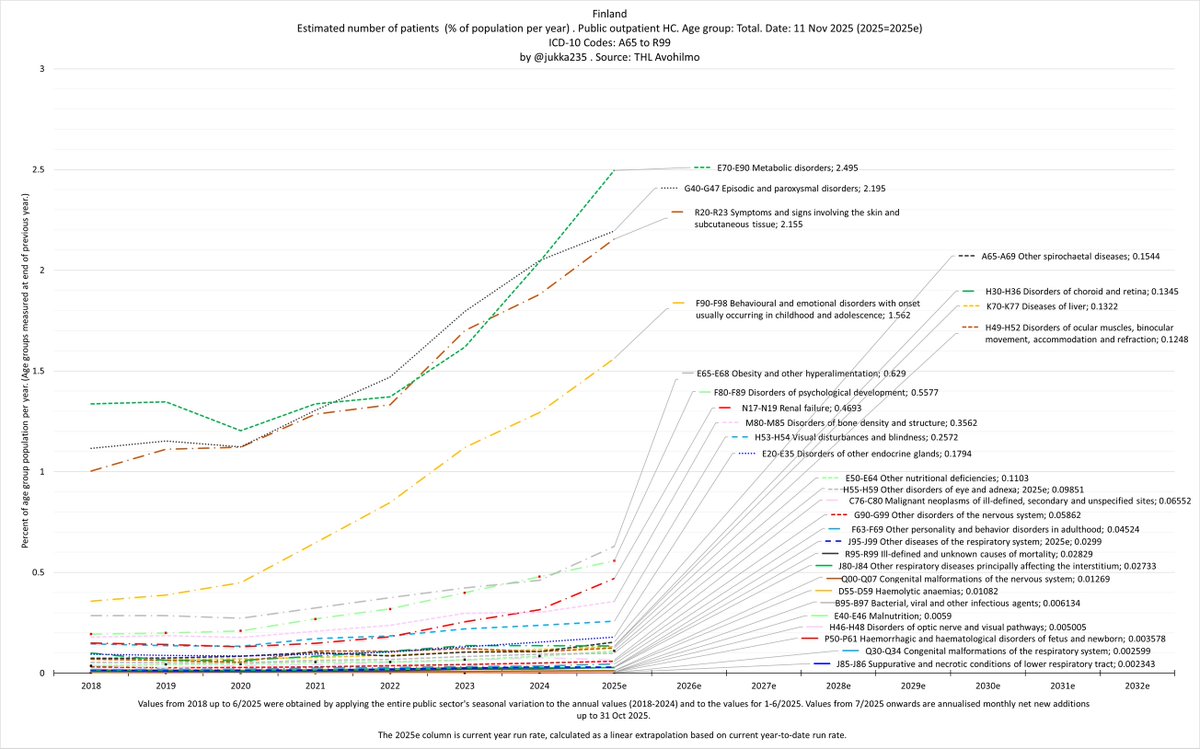
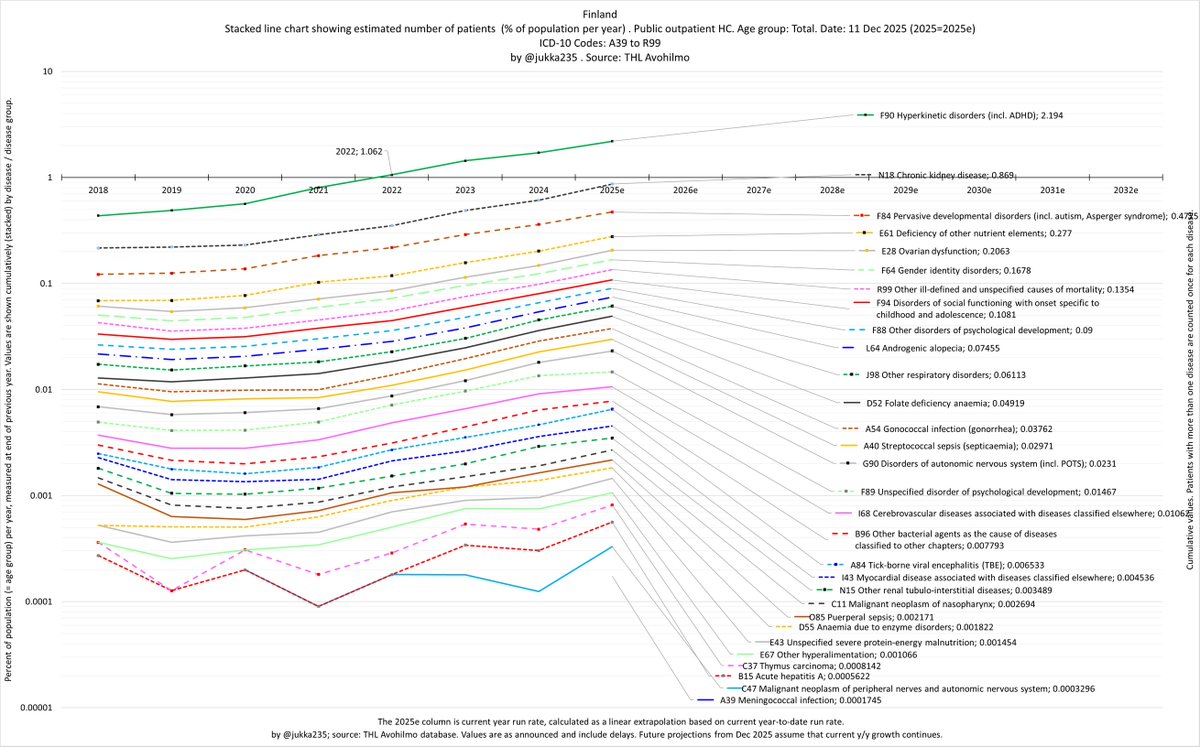
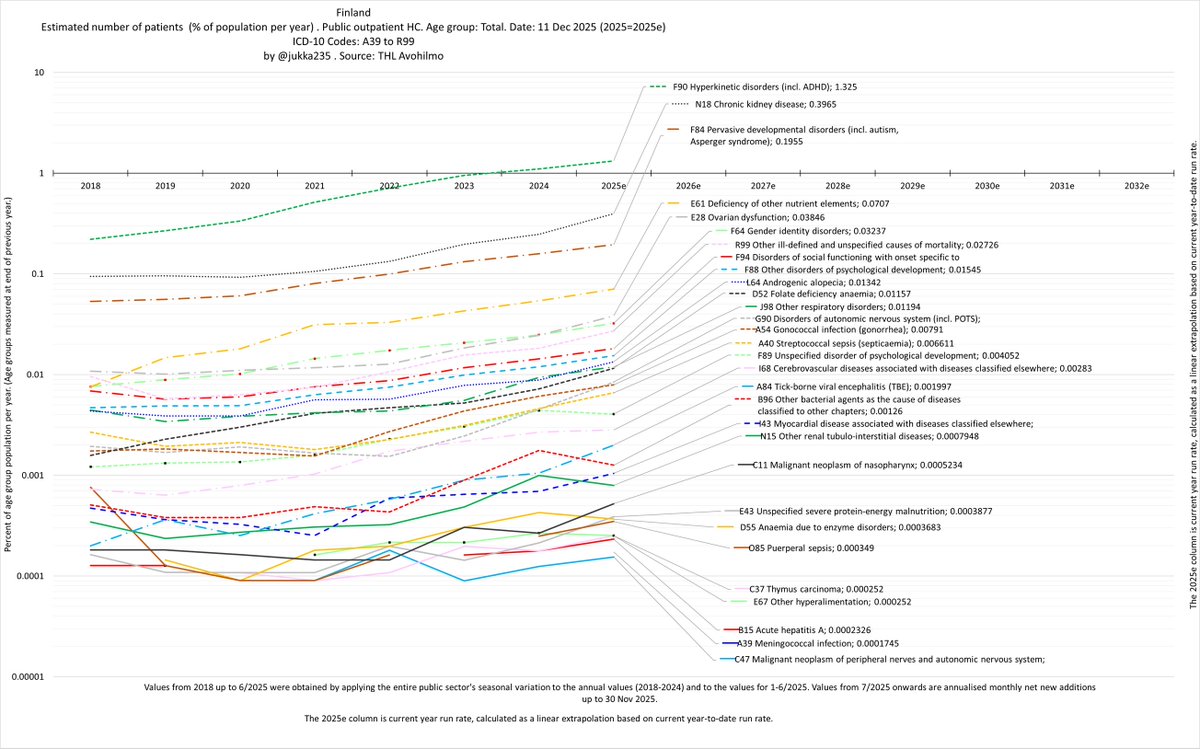
Here are the diseases and conditions showing fastest patient growth (2020-2025e). Combined patient count is up 3.9 times from 2020, an annual growth of 31% , or up 10 times in ln(10)/ln(1.311) = 8.5 years.
17/x
17/x
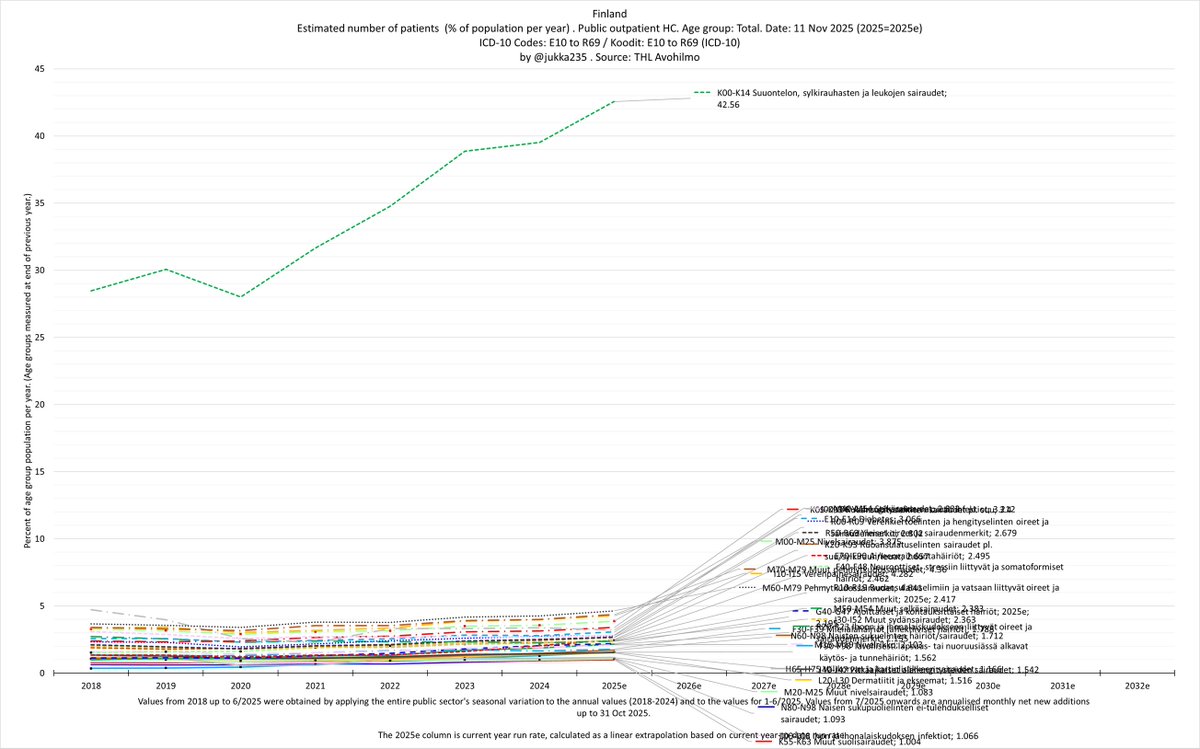
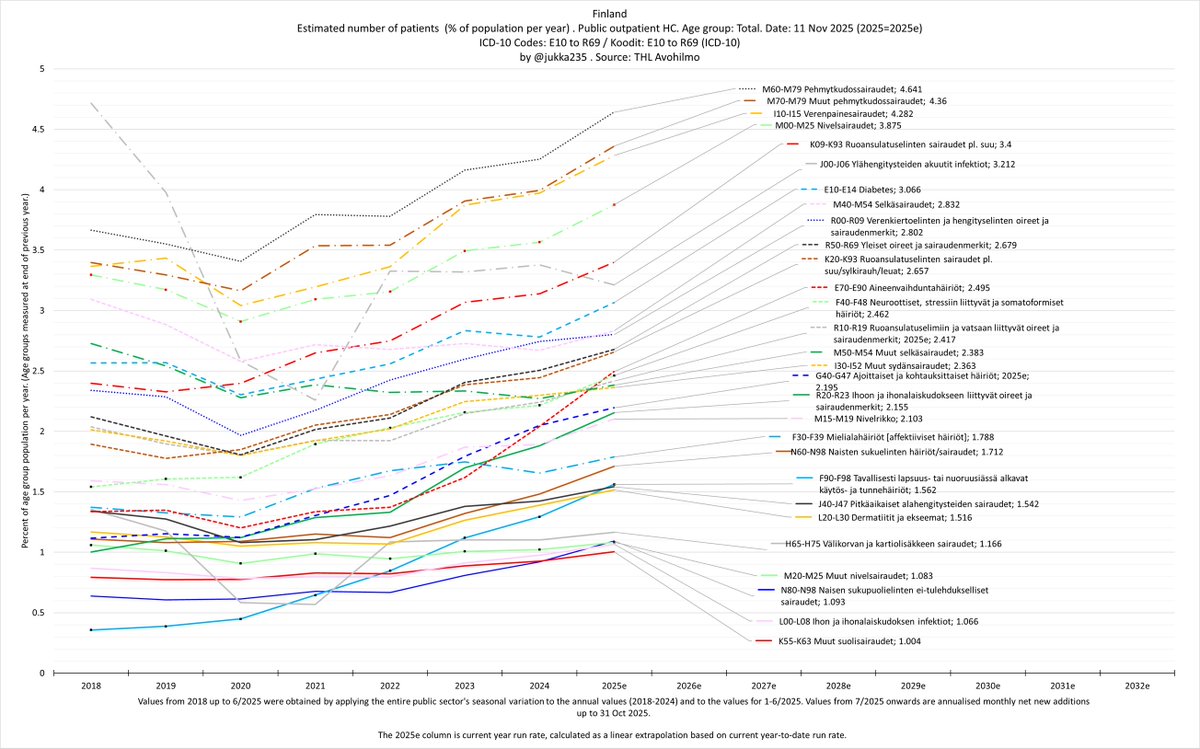
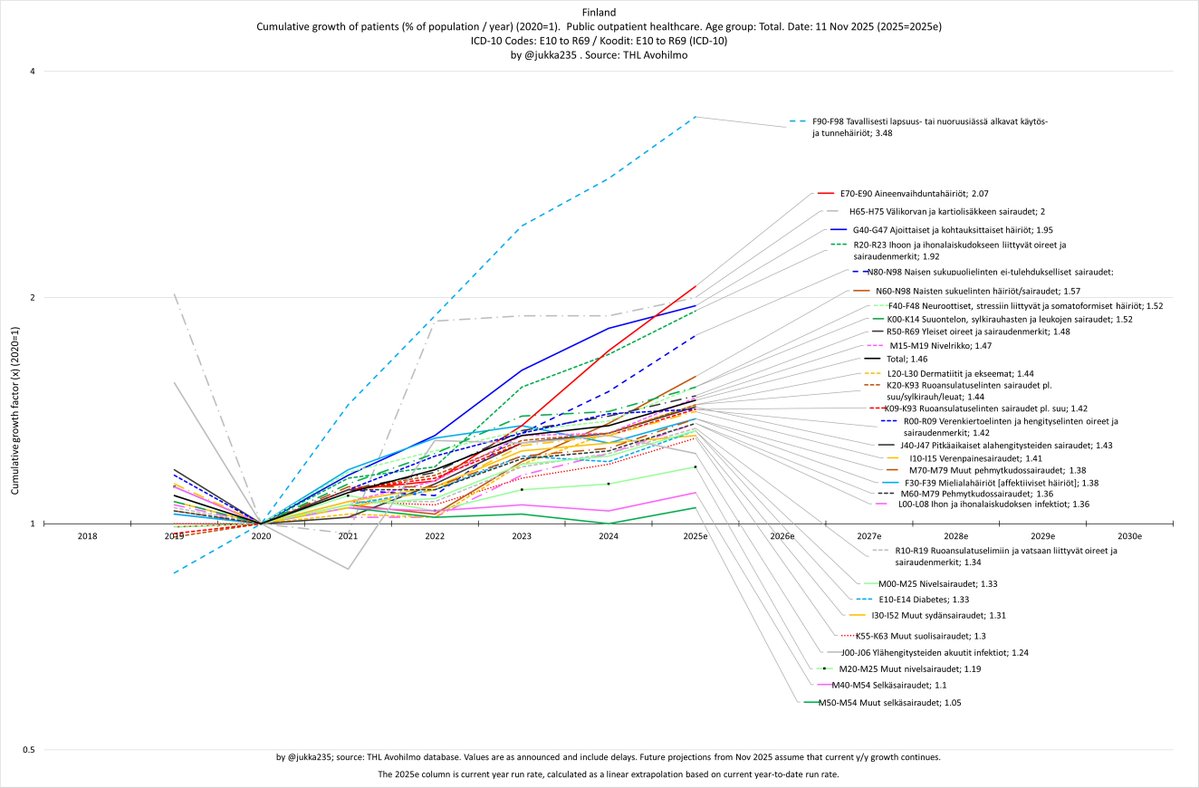
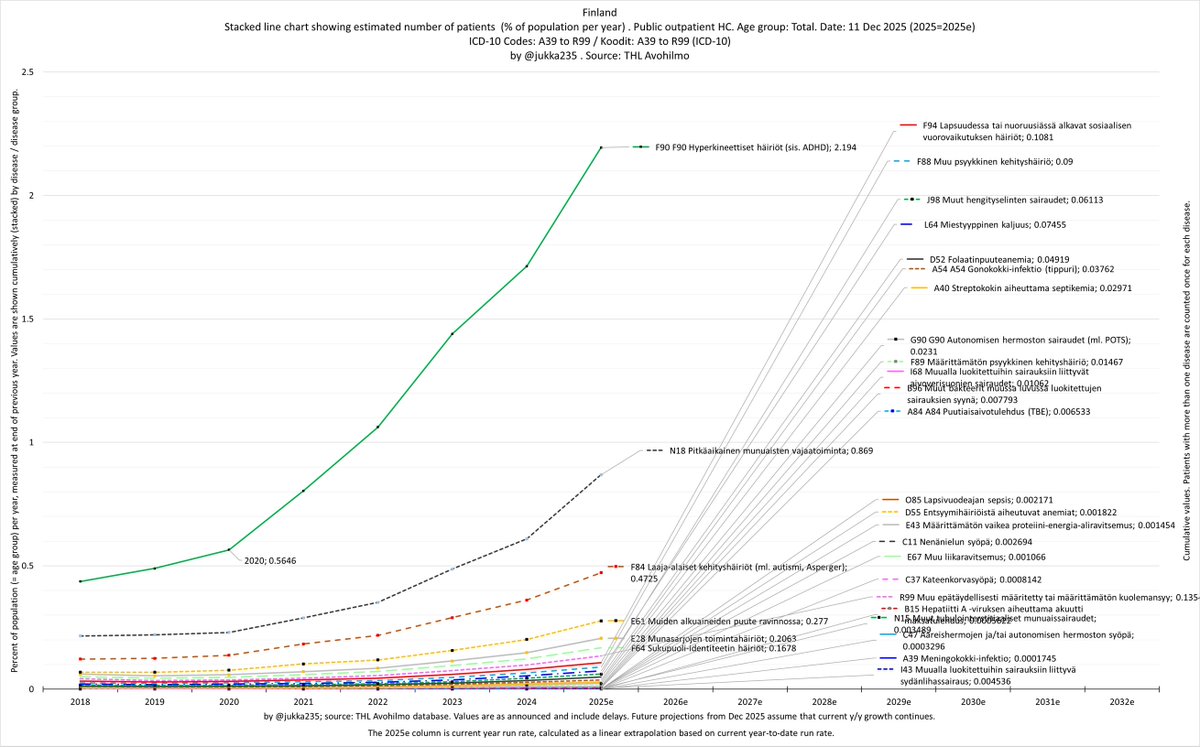
Same graphs in Finnish.
18/x
18/x

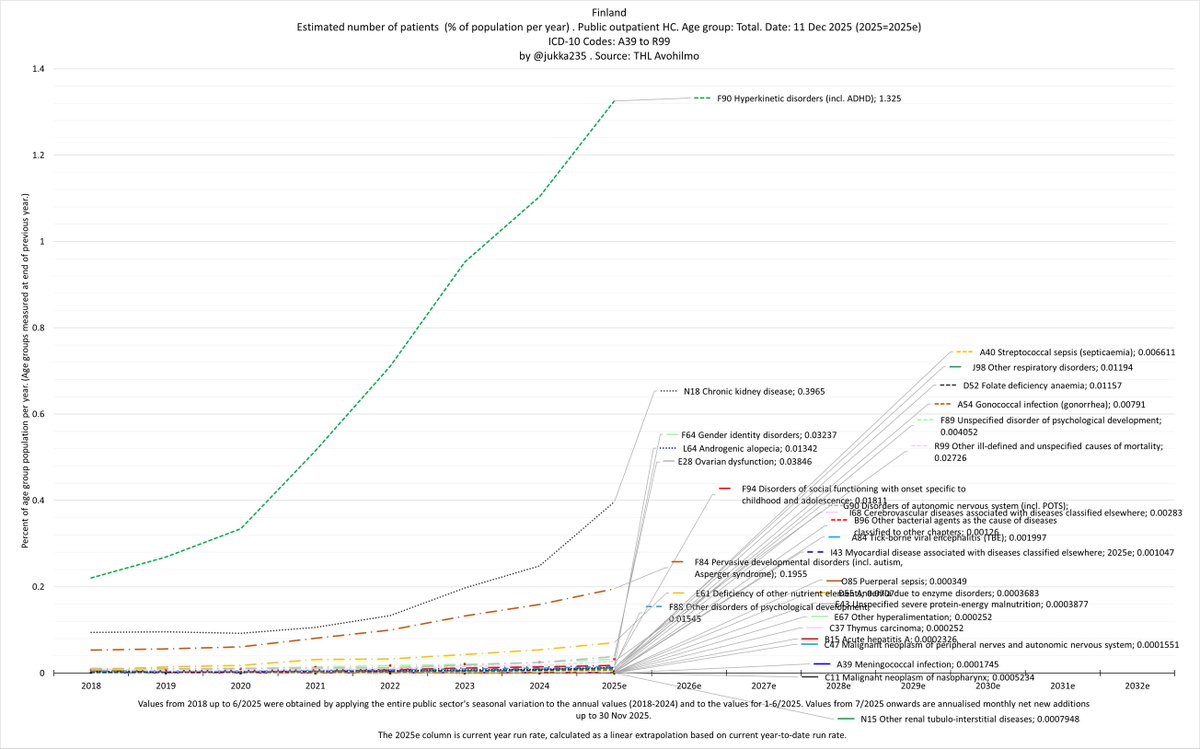
Average monthly hospital admissions due to respiratory tract infections have increased throughout the epidemic in all age groups 5–49, with the fastest growth among 5-14 year olds, the least vaccinated age group against C19. Specialty hospital care (one level below ICU).
19/x
19/x

• • •
Missing some Tweet in this thread? You can try to
force a refresh