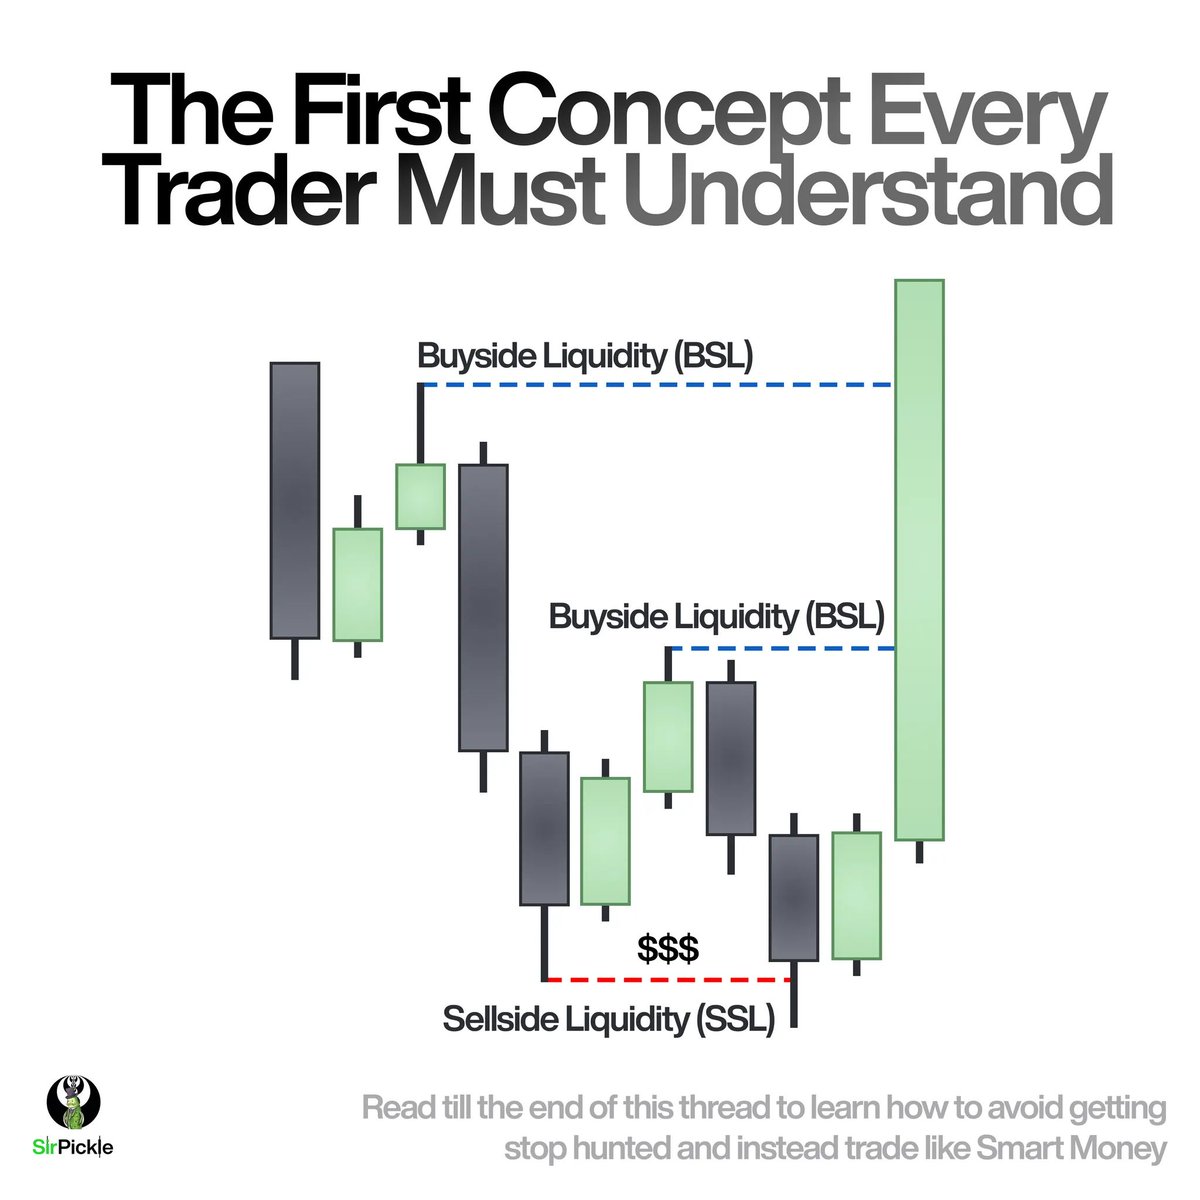
The First Concept EVERY Trader Must Understand…
This is LITERALLY the reason why the market moves the way it does.
If you dont know what and where liquidity is, you are the liquidity.
Read till the end of this thread to learn how to avoid getting stop hunted and instead trade like Smart Money
A thread🧵
This is LITERALLY the reason why the market moves the way it does.
If you dont know what and where liquidity is, you are the liquidity.
Read till the end of this thread to learn how to avoid getting stop hunted and instead trade like Smart Money
A thread🧵
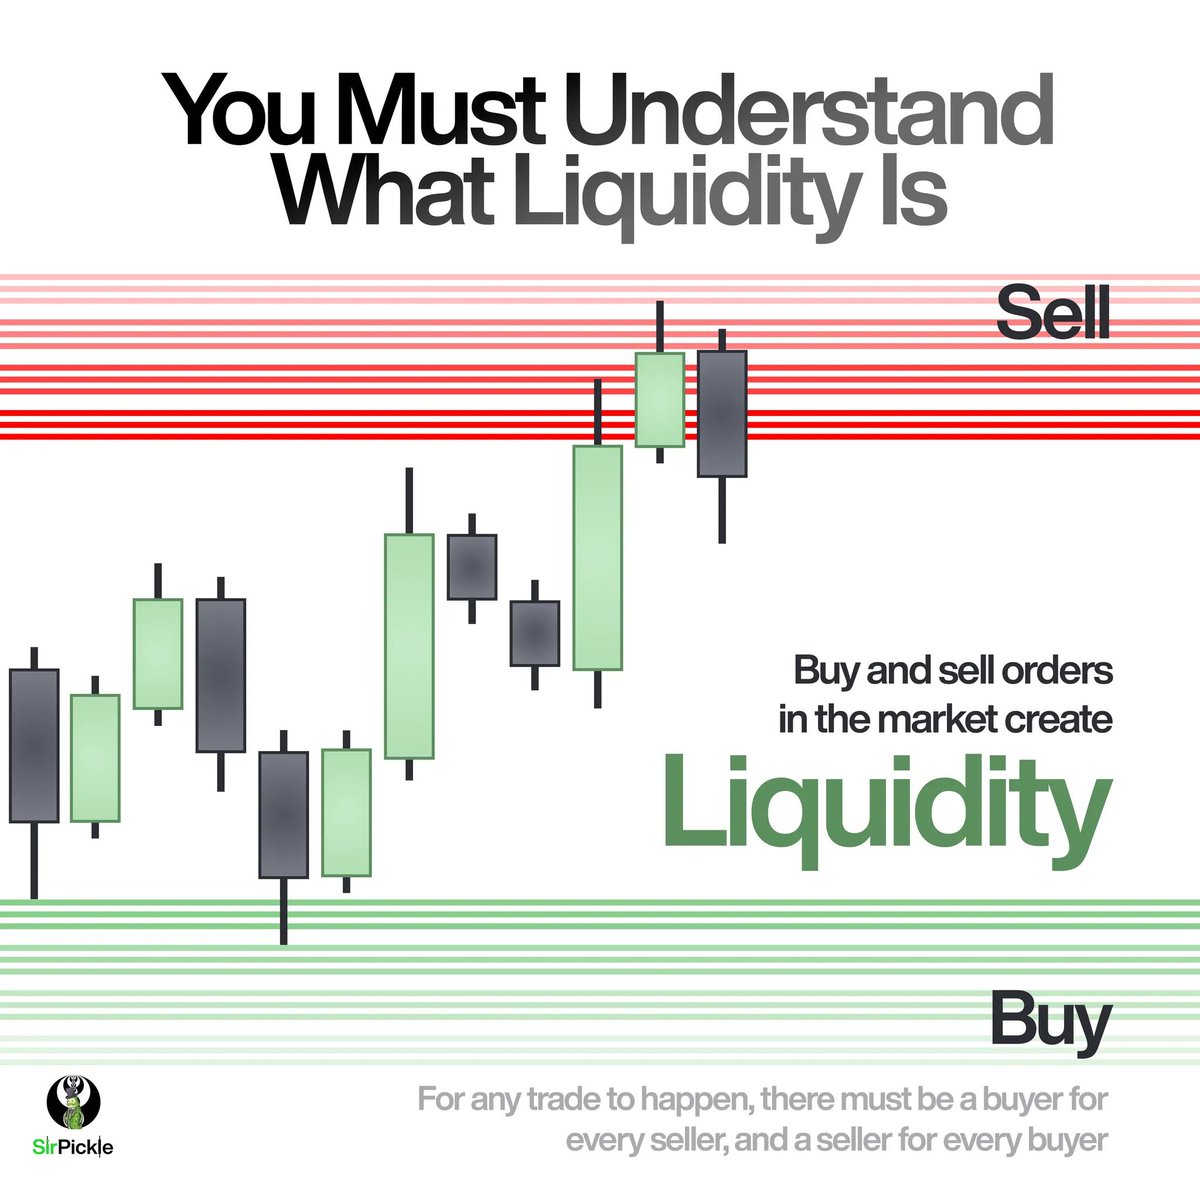
First, You Must Understand What Liquidity Is…
Simply put, liquidity is created by all the buy and sell orders in the market.
Every single market participant places orders, and together, creates liquidity.
For any trade to happen, there must be a buyer for every seller, and a seller for every buyer.
Simply put, liquidity is created by all the buy and sell orders in the market.
Every single market participant places orders, and together, creates liquidity.
For any trade to happen, there must be a buyer for every seller, and a seller for every buyer.
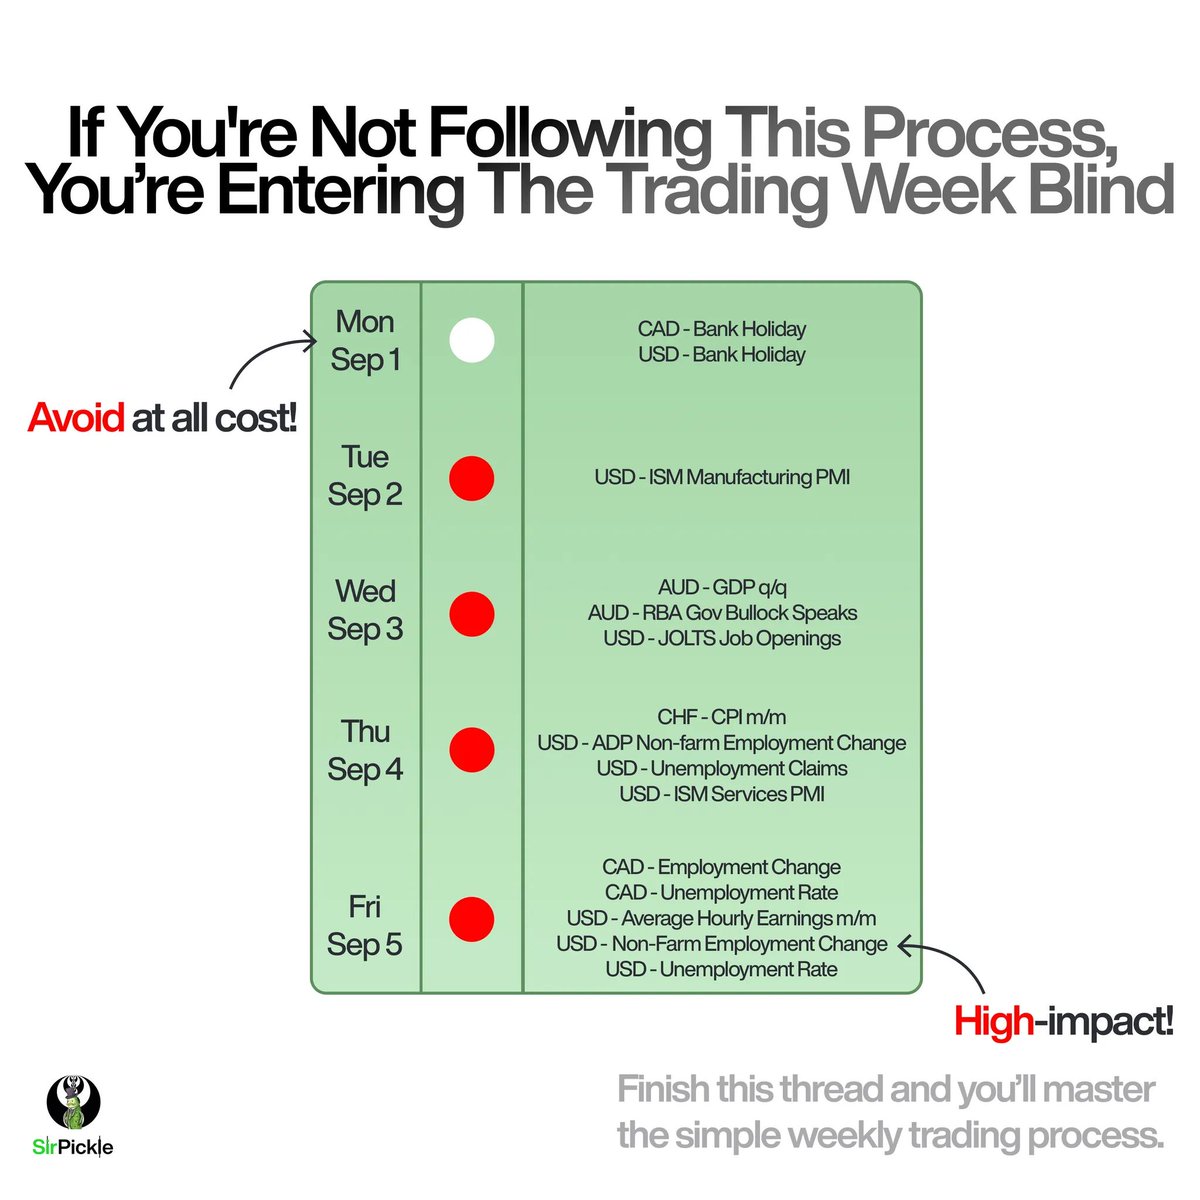
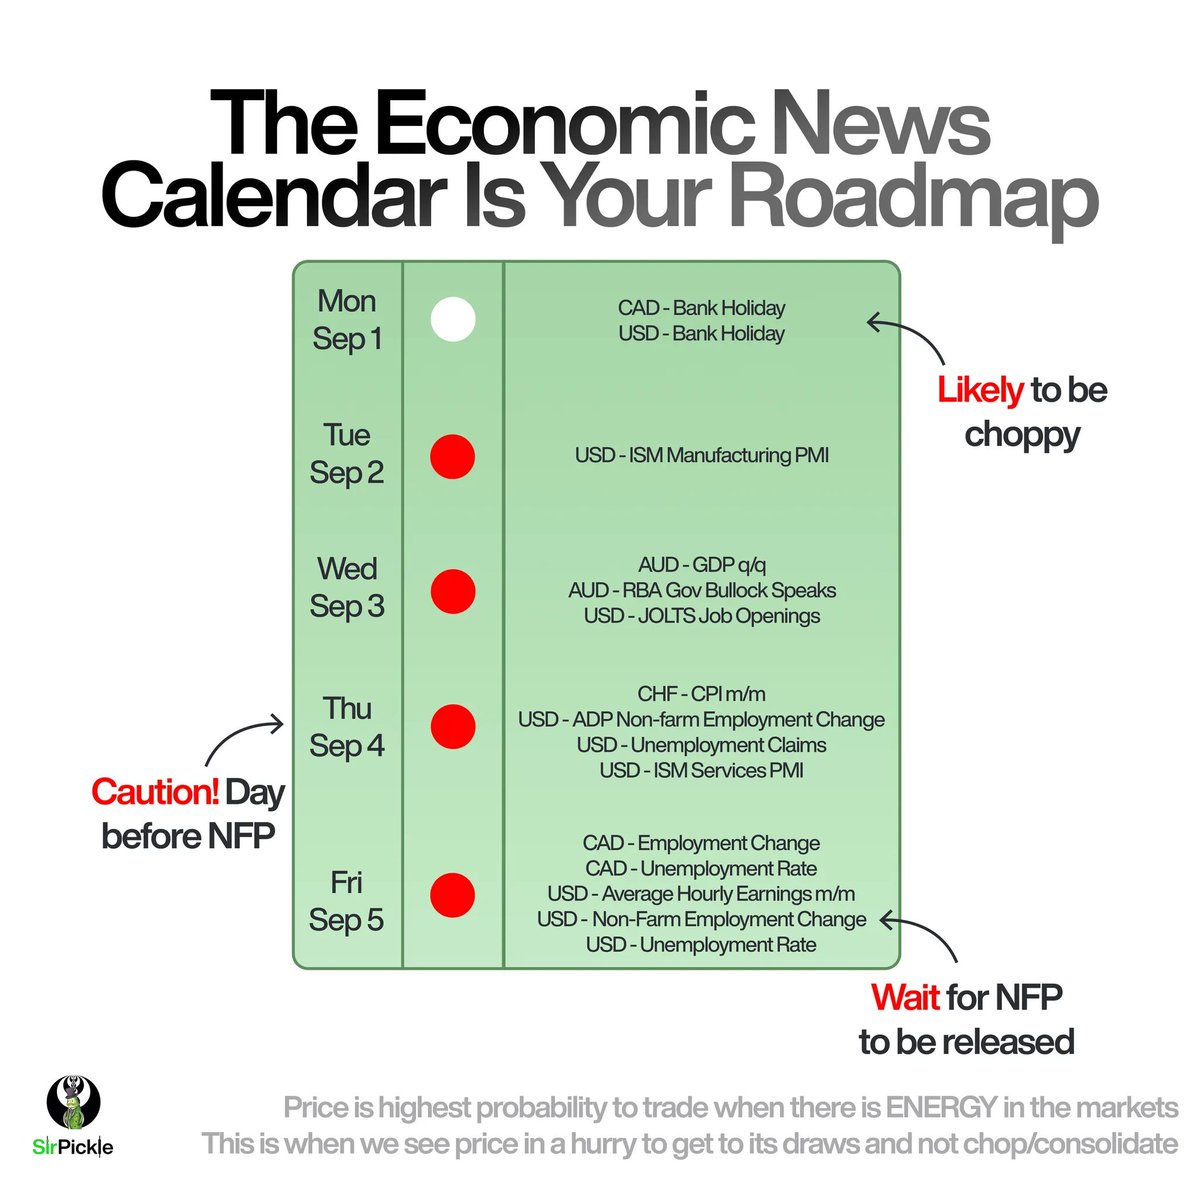
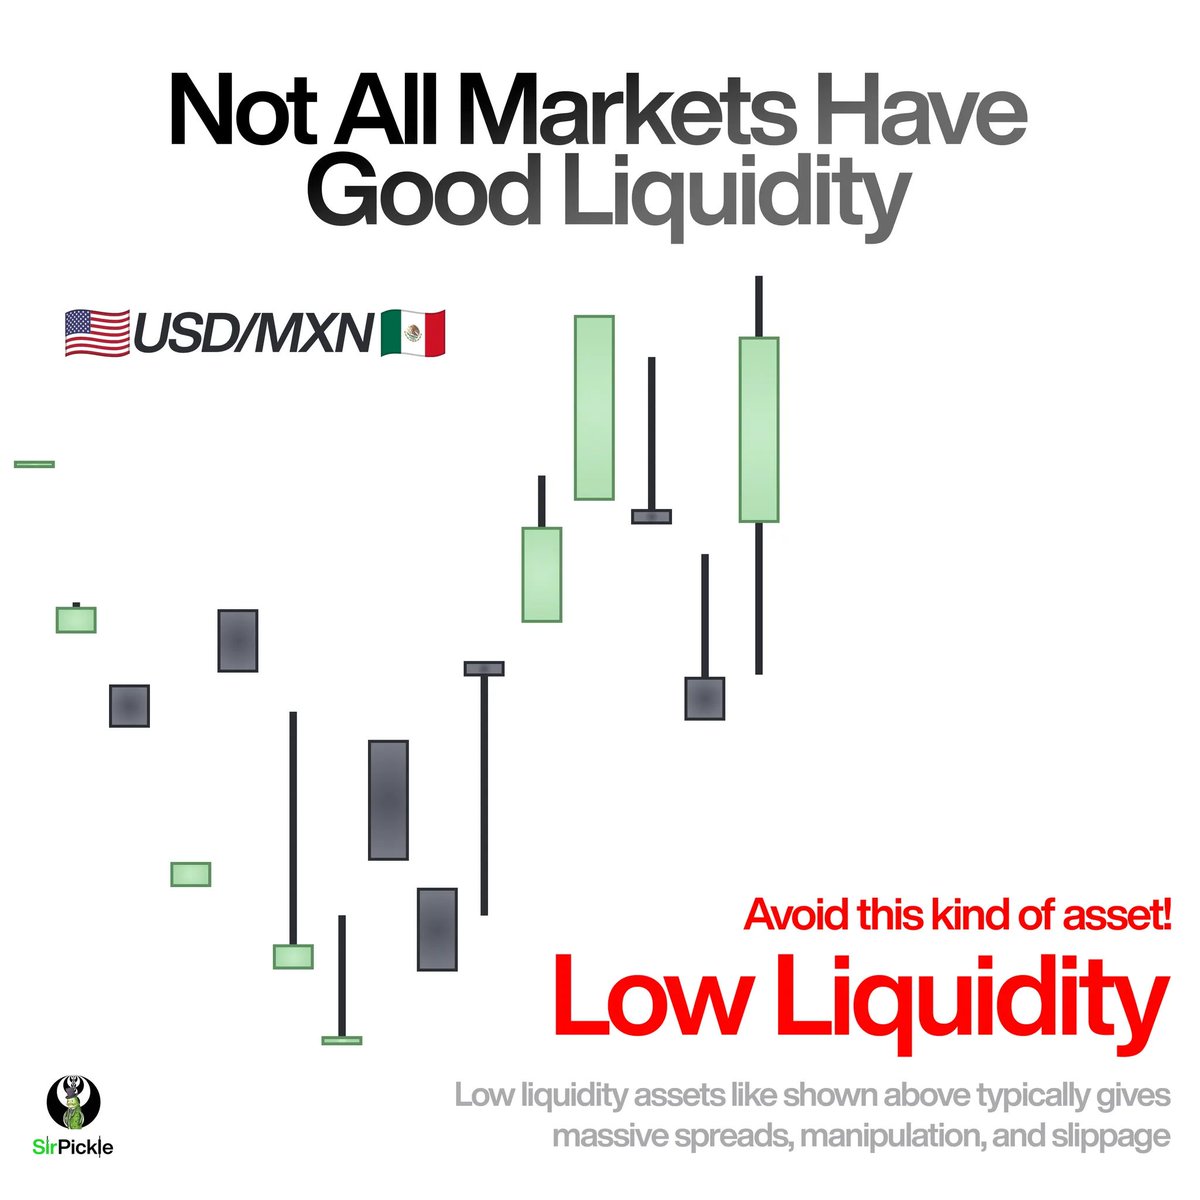
Not All Markets Have Good Liquidity
Markets that are smooth, with lots of traders and clear price action typically means that it has high liquidity. An example of this is major Forex pairs like EUR/USD and stock indices like ES & NQ.
Opposite to this is low liquidity wherein the markets that are choppy, with sudden jumps and gaps because only a few people are trading them. Think of exotic Forex pairs like USD/MXN or tiny penny stocks.
You want to focus on high liquidity markets because this avoids massive spreads, manipulation, and slippage. Simply put: BAD PRICE ACTION.
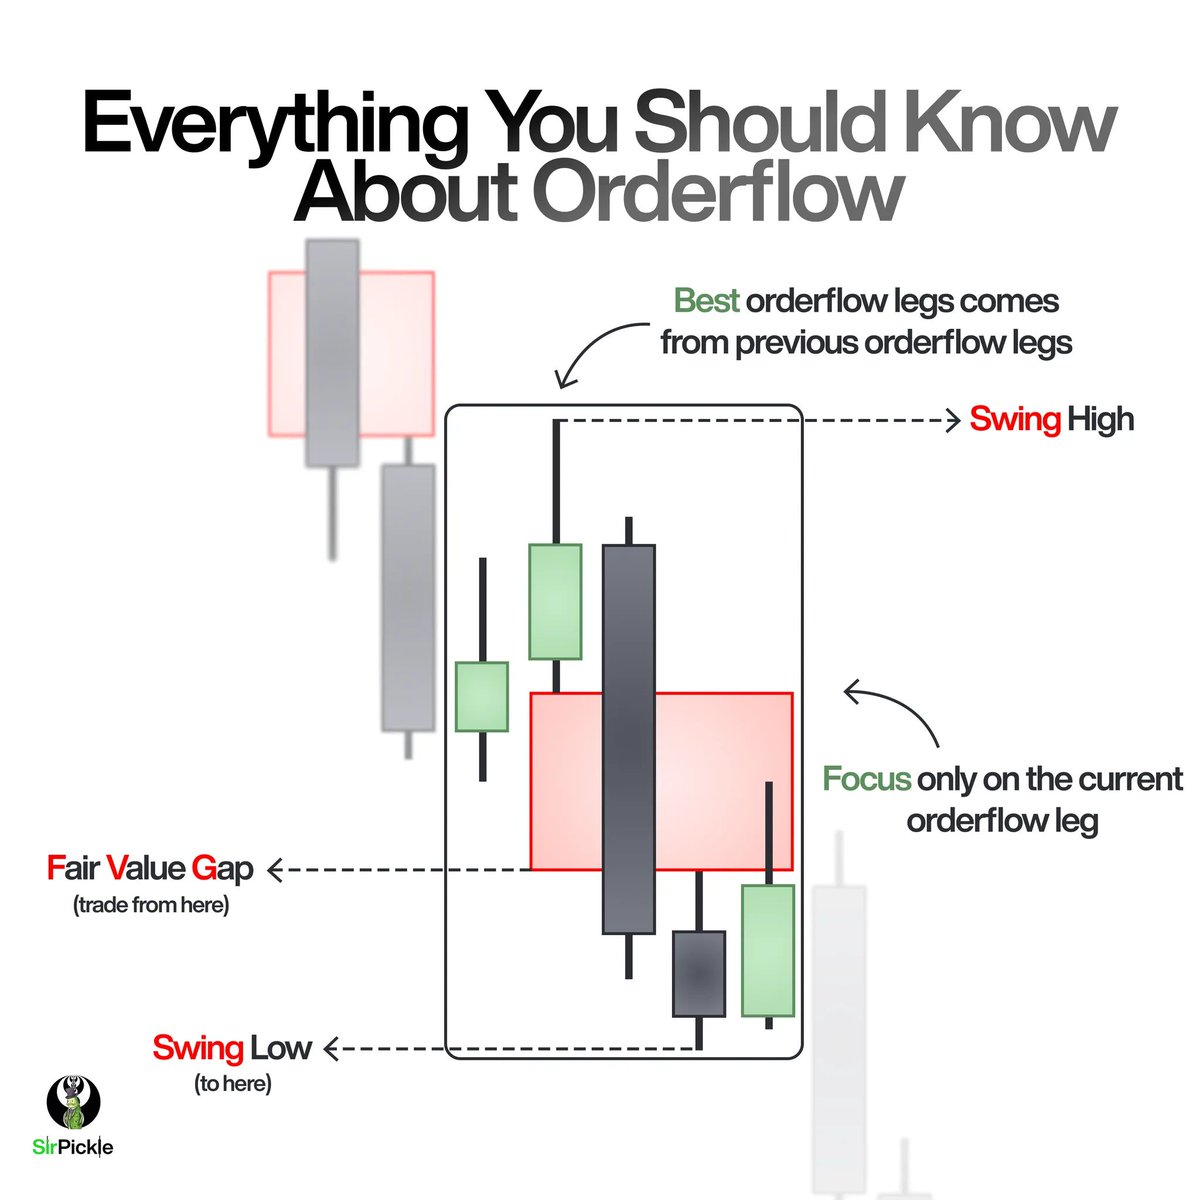
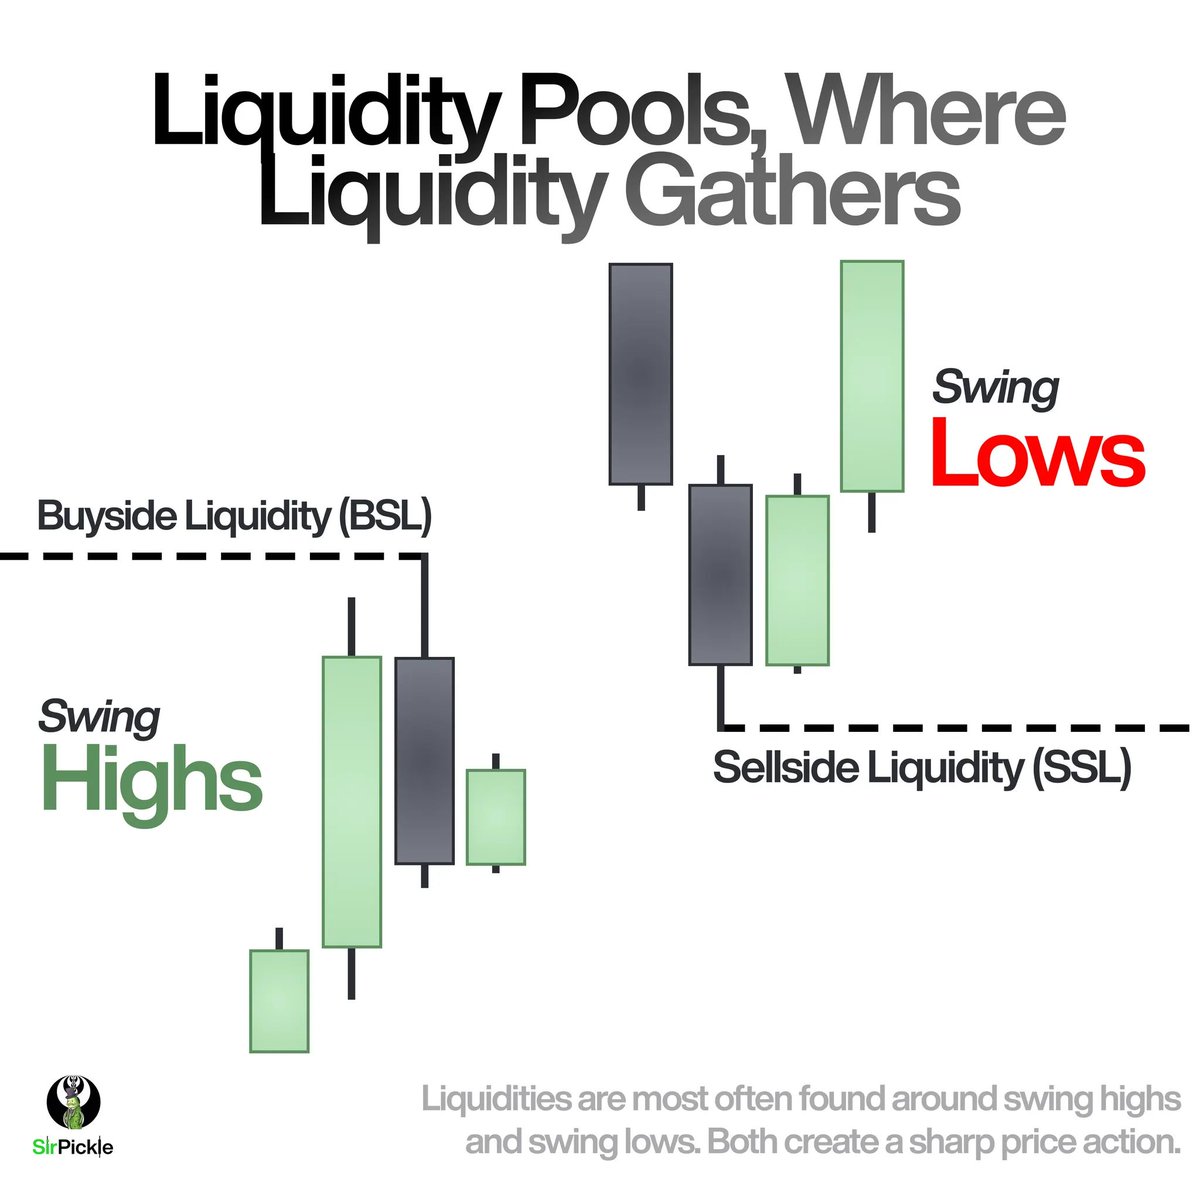
Liquidity Pools, Where Liquidity Gathers.
While liquidity is everywhere, it forms “pools” in specific areas. These liquidity pools are were a LARGE number of buy and sell orders are clustered.
They are most often found around swing highs and swing lows.
- A swing high is a candle with a candle lower to either side
- A swing low is a candle with a candle higher to either side
Both create a sharp point in price action.
If you put a baby in front of a chart they would likely point here.
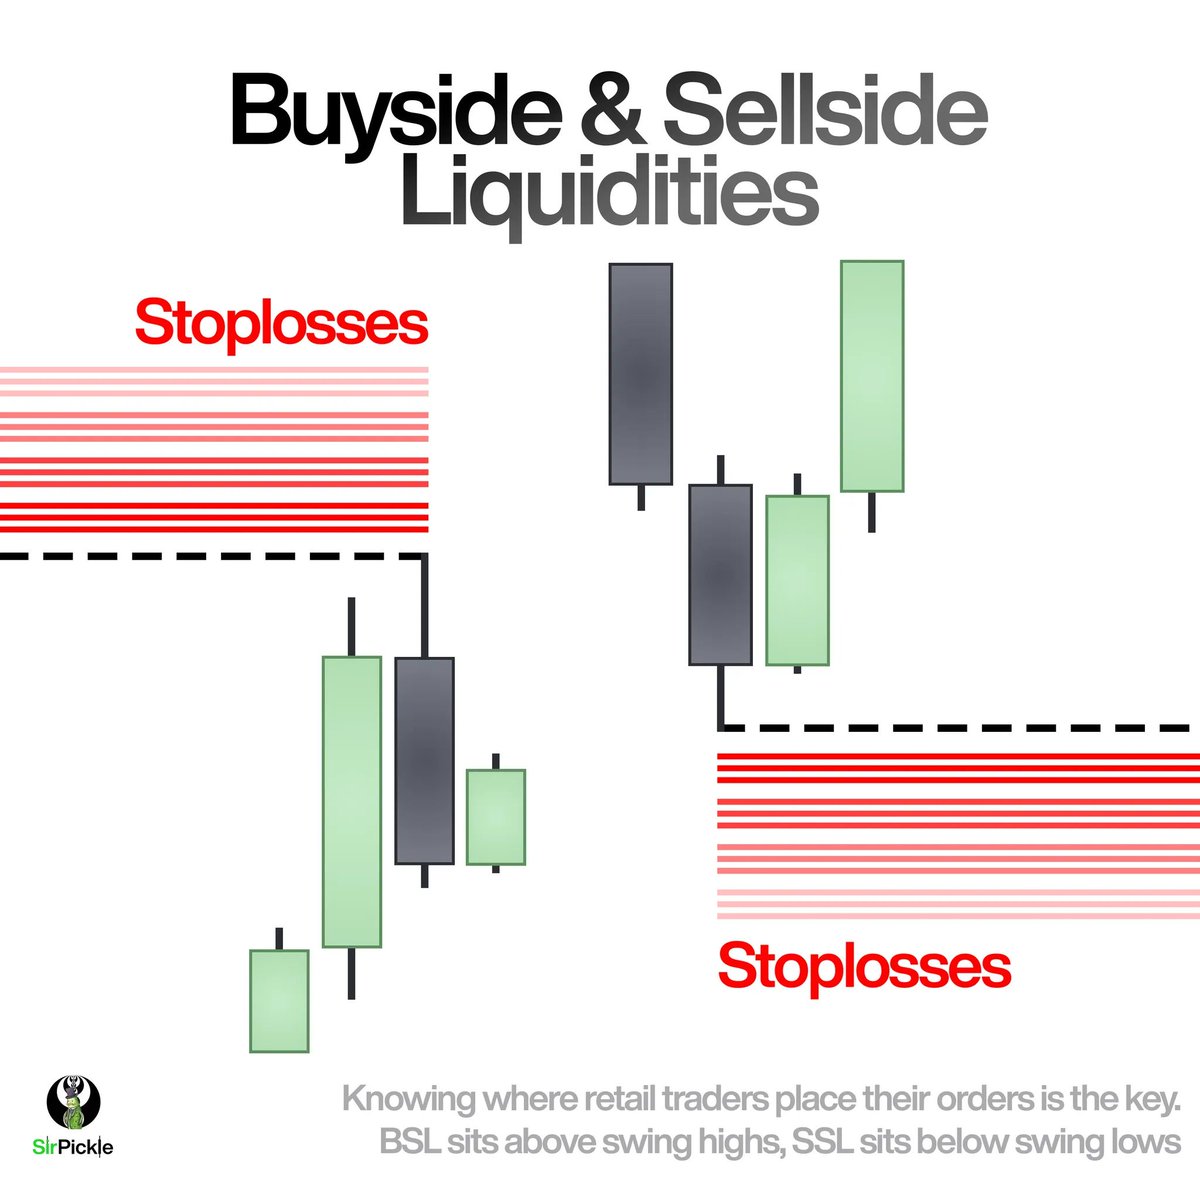
Buyside & Sellside Liquidities
Knowing where retail traders place their orders is the key.
Buyside Liquidities (BSL) sits above swing highs. This is where traders typically place their buy stops leading to the creation of a cluster of buy stops.
Sellside Liquidities (SSL) sits below swing lows. Opposite to BSL, this is where typically traders place their sell stops which leads to the creation of a cluster of sell stops.
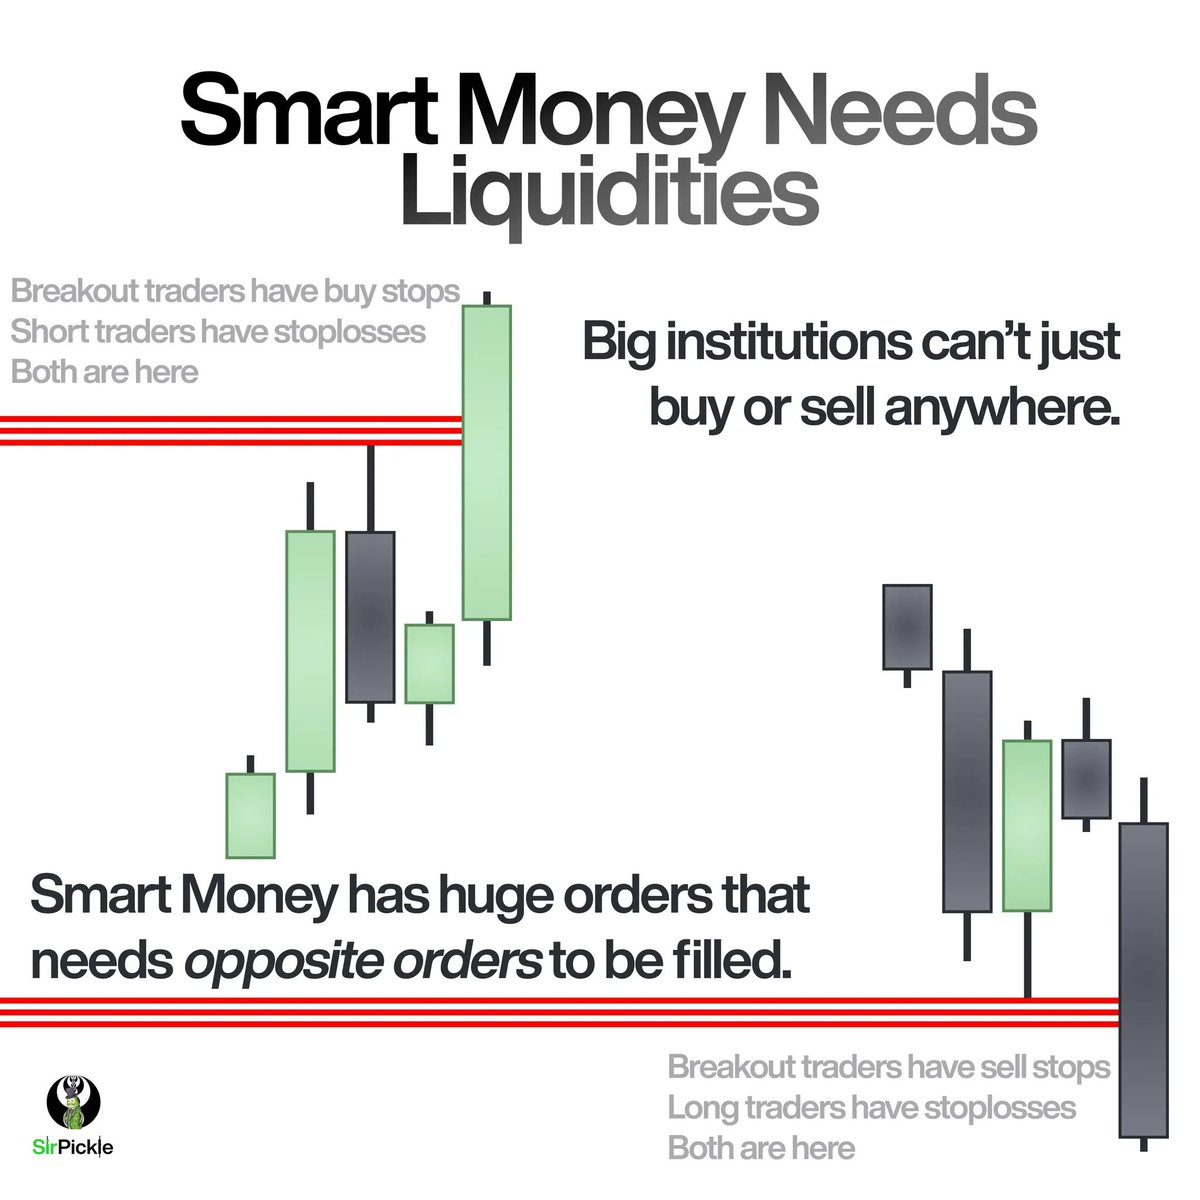
Smart Money Needs Liquidity
Big institutions can’t just buy or sell anywhere. Their huge orders need enough opposite orders to be filled.
When Smart Money is bullish, they will often seek to BUY below an old swing low.
Why? To trigger all the sell stops waiting there, allowing them to accumulate huge buy positions. Opposite is true when they are bearish.
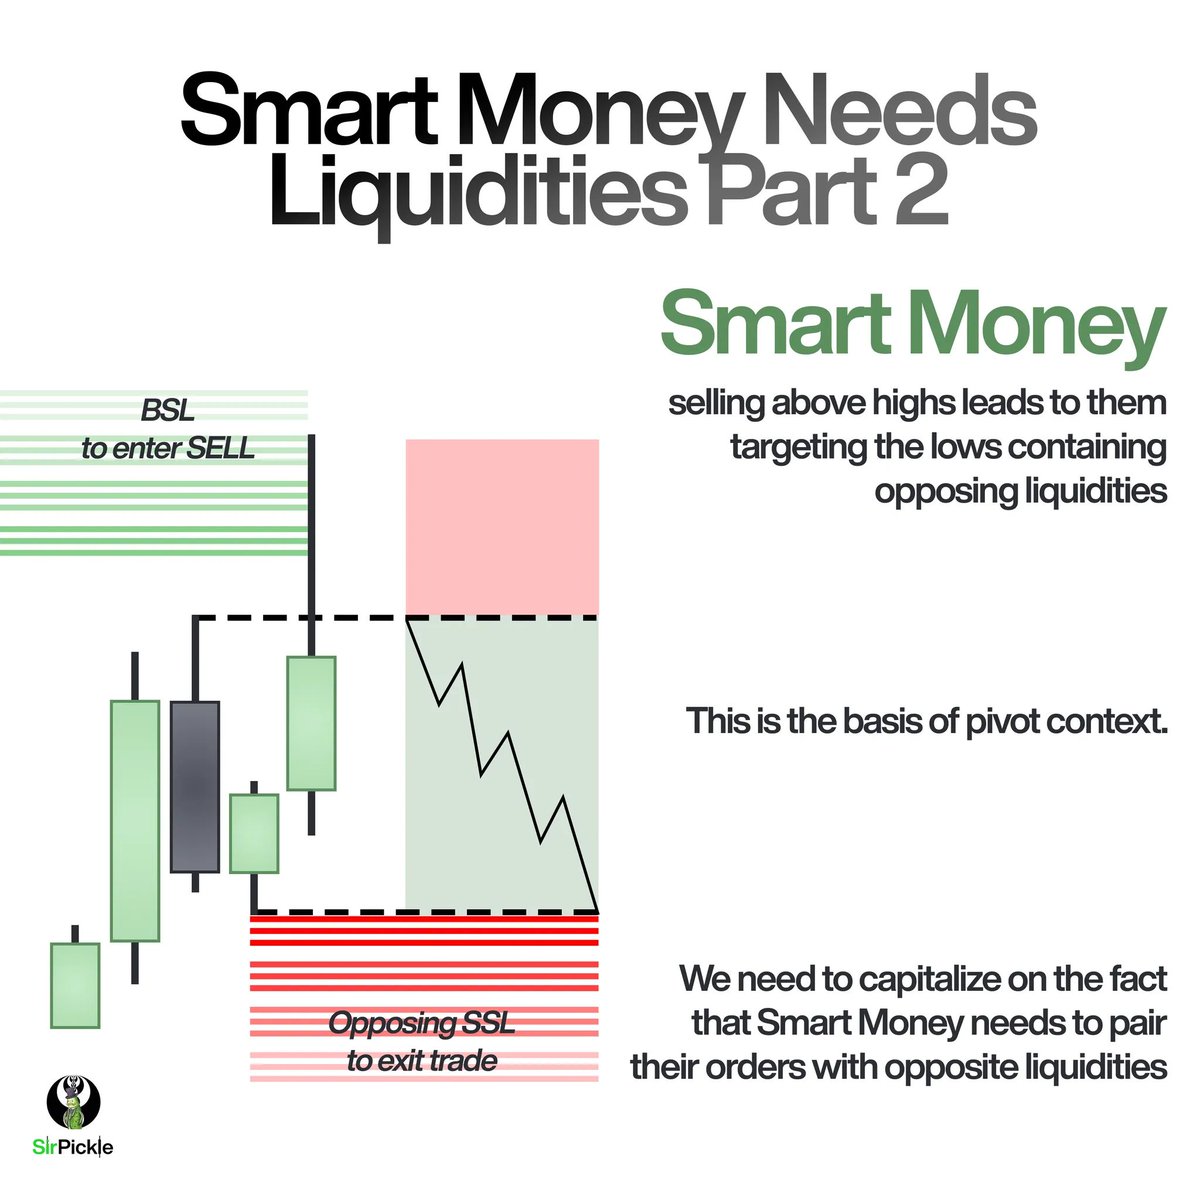
Smart Money Needs Liquidity Part 2
After accumulating their positions, Smart Money needs to offload them for profit.
If smart money bought below lows, they will target buyside liquidity above old highs. They sell their positions into the buy orders waiting there. And of course, opposite is true if smart money sold above highs.
This is the basis of pivot context.
We need to capitalize on the fact that Smart Money needs to pair their orders with opposite liquidities.
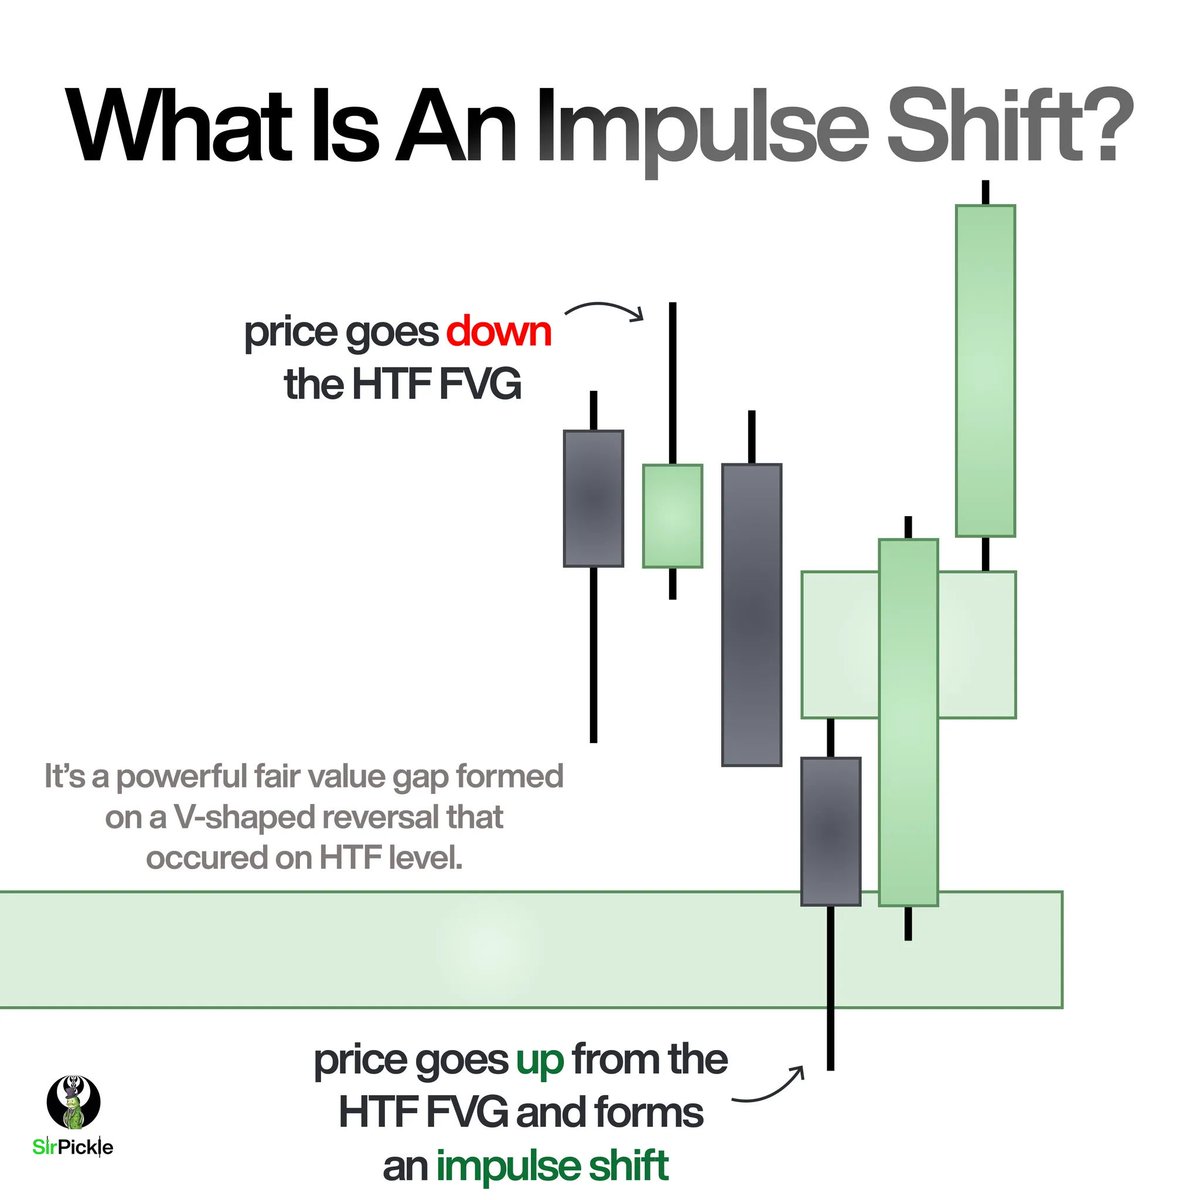
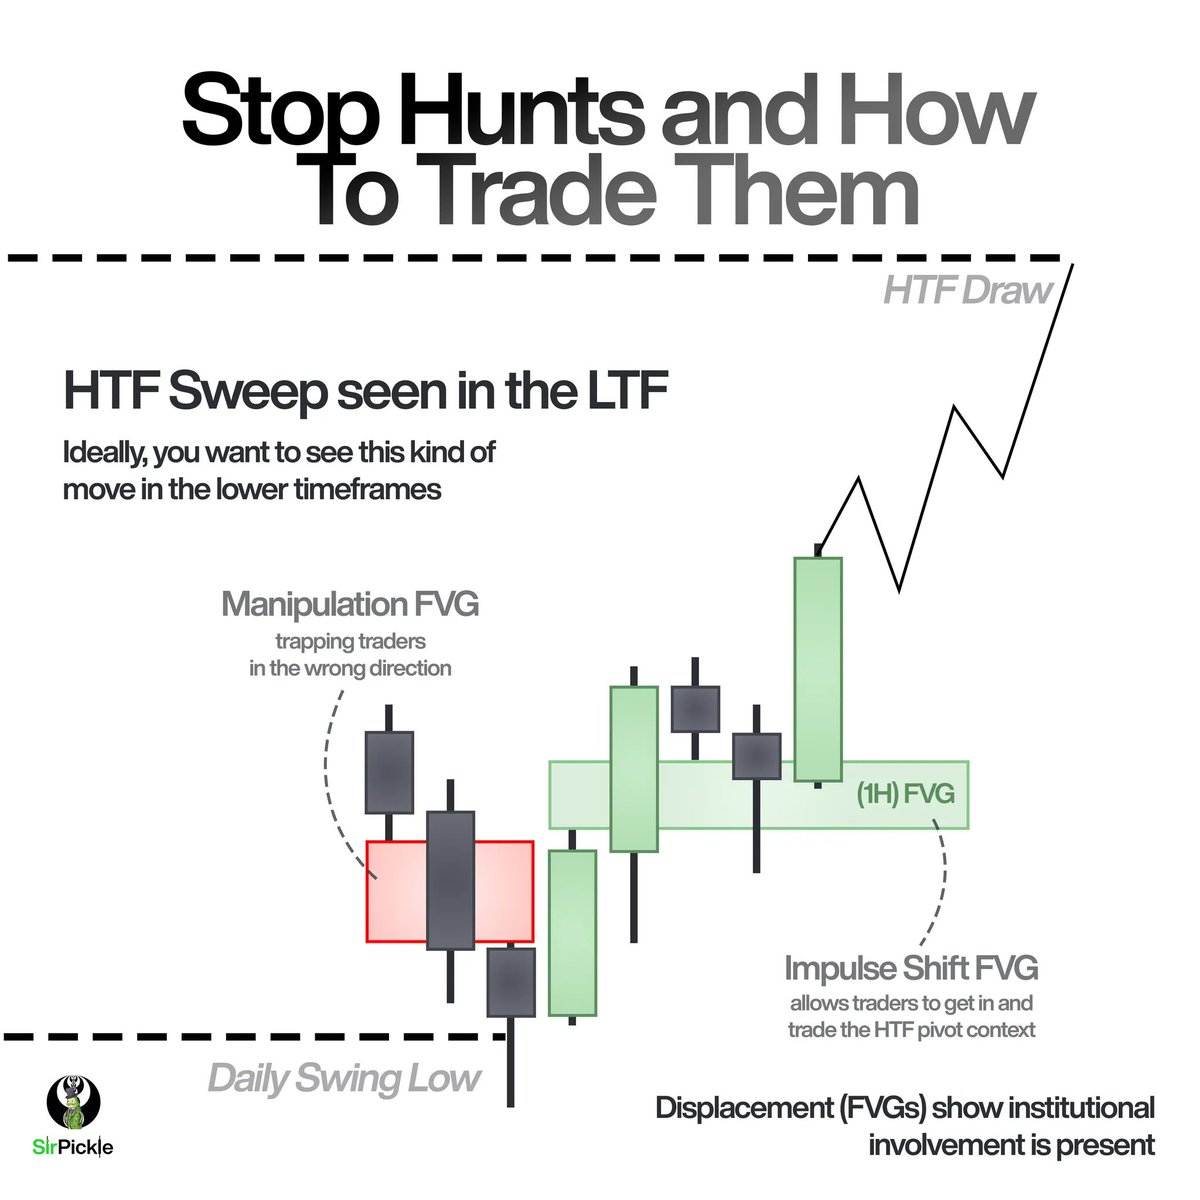
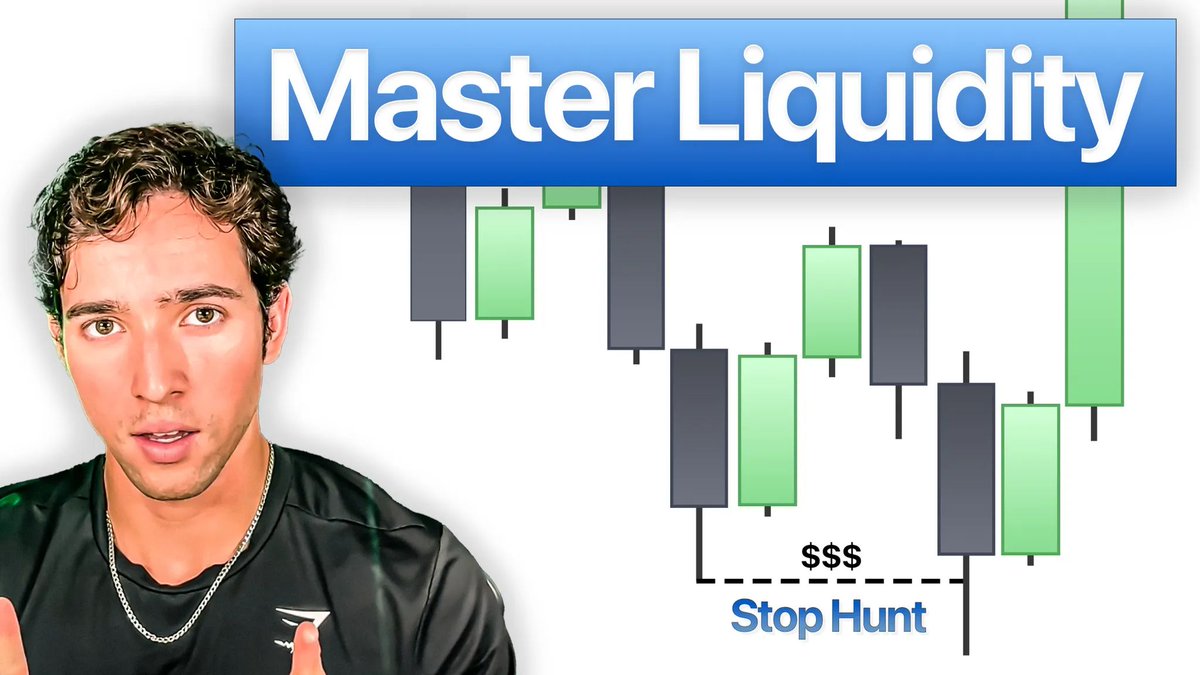
Stop Hunts and How To Trade Them
The entire process of Smart Money pushing price into liquidity to fill their orders is called a stop hunt.
It’s why price often “sweeps” a high or low before reversing.
To confirm this, we need to look for an impulse shift on the lower timeframe. This is the displacement that shows strong institutional activity on that level.
This impulse shift is where we can enter and target the HTF opposing draw on liquidity.
I’ve done a deep dive on this topic recently and if you wanna learn more, watch this video:
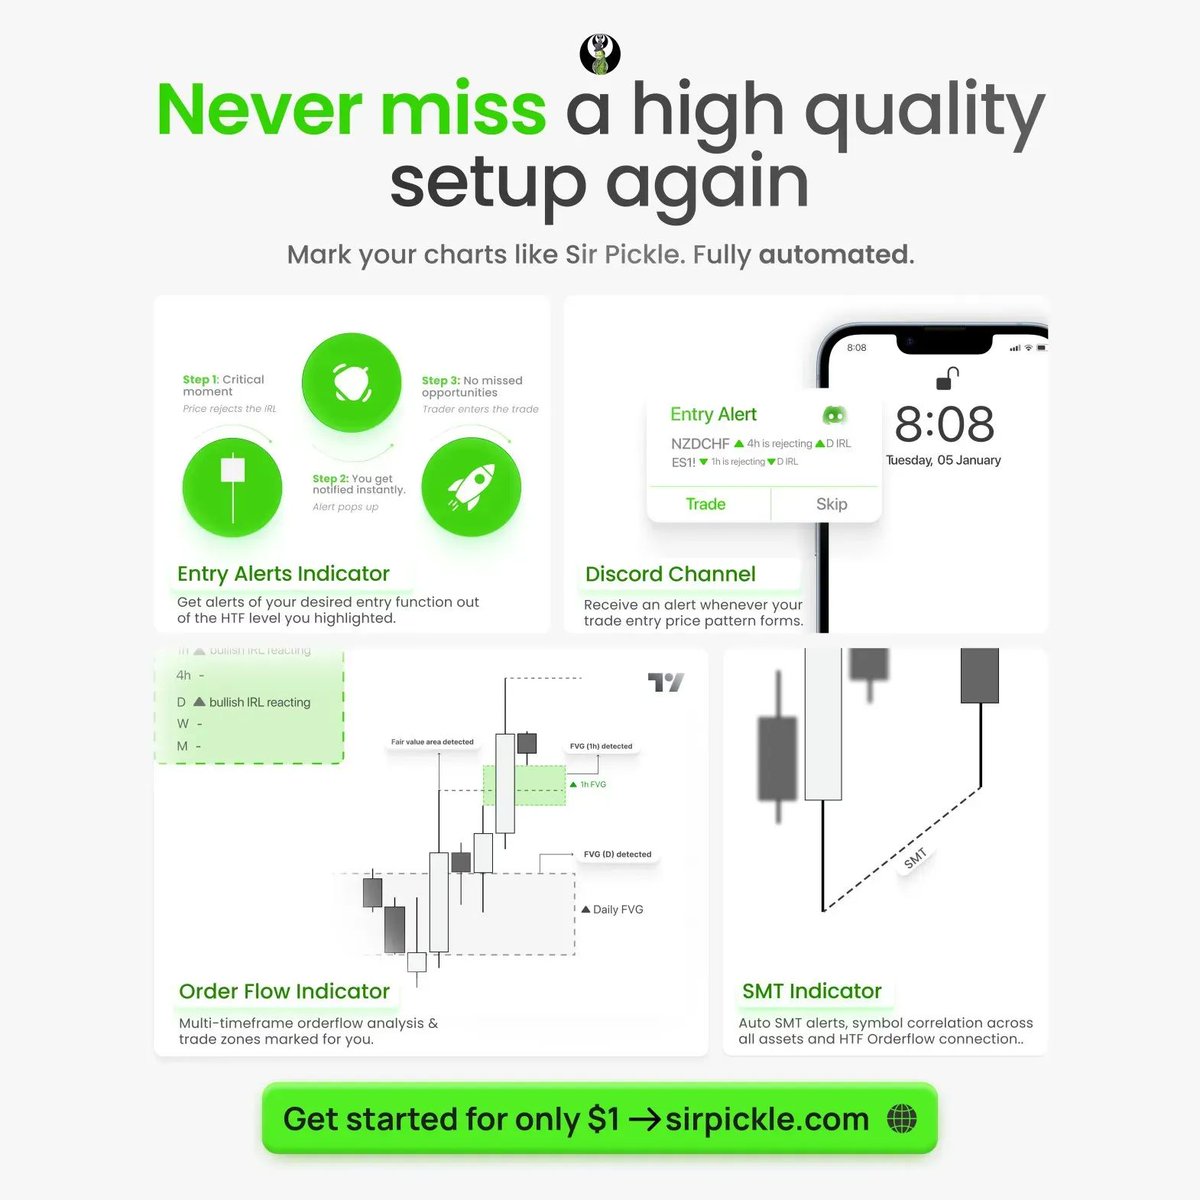
Try out the indicators I use on a daily basis in my trading for just 1$!
You get:
- ALL Indicators (Orderflow, Navigator, Entry alerts, Risk manager, and SMT)
- Discord bot (IRL alerts)
- Full Indicator Course
Find out for yourself why I love these tools so much:
sirpickle.com/indicators
You get:
- ALL Indicators (Orderflow, Navigator, Entry alerts, Risk manager, and SMT)
- Discord bot (IRL alerts)
- Full Indicator Course
Find out for yourself why I love these tools so much:
sirpickle.com/indicators
• • •
Missing some Tweet in this thread? You can try to
force a refresh