The only thing OP should regret is misleading his followers with his clunky charts and sloppy, unsophisticated analysis.
He has sadly ignored more tactful efforts to correct these issues, so enough is enough. Time to be blunt...
Let's break it down in a long thread.🧵
He has sadly ignored more tactful efforts to correct these issues, so enough is enough. Time to be blunt...
Let's break it down in a long thread.🧵
https://twitter.com/robin_j_brooks/status/2004221427382436188
1. The Premise is Flawed
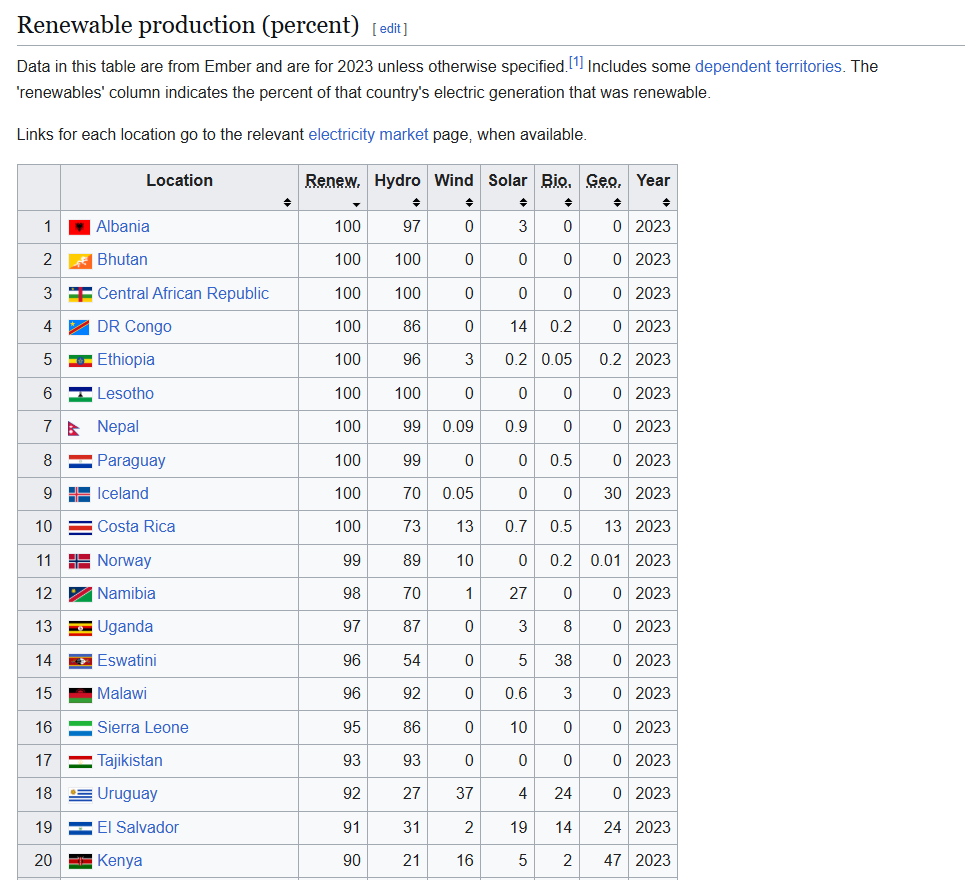
If we must go about assigning a silly label like "green superpower" (which IMO is really just vanity contest clickbait pretending to be analysis) then it's too narrow to define "green superpower" by what percentage of a country's power comes from renewables. This is immediately obvious when we look at the list of countries that lead the world in % of power from renewable energy today - see any superpowers in there? It's lovely to be blessed with abundant hydropower or geothermal resources, but that hardly drives global change.
China, at around 36% renewables (and rising of course) both installs more than the rest of the world combined, and exports the technology to green the power sectors of developing nations globally. If we must have this conversation, then it should acknowledge absolute volume and international impact, where China is clearly dominant...
2. Erroneous Analysis and Data
OP's post says "Two-thirds of electricity in China is from thermal plants...that's coal".
This is incorrect on several accounts. First, "thermal" in the monthly NBS pressers includes coal, gas, and renewables like biomass. Coal is the lion's share, but no, it's not ALL coal. So that's already a problem.
Next, the NBS monthly datasets do not report full power generation (全口径) across the whole economy, only generators "at-scale" (规模以上) which excludes small wind and solar (like rooftop solar, which is half the solar). Thus, it's impossible to calculate from this data series what percentage of power generation is coal without many assumptions. You must estimate, or wait for the quarterly data dumps or the annual statistics yearbook.
I'm not the first person to point this issue out. But OP has either ignored or dismissed everyone else who's pointed it out so far, so it must be repeated. His conduct on this point so far is a poor reflection on his integrity.
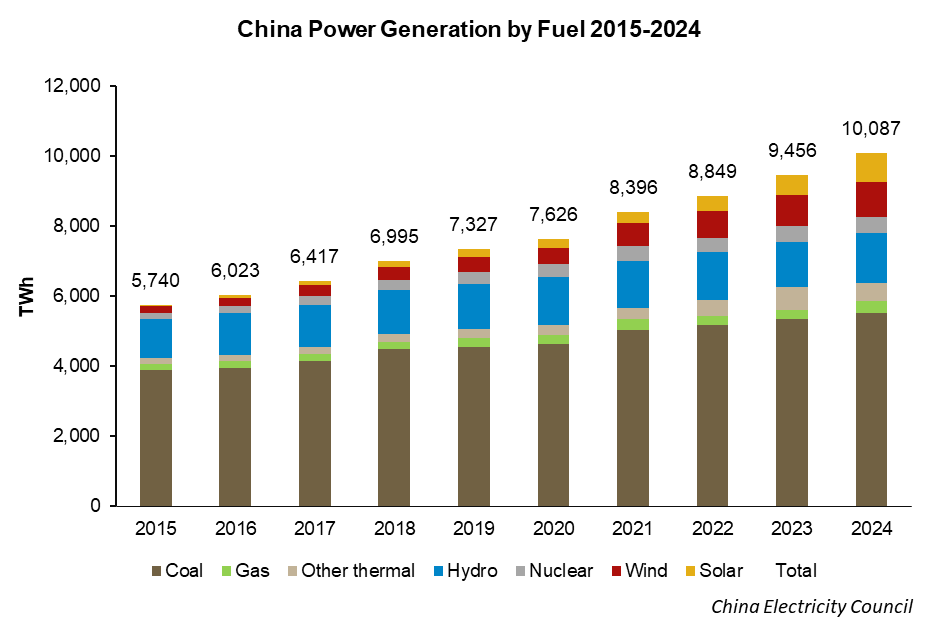
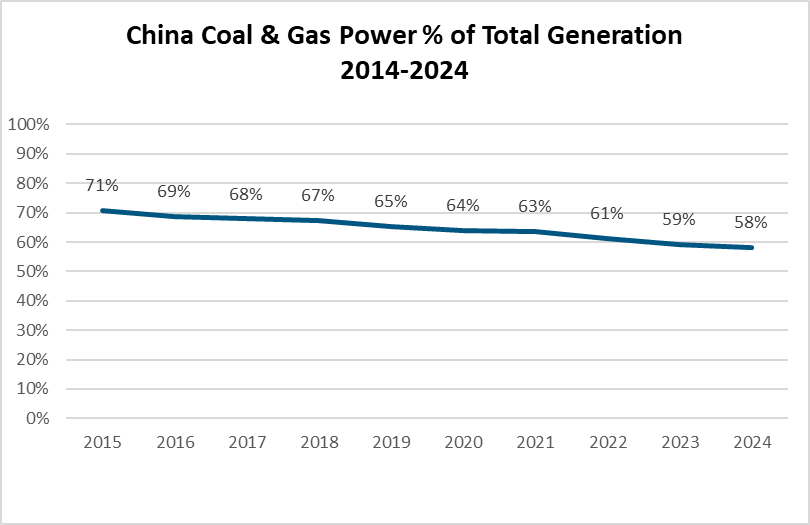
In the 2024 annual statistic yearbook published by China Electricity Council (CEC), coal comprised 54.8% of generation at the end of 2024, with gas-fired power adding another 2.6%. These numbers have been falling steadily for a decade and will fall again this year. So...the numbers don't lie, unless you're looking at the wrong numbers. 🧐
OP's post says "Two-thirds of electricity in China is from thermal plants...that's coal".
This is incorrect on several accounts. First, "thermal" in the monthly NBS pressers includes coal, gas, and renewables like biomass. Coal is the lion's share, but no, it's not ALL coal. So that's already a problem.
Next, the NBS monthly datasets do not report full power generation (全口径) across the whole economy, only generators "at-scale" (规模以上) which excludes small wind and solar (like rooftop solar, which is half the solar). Thus, it's impossible to calculate from this data series what percentage of power generation is coal without many assumptions. You must estimate, or wait for the quarterly data dumps or the annual statistics yearbook.
I'm not the first person to point this issue out. But OP has either ignored or dismissed everyone else who's pointed it out so far, so it must be repeated. His conduct on this point so far is a poor reflection on his integrity.
In the 2024 annual statistic yearbook published by China Electricity Council (CEC), coal comprised 54.8% of generation at the end of 2024, with gas-fired power adding another 2.6%. These numbers have been falling steadily for a decade and will fall again this year. So...the numbers don't lie, unless you're looking at the wrong numbers. 🧐
3. Flawed chart-making and chart premise
Another issue here is OP's odd chart choices, which undermine the credibility of his argument. As a purported professional with a finance background, these mechanical errors are baffling (but revealing).
First, the minor chart and nomenclature gaffes:
1. "Electricity power generation" is redundant. Pick "electricity," "power," or "electric power."
2. "Electrification" means "% access to electricity" or "electricity's share of energy consumption". It's misused in the linked post.
3. Watt should be capitalized in units like kWh.
4. "billions of kWh" should convert to TWh for clarity.
5. The "total" data series adds nothing. Delete it or use it for labels and hide the line.
6. The color scheme is inexplicable (I admit this is subjective). Why blue for thermal? Red for hydro?
Now, the glaring chart issue:
Why cram 20 years of data into a stacked area chart to discuss trends emerging in the last 3-5? Could anyone see from OP's chart if thermal, solar, or wind is rising? Can you see any recent trends or inflection points? OP's chart obscures everything, while he makes sweeping statements without visuals to back those statements. You must use the right tools for the job. This is not a minor error.
Let us try to do better, starting with this chart, using the same NBS monthly datasets, but looking only at the last 5 years. Now, we can start to see what looks like a flattening of thermal generation while other generation types grow. But to be honest, it's still tough to see...
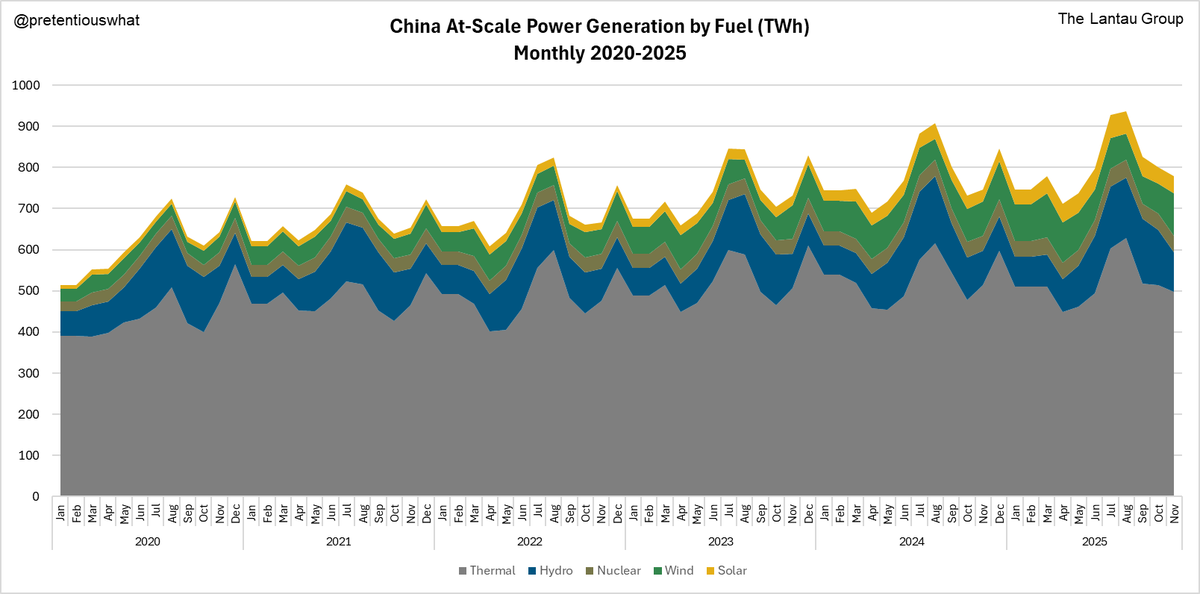
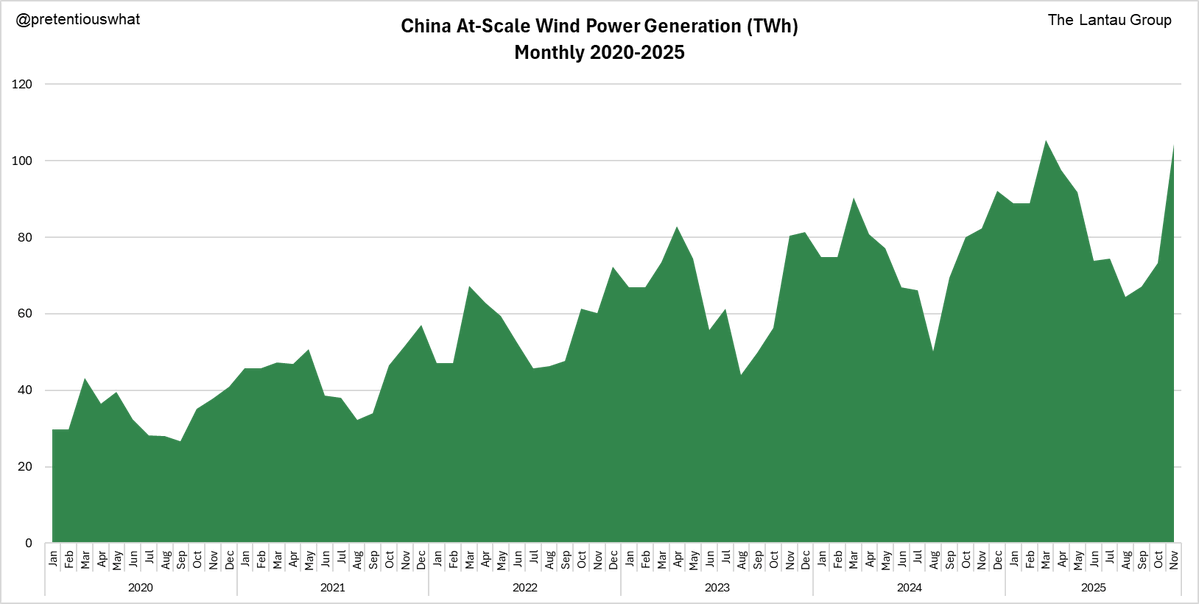
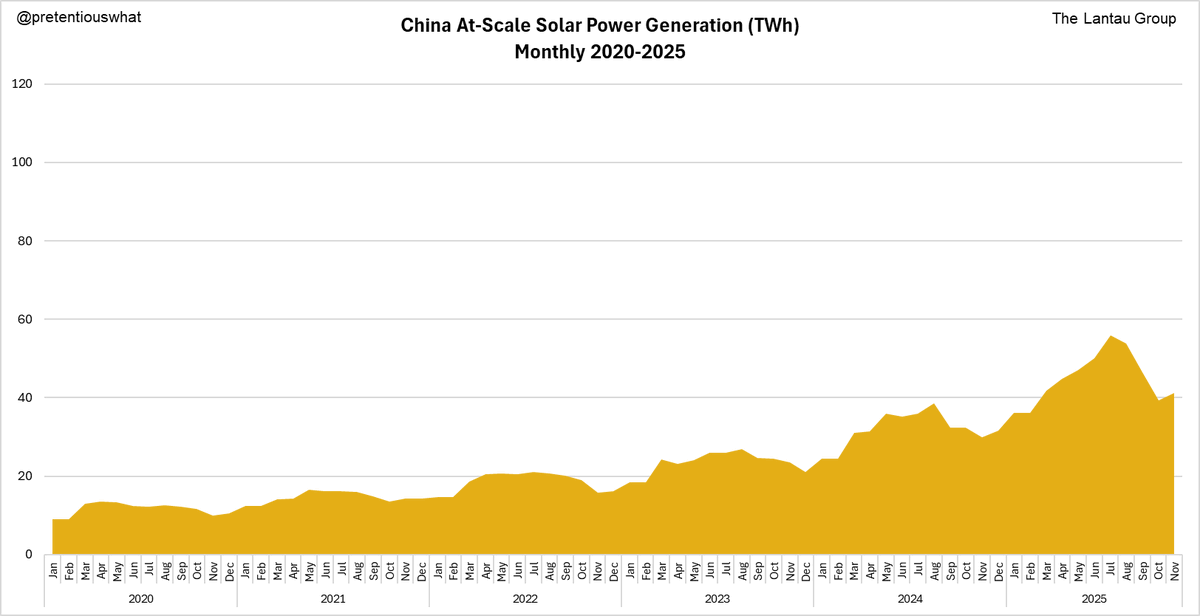
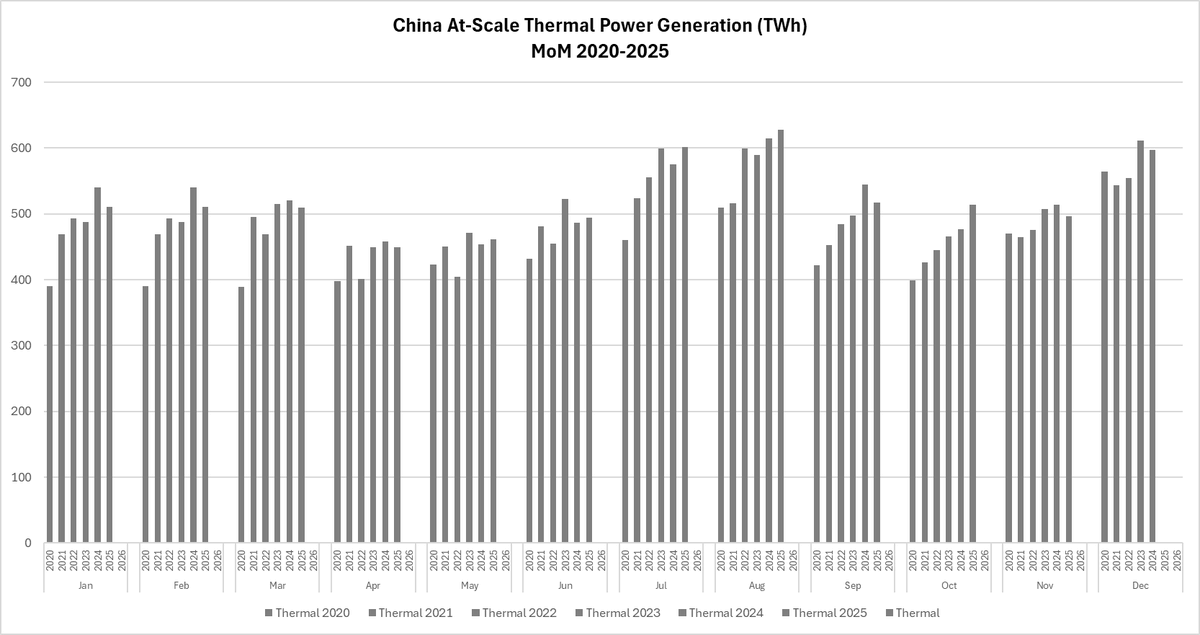
...thus, it should be helpful to zoom in even more. Here's a look at generation by discrete fuel type (nuclear is excluded here, as it's the least interesting).
Now the trends should be a little easier to spot...
(but please note the differing y-axes among charts).
Now the trends should be a little easier to spot...
(but please note the differing y-axes among charts).
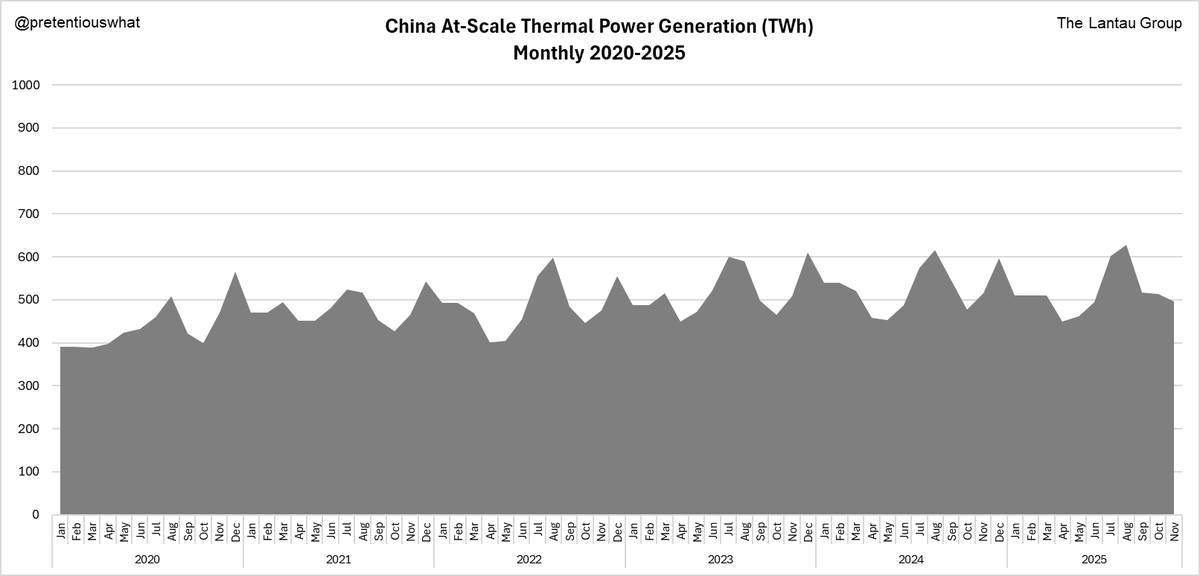
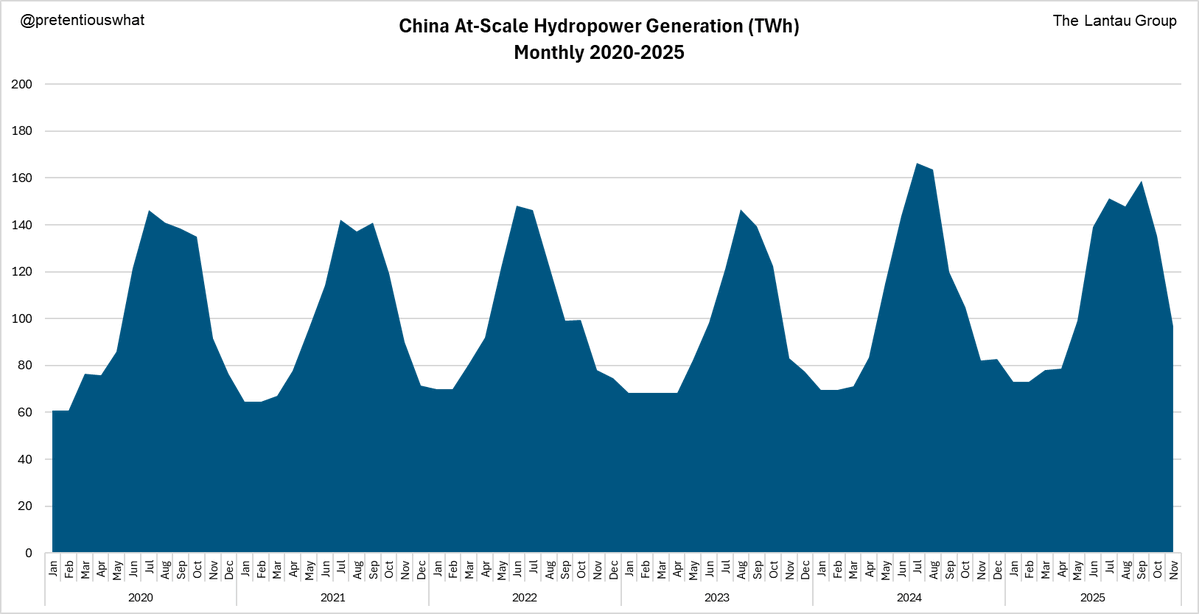
What do we see? Looking at the charts above, a few things are clear:
1. Wind and solar are growing extremely rapidly (but the y-axis tells us they are still small overall).
2. Hydropower is very seasonal.
3. Thermal power is doing...something? Actually even in that chart above, it's still hard to tell if it's trending upwards, downwards, or flat. We're going to need a different chart for this - something that can show annual changes.
OP used seasonally adjusted QoQ data in the linked article, which is unnecessarily complex and still vulnerable to distortion. How about something much simpler, like Monthly YoY changes?
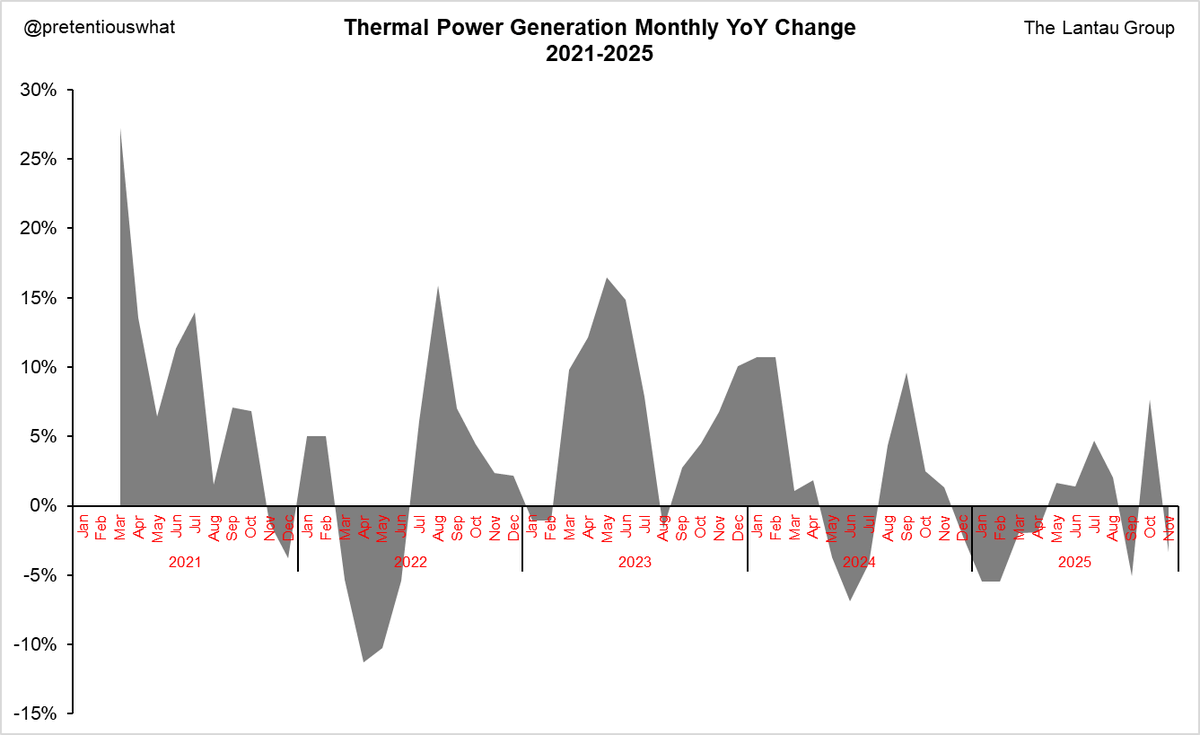
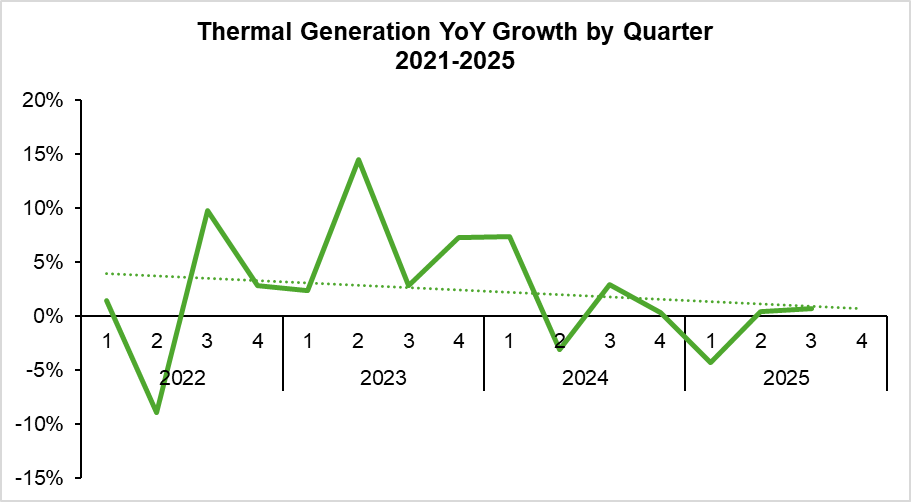
Ah, now we're getting somewhere. Thermal generation data over the last few years show considerable monthly volatility; some months spike well above the prior year's levels, while others dip sharply below. To gauge progress toward peaking coal consumption, we'll need to see the chart dwelling mostly in negative territory, indicating year-over-year declines, with minimal positive excursions.
And that's what we're starting to see! Over the past 18 months, thermal generation has hovered below the zero line about as often as above it. In other words, over 2025 China routinely used less thermal power in a given month than the year before.
Of course, the net impact hinges on timing: a drop during high-demand summer or winter months carries more weight than an uptick in low-demand shoulder seasons. But at least this year-on-year monthly view is a cleaner way to spot long-term trends in generation than a clumsy QoQ seasonal adjustment. Again, you must use the right tools for the job.
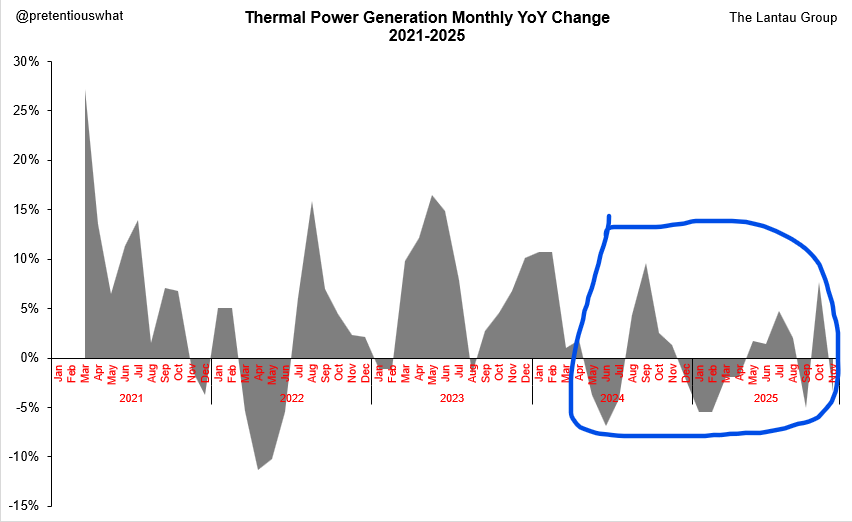
And what is the net effect of spending more time below the 0 line than above it? Net falling thermal generation...!
That's why recent NBS data show 2025 YTD (i.e., Jan-Nov) at-scale thermal generation is DOWN 0.7%.
Even though total at-scale power generation is up 2.4%.
That's why recent NBS data show 2025 YTD (i.e., Jan-Nov) at-scale thermal generation is DOWN 0.7%.
Even though total at-scale power generation is up 2.4%.

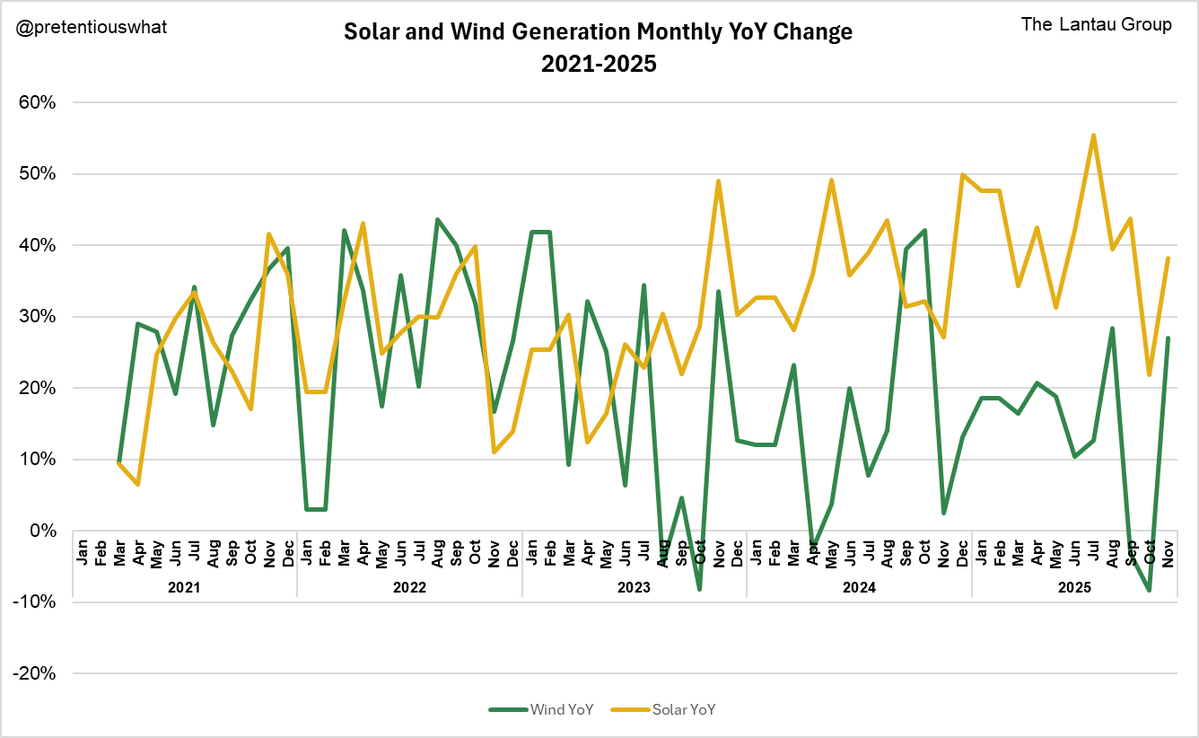
For contrast, here are the monthly YoY trends for wind and solar generation....consistently 20-30% higher than the previous year...in almost every month.
Notice how much volatility there is in renewables though - especially from wind. Every year, there's always more generation capacity than there was in the same month the year before, and yet we sometimes see very weak - or even negative - year-on-year monthly growth from these variable resources.
This year, October was particularly poor for both solar and wind, despite the vastly higher capacity numbers versus October 2024. That poor wind and solar performance directly corresponds with the October spike in thermal generation in the charts above.
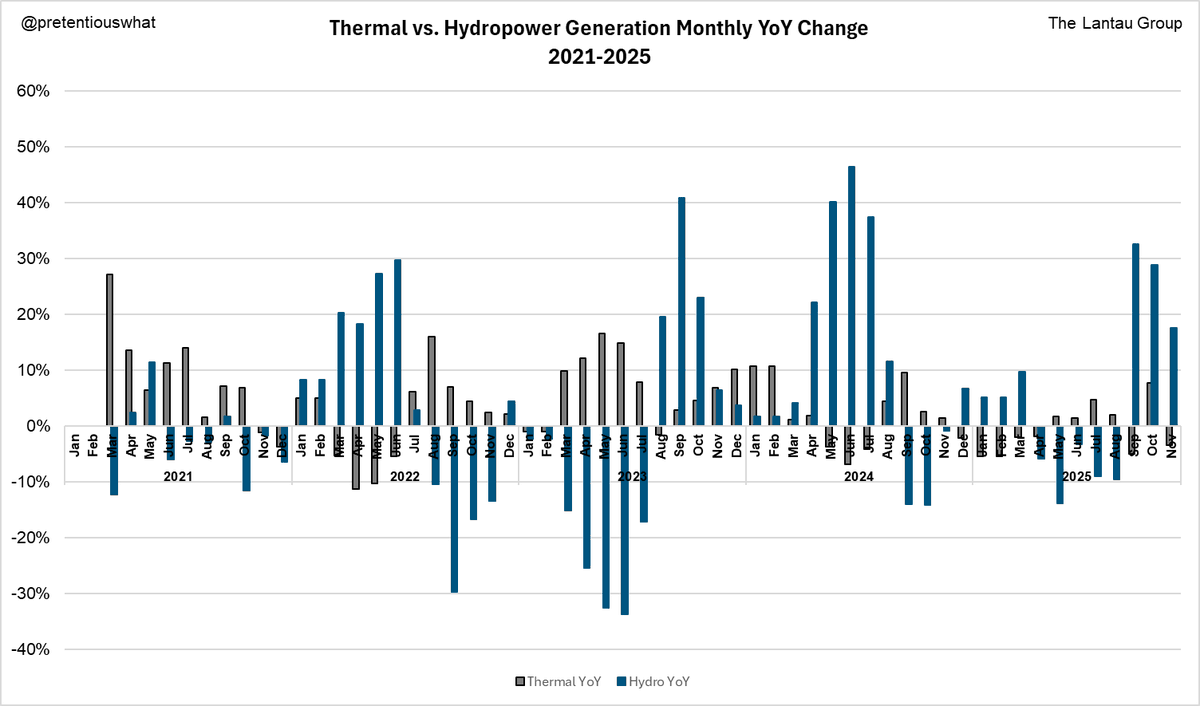
Another variable generator to worry about is hydropower. Hydropower isn't nearly as variable on a daily or weekly basis, but has seasonal variation, and can vary a lot annually based on rainfall.
Over the last 5 years, hydropower generation and thermal generation have been moderately negatively correlated (r = -0.575). As wind and solar capacity grow, this correlation will probably weaken. But for now, like with other renewables, if hydropower doesn't perform well, thermal is needed to fill the gap. This will continue to be a risk that can cause thermal generation to rise in certain months.
Over the last 5 years, hydropower generation and thermal generation have been moderately negatively correlated (r = -0.575). As wind and solar capacity grow, this correlation will probably weaken. But for now, like with other renewables, if hydropower doesn't perform well, thermal is needed to fill the gap. This will continue to be a risk that can cause thermal generation to rise in certain months.
In Summary:
This year, China added enough low-carbon power to meet 100%+ of its 2025 incremental power demand, peaking thermal generation. We don't know yet if it will be a durable peak, but even if it ticks up again in 2026, it's bound to be very close. It happened because China has made it a top strategic priority to dedicate more capital and resources to build and transmit low-carbon power than the next 10 countries together.
Regardless of whether we look by month or by quarter, we see thermal generation flattening out. We hit the inflection point this year, where the trendline slips below zero. The share of thermal power has already been declining for years; now the absolute thermal generation volume will also begin declining.
There's just no strategic or tactical value in dismissing these facts - not that I can see at least. Perhaps it buys you time to preen and scold for a few more years - and while I understand preening and scolding are enjoyable, those are fundamentally worthless activities. If you aren't actively working on your own country's energy transition, do us a favor and shut up.
In Conclusion:
Here, I've reviewed public datasets and tried to present them fairly and transparently. I've not provided any privileged information, just used my industry knowledge. As I've said before, I'm an analyst, not an activist. I'm also not an climate analyst or sustainability professional; my job is purely the economics of Chinese electricity. I repeat this because it matters. It's not in my scope to please interest groups (actually, clients pay for independent assessments). I certainly don't earn my pay check based on portraying China in any particular light. Our work is mostly for multinationals, not Chinese firms...
I take particular offense to OP's sloppy narratives and poor dataset handling because the seniority of his role should demand better. He spends all this time agitating and pompously tone-policing others over this perceived mischaracterization of China's role as a clean energy leader. What a waste! These objections are simply irrelevant when China is already showing it has the ability to add green power matching entire countries' consumption annually. Not only does it promote the energy transition, it's also good business for China. Where else could that trend be going?
I also take offense to the arrogance with which he dismisses critique. In the past month, many replied to note the flaws in his analysis, but his responses have been to either ignore or engage dismissively - while accusing his detractors of being ignorant shills. This degree of arrogance barely flies even when you're right; when you're arrogant and WRONG, you're just a jerk (and a liability to your employer). It also makes one wonder how robust the rest of his work is. 🤨
Generalist pundits like the OP have reliably missed every major "China shock" moment of the last 10 years by dismissing the signs as they appear - even when faithfully reported by industry specialists. From EVs and batteries, to solar PV, to drones, to telecom/5G, to AI and open-weight LLMs - hell even rare earths... NONE of these things had to become surprised Pikachu face moments - and yet they have been, every time, because people inexplicably keep putting their faith in smug, out-of-touch dupes like this guy.
China's "energy transition shock" is now. It happened quietly for a few years. Now it's about to start happening loudly. Ignoring it or trying to dismiss its existence won't change a thing. 🙄
• • •
Missing some Tweet in this thread? You can try to
force a refresh