The recent silver rally on CME/COMEX—roughly 25% in the prompt contract over ten days—has been widely attributed to “unprecedented” depletion of exchange stocks and forced conversion of futures into physical metal. A close examination of the actual data does not support this 1/
narrative.

First, CME inventory figures show that total silver stocks remained broadly stable through the critical December delivery window. Registered stocks—the metal available for delivery—did not decline, while Eligible stocks fell modestly and orderly. This indicates 2/ Image
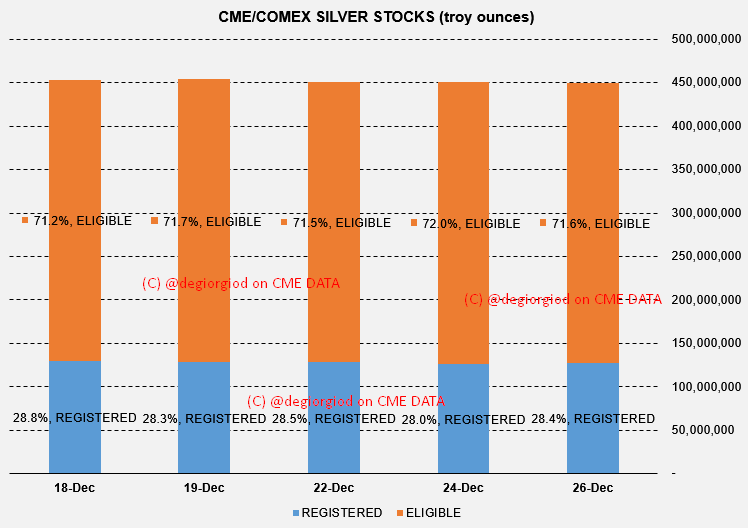
routine physical withdrawals and inventory management, not stress on the deliverable pool. Coverage ratios remained ample.

Second, delivery volumes in December () were elevated but not historically extreme, and they were absorbed without end-of-month 3/cmegroup.com/delivery_repor…
pressure on Registered inventories. Open interest stayed broadly stable, inconsistent with a forced delivery squeeze.

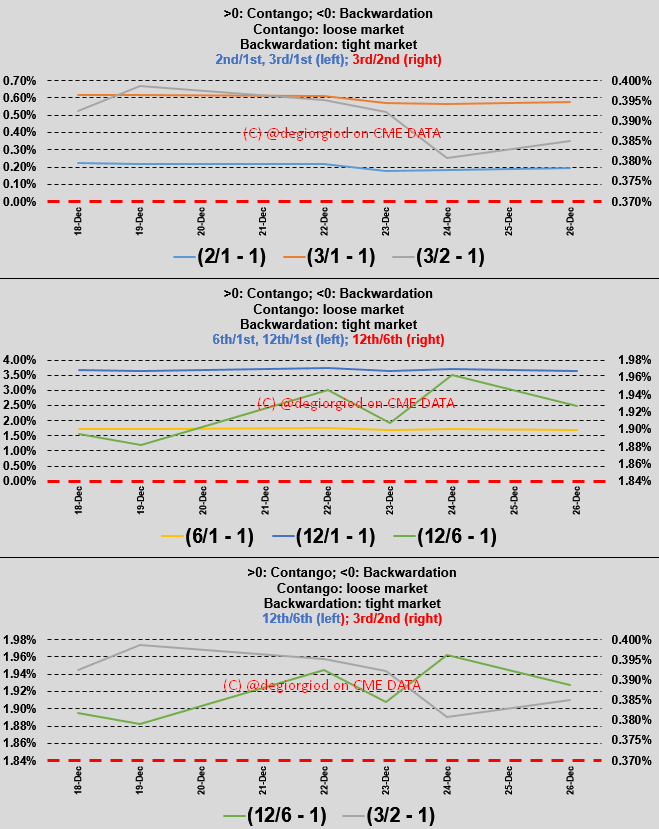
Third, and most decisively, the futures curve never signaled physical tightness. Throughout the rally, key time spreads (2nd/1st, 3rd/1st, 6th/1st, 12th/6th) 4/
remained in contango. In fact, contango widened in the mid-to-back curve, especially the 12th/6th spread. In precious metals, genuine scarcity or delivery stress manifests first as front-end backwardation; its absence is diagnostic. 5/ Image
Finally, CME margin increases during this period reflect volatility risk management, not inventory distress.

6/
Taken together, inventories, deliveries, open interest, and term structure all point to a macro- and positioning-driven rally—amplified by volatility and momentum—rather than one caused by COMEX stock depletion or forced physical delivery. /end
@threadreaderapp unroll

• • •

Missing some Tweet in this thread? You can try to force a refresh
 

Keep Current with Domenico De Giorgio, EU. Capre Diem (not a typo).

Domenico De Giorgio, EU. Capre Diem (not a typo). Profile picture

Stay in touch and get notified when new unrolls are available from this author!

Read all threads

This Thread may be Removed Anytime!

PDF

Twitter may remove this content at anytime! Save it as PDF for later use!

Try unrolling a thread yourself!

how to unroll video
  1. Follow @ThreadReaderApp to mention us!

  2. From a Twitter thread mention us with a keyword "unroll"
@threadreaderapp unroll

Practice here first or read more on our help page!

More from @degiorgiod

Dec 22
EU-Ukraine Loan: a long thread.

A chorus of economists and pundits—some of whom I actually respect—is currently up in arms over the fallout from the December 18th European Council marathon.

The original plan, pushed by the Commission and Merz’s Germany, was a 1/
masterpiece of "creative accounting": pillaging frozen Russian assets held by Euroclear to keep Ukraine’s economy (and military) on life support through 2026/27. That plan died on the vine. Instead, as the sun rose on December 19th, we found out the choice had fallen on a 2/
€90 billion loan () funded by the "EU24" (the coalition of the willing, minus the holdouts) through the issuance of common debt.

This is the exact same playbook used to bankroll that bureaucratic vanity project known as the Green Deal, whose financing 3/consilium.europa.eu/en/press/press…
Read 15 tweets
Nov 3
>>> Monetary Policy vs. Government Deficit Spending: How Public Debt Instruments Became a 'Lost' Asset Class <<<

The chart below explains two significant errors made by most investors:

a. Anchoring their expectations for long-term yields (red, 10-year Bund Yield) on 1/ Image
short-term Monetary Policy Action (its proxy here is the 1-year EUR Swap rate, black).

b. Failing to see how mounting debt-funded public spending would make Sovereigns eventually become riskier than Corporates (blue is the 10-year EUR Swap).

Once peak 2/
Monetary Policy tightness was belatedly hit in Europe by late 2023 (following what I and others view as a late response by the U.S. Federal Reserve and the European Central Bank (ECB) to the post-COVID Inflation Wave), market participants correctly 3/
Read 11 tweets
Oct 24
US CPI thoughts, (delayed) Sep.'25
By looking at the table below one would hardly fathom the steepest U.S. Trade Tariffs in 80yrs (see: x.com/degiorgiod/sta…) would translate into the "modest" CPI prints we are witnessing for Sep.'25.
One would rather pin such readings to 1/ x.com/degiorgiod/sta…Image
a vibrant, dynamic Job/Salaries ecosystem where spending is solid and consistent with a lively (2) yet less hot wages/jobs set-up where Wages continue to clock @ 4.1% YoY (1), ~+0.5% more than pre-Covid era but with a clearly less tight (3) balance btwn Labour S/D as Stayers' 2/ Image
minus Swithers' Wages Growth spread is back close to zero after the large Switchers' advantage seen during the post-Covid inflationary spike and Labour shortage.
Key CPI categories are not transpiring (yet?) the envisioned Tariffs-induced increases (),
Read 7 tweets
Oct 23
>King Liar<
@BruceCampbell63 reports a @FoxNews article () where a WH spokesperson's comment ("Coffee prices globally are also near historic highs because of supply woes... not tariffs.") is a gross distortion of market reality and is essentially false.
1/ foxbusiness.com/politics/trump…Image
Here's why:

The critical point is the distinction between a commodity's price and its availability for contractual fulfillment.

Brazil's Role: Brazil is the largest Arabica producer (albeit often lower quality for the exchange, hence the structural discount) and is 2/
traditionally the supplier of last resort for the physical stocks of the NY 'C' contract.

The heavy duties imposed by the U.S. on Brazil made it economically unviable for Brazilian exporters to direct large volumes of coffee to the U.S. market or for
3/
Read 9 tweets
Oct 21
>>>EU Act of Faith on LNG and Renewables<<<

Injections into EU-wide storage systems peaked on October 13th at 83.15% full ($948.86 TWh), 15 days earlier than last year (when $1,093.9TWh was hit on October 28th, 2024), and 23 days earlier than 2023's peak ($1,135.6TWh hit 1/ Image
on November 5th, 2023).

End-of-Season (EOS) Storage is 9% lower this year compared to last year, and 14% lower compared to its 5-year average.

2/ Image
Storage is significantly lower in Germany (-22% YoY), the Netherlands (-19.5% YoY), and in landlocked countries such as Hungary (-21%) and Slovakia (-20%).

Germany and the Netherlands are home to the largest share of non-programmable Renewable Energy Sources (RES) electric 3/ Image
Read 8 tweets
Oct 10
Texas: the Lone Star State is an energy behemoth whose immense might and significance in the Energy Transition landscape are scarcely understood.

According to U.S. EIA Data for the end of 2024, Texas's Net Electricity Generation was 564 TWh, 1/
representing 13% of the entire U.S. total (4,305 TWh). Between 2001 and 2024, Texas increased its Net Electricity Generation by 51% (from 373 TWh to 564 TWh), while the entire U.S. increased its generation from 3,737 TWh to 4,305 TWh.

If we rank the continental U.S. states 2/ Image
by Electricity Generation, the top 15 states account for 63% of the total. Texas leads this ranking (564 TWh) by far over the 2nd (FL, 265 TWh), 3rd (PA, 244 TWh), and 4th (CA, 214 TWh).

From Europe—where a very ill-conceived Energy Transition is wreaking havoc on the 3/
Read 9 tweets

Did Thread Reader help you today?

Support us! We are indie developers!


This site is made by just two indie developers on a laptop doing marketing, support and development! Read more about the story.

Become a Premium Member ($3/month or $30/year) and get exclusive features!

Become Premium

Don't want to be a Premium member but still want to support us?

Make a small donation by buying us coffee ($5) or help with server cost ($10)

Donate via Paypal

Or Donate anonymously using crypto!

Ethereum

0xfe58350B80634f60Fa6Dc149a72b4DFbc17D341E copy

Bitcoin

3ATGMxNzCUFzxpMCHL5sWSt4DVtS8UqXpi copy

Thank you for your support!

Follow Us!

:(