
Adj. Prof. Financial Markets @ Unicatt, Milan.
Podcast: https://t.co/gltwX62e1g
All things Macro, Bonds.
Energy Specialist.
Ex Citi, ex UBM.
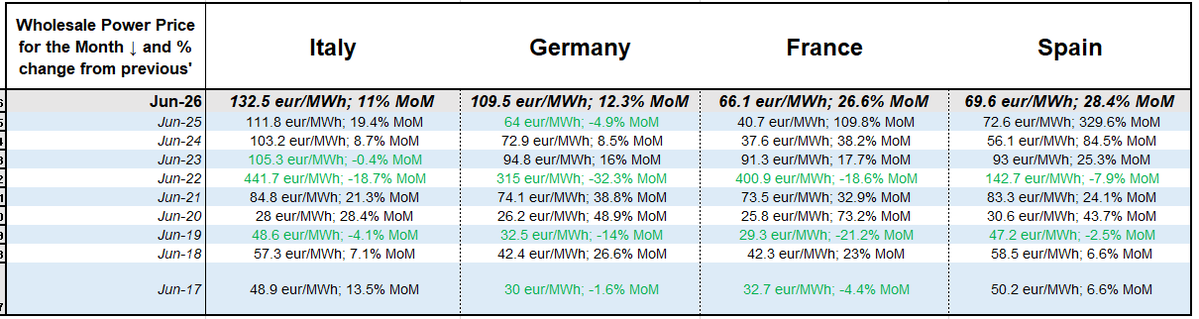 absolute terms in IT, DE (2nd-dearest June in 10yrs) and relative terms in both Spain (+28.4%MoM) and France (26.6% MoM).
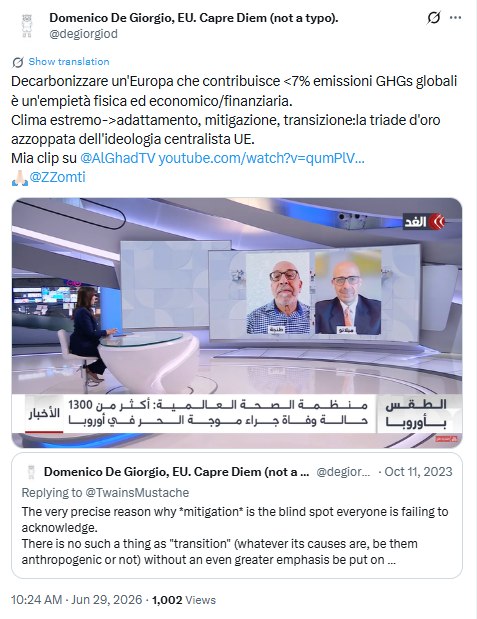
 I appreciate a lot of commentators have been misled by headline prints over the past years - I blame them for their lame analysis.
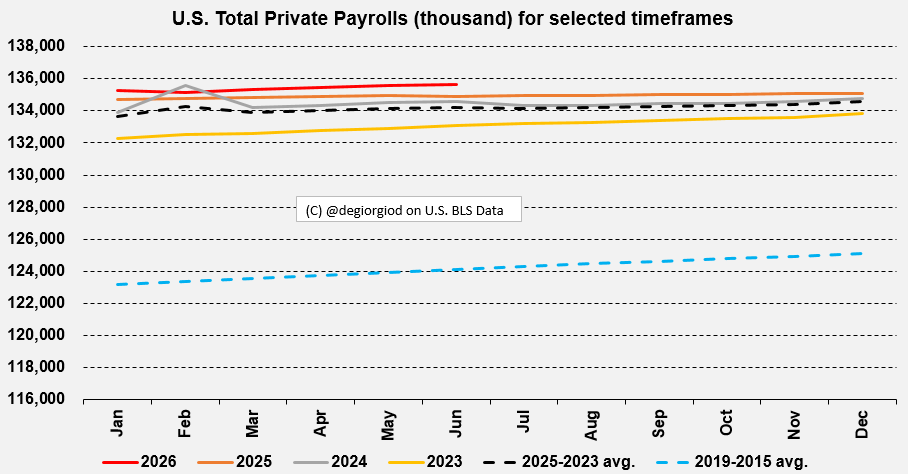
 the military infrastructures of the all-important Iranian Oil Export terminal of Kharg Island, the focus of the interview was re-routed on the implications of this further development.
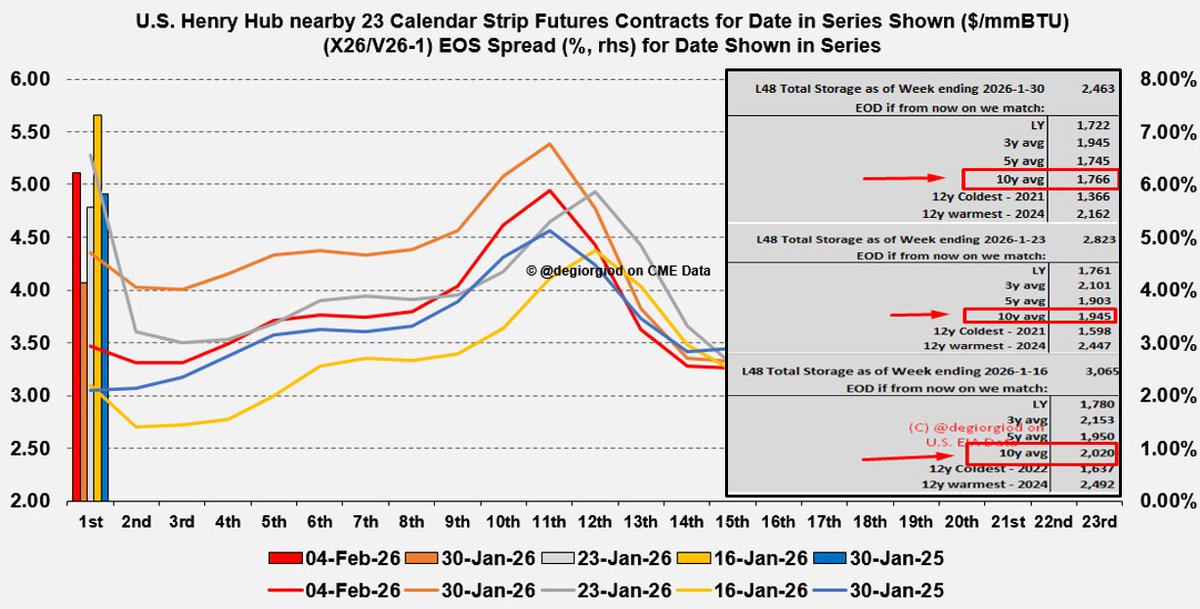 3. a grey box on the RHS of the chart, where I put my Storage model's levels for the last 3 EIA Reporting weeks and its EOD scenarios based on different assumptions of how the rest of the Draw Season may behave
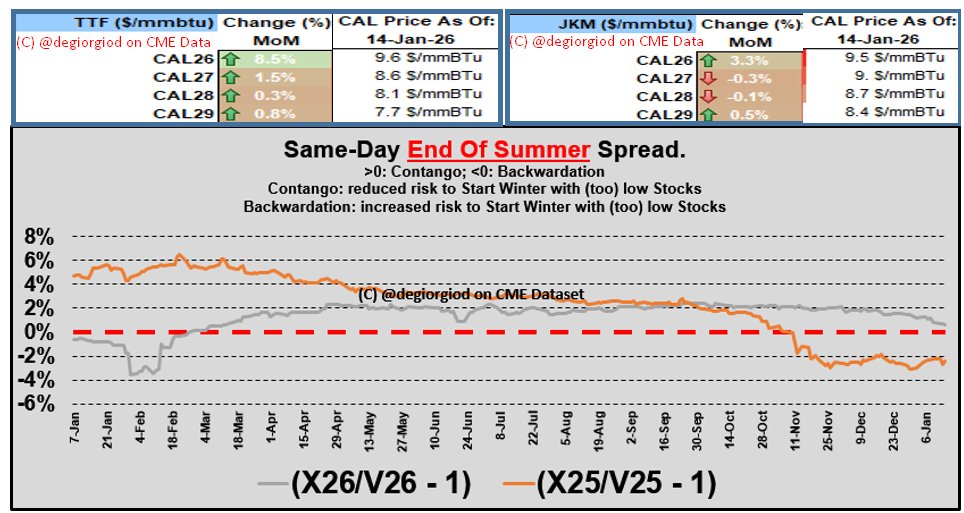 we actually did.
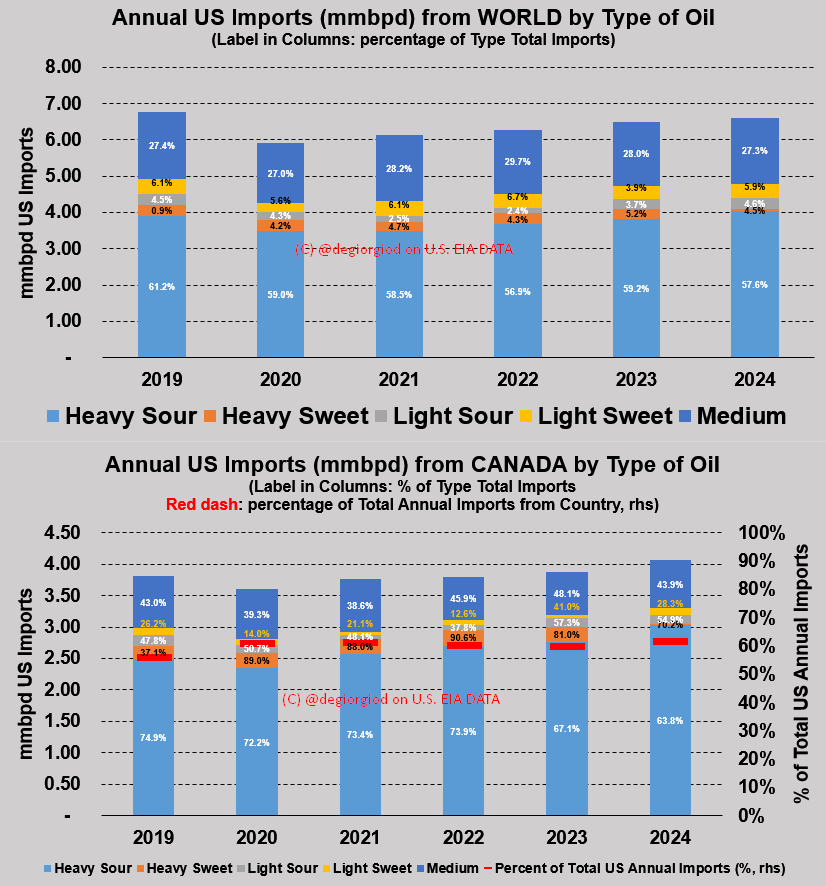 anyone?), 60% of which (~4mmbpd) from Canada.
 Dagli Stati Uniti (e *non* vuol dire che i venditori siano gli USA, ovviamente) son partiti 77miliardi di metri cubi di LNG per l'Europa, oltre il 60% dell'ammontare record (~144bcm) esportato nei primi 9 mesi del 2025.
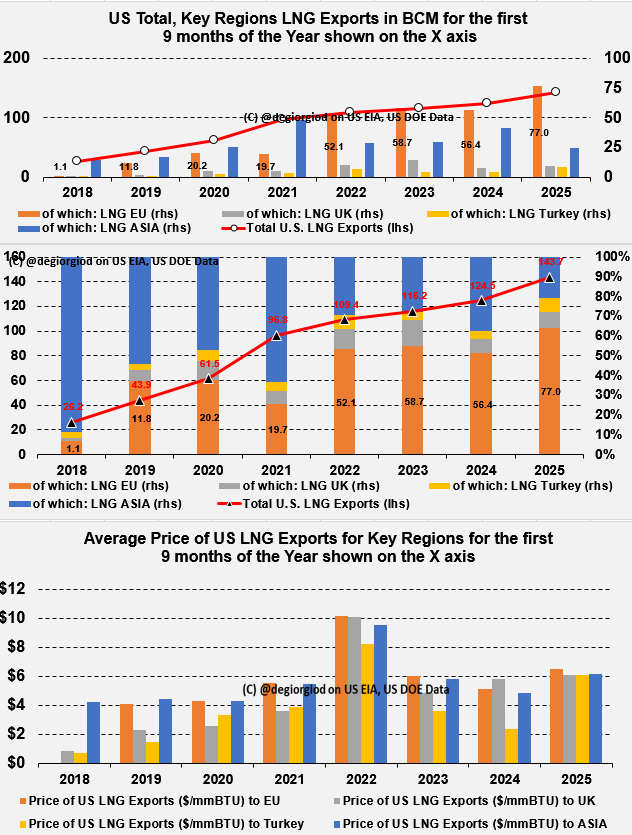
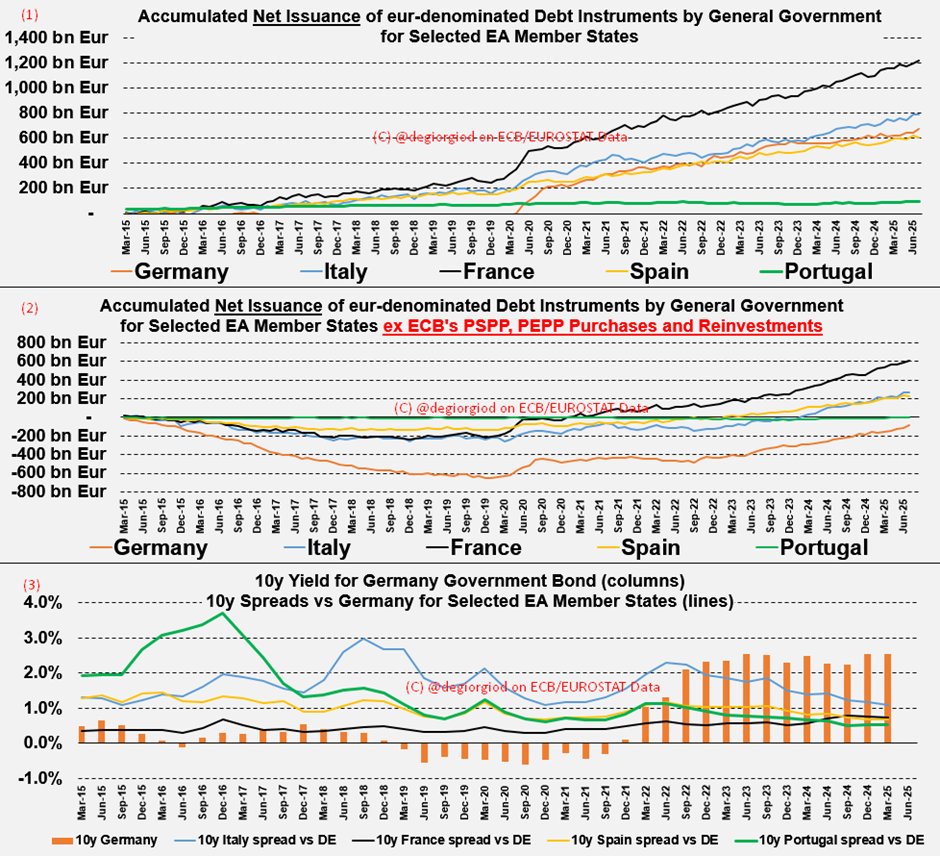
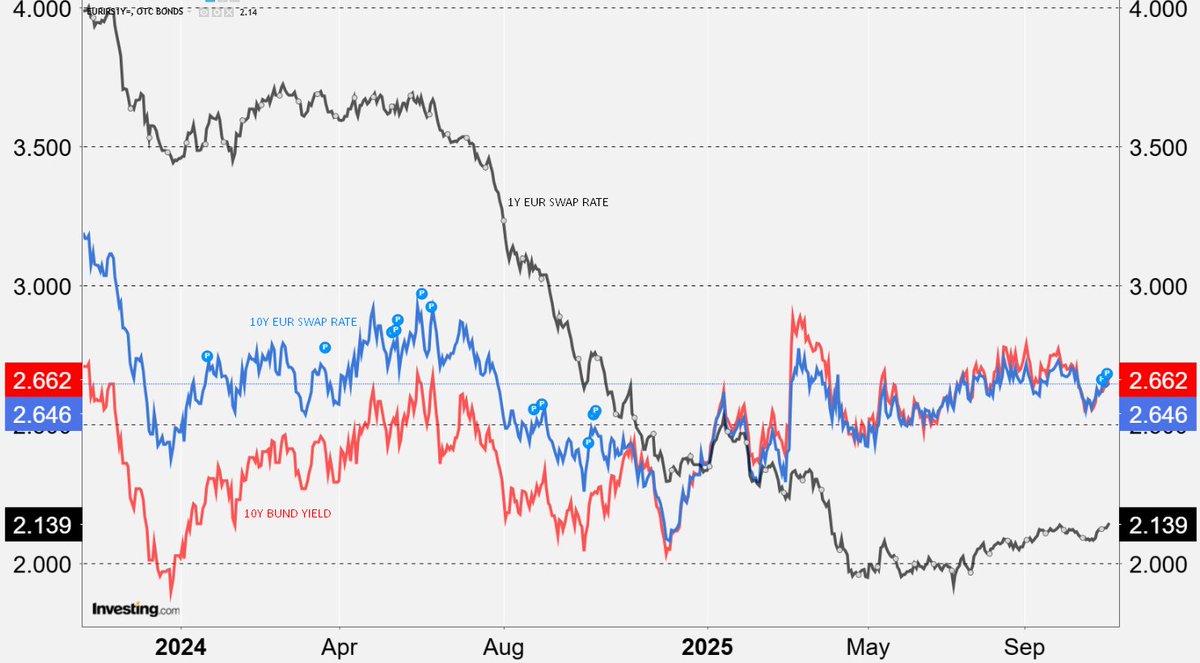 short-term Monetary Policy Action (its proxy here is the 1-year EUR Swap rate, black).
 a vibrant, dynamic Job/Salaries ecosystem where spending is solid and consistent with a lively (2) yet less hot wages/jobs set-up where Wages continue to clock @ 4.1% YoY (1), ~+0.5% more than pre-Covid era but with a clearly less tight (3) balance btwn Labour S/D as Stayers' 2/
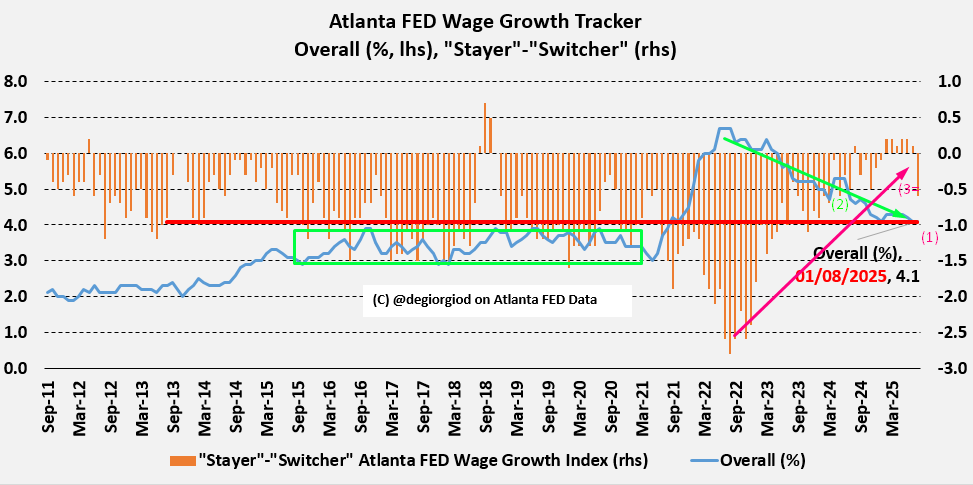
 Here's why:
 on November 5th, 2023).
 Things are frail already in Power-land...
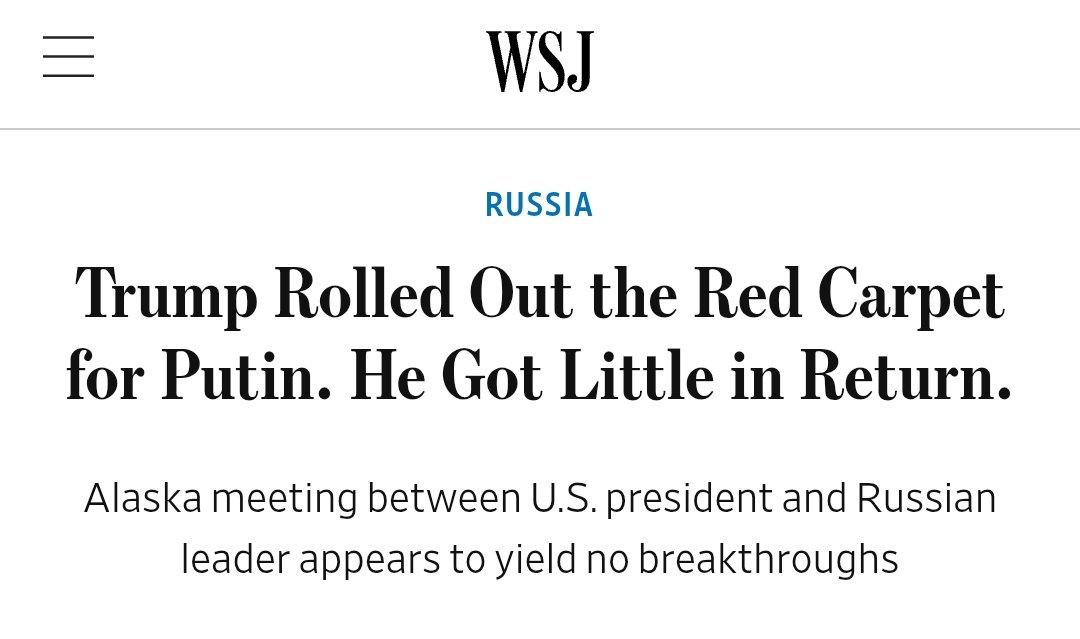 supine posture towards Washington in handling EU foreign affairs (see ↓) had alienated the only credible, usable, viable leverage in the hands of the EU and of its member states: trade, namely energy trade.