Nick Gerli Profile picture
Jan 1 10 tweets 4 min read Read on X
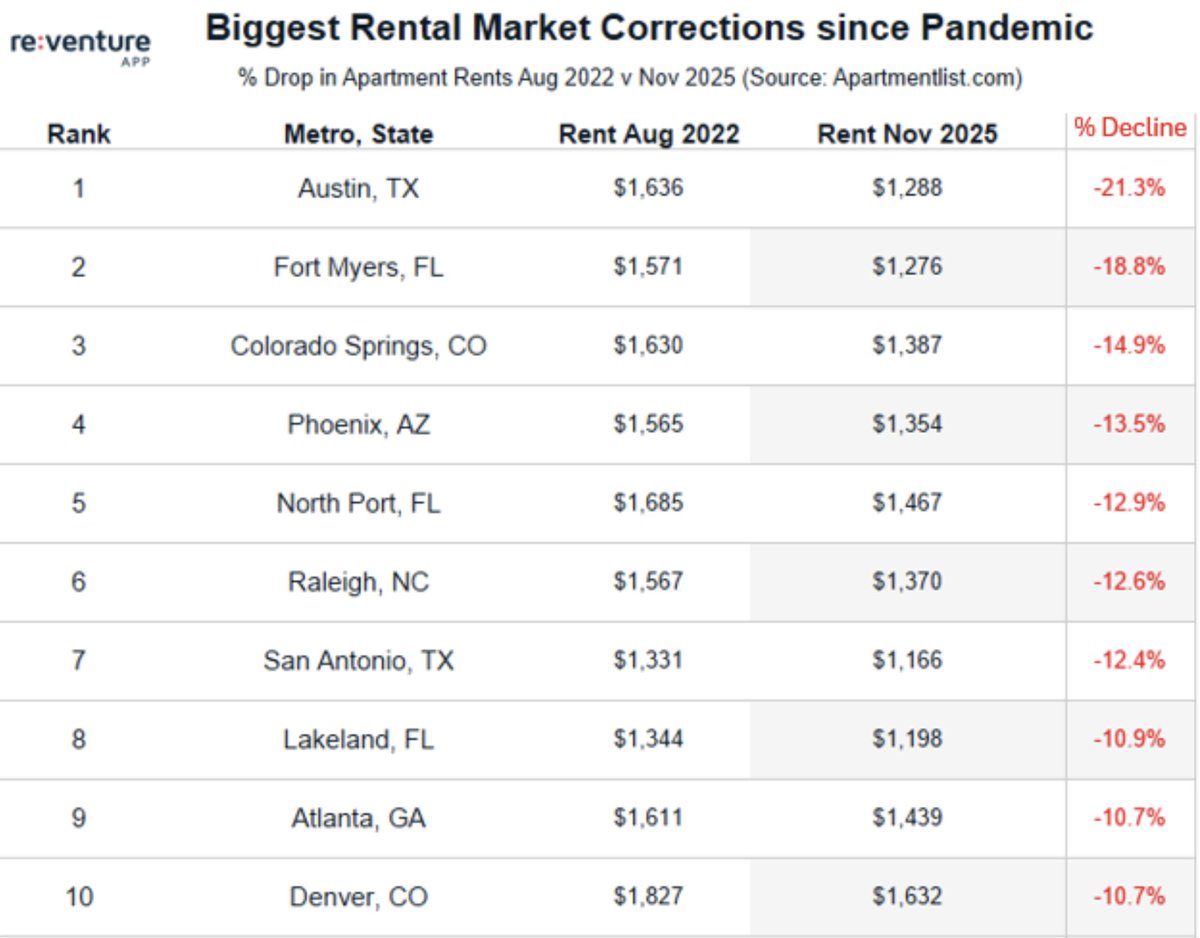
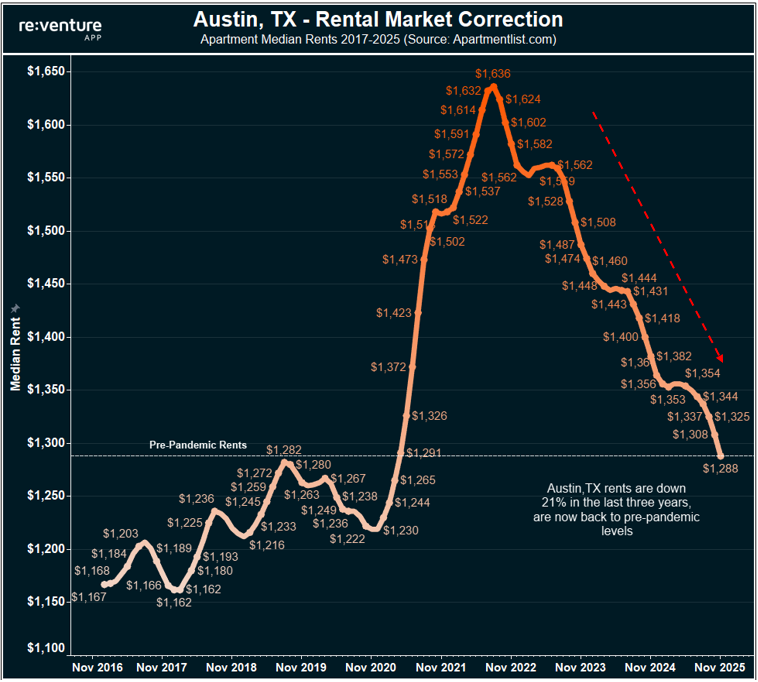
Austin TX is now back to pre-pandemic apartment rents.

Down 21% from peak in summer of 2022.

$1,636/month --> $1,288/month

(I'm now even seeing 2BRs in some apartments at sub-$1,000)

This rental correction is due to a sharp drop in migration/demand, combined with a surge of new apartment development.

At this point, Austin has its cheapest rents on record relative to income.Image
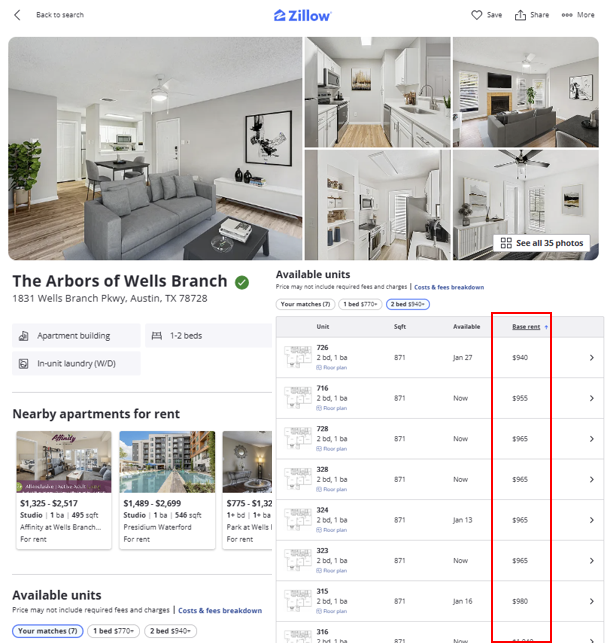
1) Here's an example of what's out there now.

2BRs going for $950.

This is a complex which is off I-35. A 9-minute drive to the Domain according to Google Maps.

$470 per bedroom. Image
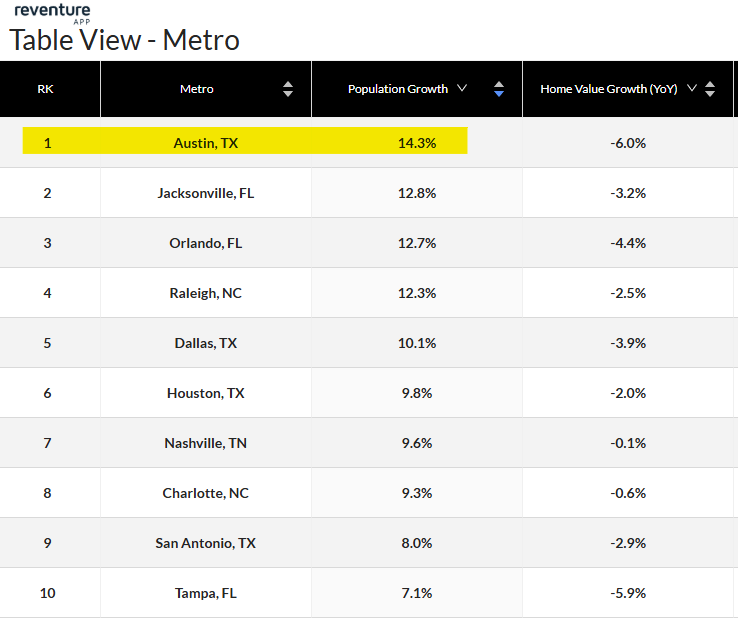
2) The miraculous thing about this is that Austin, despite the slowdown in migration, is still a demographic beast when it comes to growth.

It's 5-year population growth rate from 2019-2024 is 14.3%.

Which is easily #1 among other large metros.

(Note: it's interesting how every high population growth market during pandemic is now seeing declining values. The boom/bust cycle is real).Image
3) Now - why is this happening?

It's mainly due to a ridiculous amount of new supply from builders.

At the peak, in 2021, home builders pulled around 50,000 permits per year in Austin (single-family + multifamily).

This was nearly double the previous high, and was unprecedented.

This permit deluge is still resulting in completed projects today.
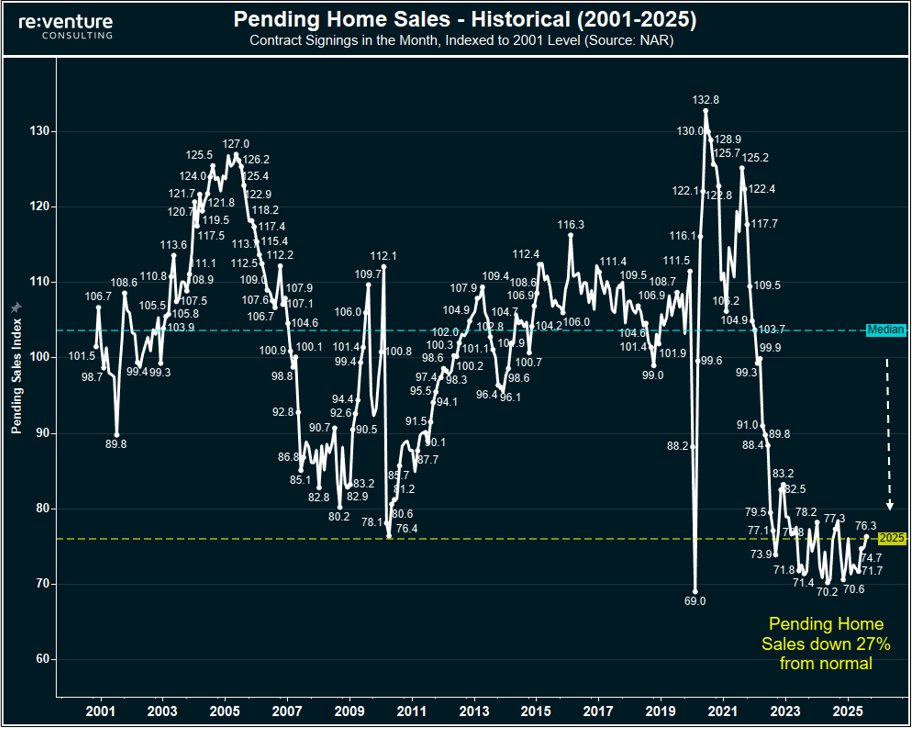
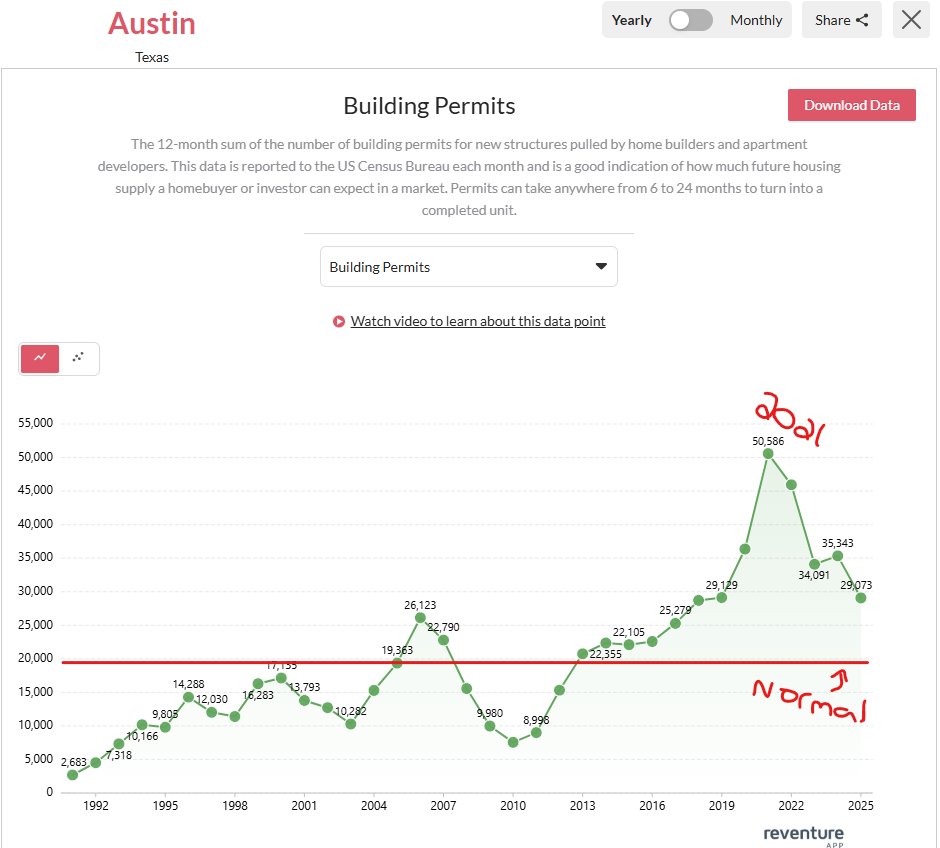
4) You can see how outrageous this was on this graph.

"normal" permitting levels in Austin are around 20,000 units per year, going back several decades.

But starting in mid-2010s the permitting picked up.

And then it exploded during the pandemic - over 50,000 in 2021 and around 45,000 in 2022.

And is still somewhat high today at 29,000. Builders keep permitting even though both prices and rents in Austin have plunged.Image
5) All in all - this is great news for Austin.

And I feel confident in forecasting that the metro will eventually regain its top mantle for migration in future years a result.

Literally - there is almost nowhere cheaper to rent in the U.S. when you factor in income levels.
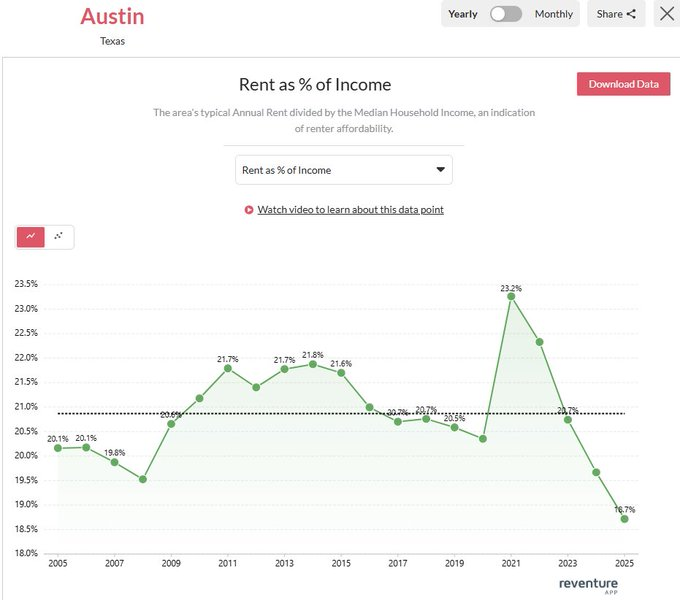
6) Austin's "Rent/Income" Ratio is now down to 18.7%.

Which is the lowest level on record, in Reventure's data set, going back to 2005.

Reventure calculates Rent/Income by combining data from Zillow and the US Census Bureau through time.

Currently, Zillow's monthly rent for Austin is $1,586, or $19,000 per year.

Meanwhile, area median income is $102,000.

Thus the 18.7% Rent/Income Ratio.Image
7) How cheap is a 18.7% rent/income ratio?

It's literally the 2nd cheapest in the U.S.

After Des Moines, Iowa. Image
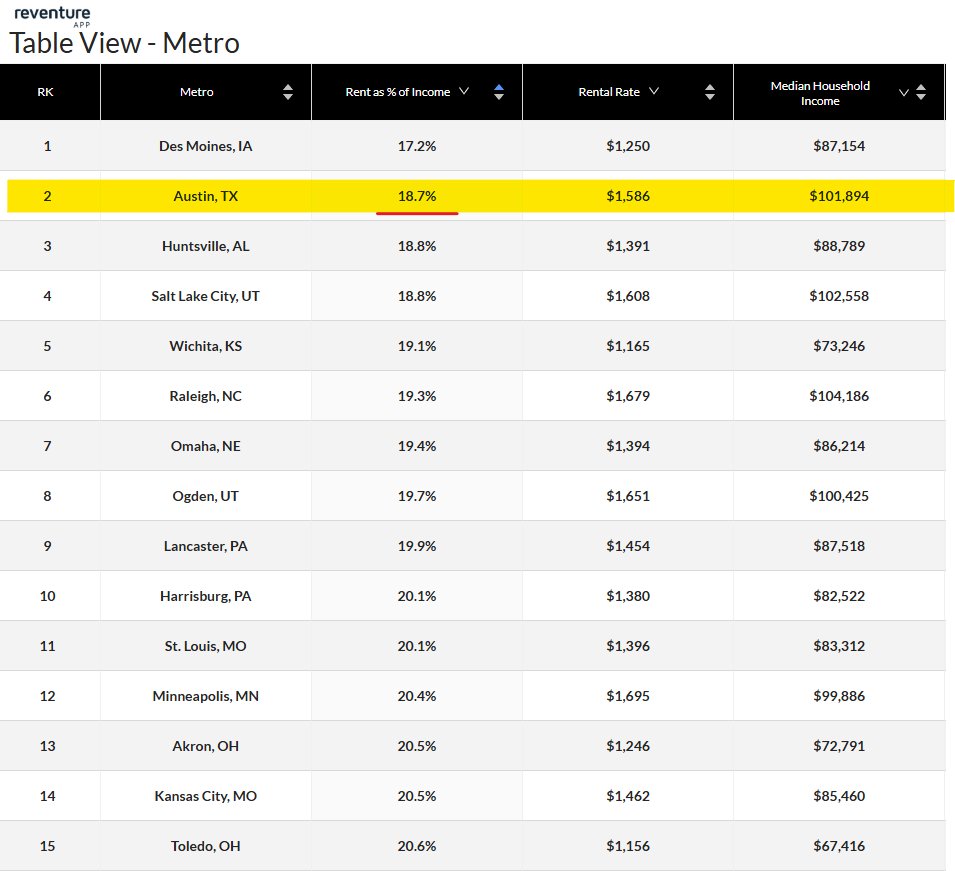
8) It's wild that Austin rents are now relatively cheaper than Rust Belt markets like Lancaster, Pa, St. Louis, MO, and Akron, OH.

Austin rents are priced like it's a no-growth Midwest town.

But it's a Sun Belt boomtown (in the long-term).
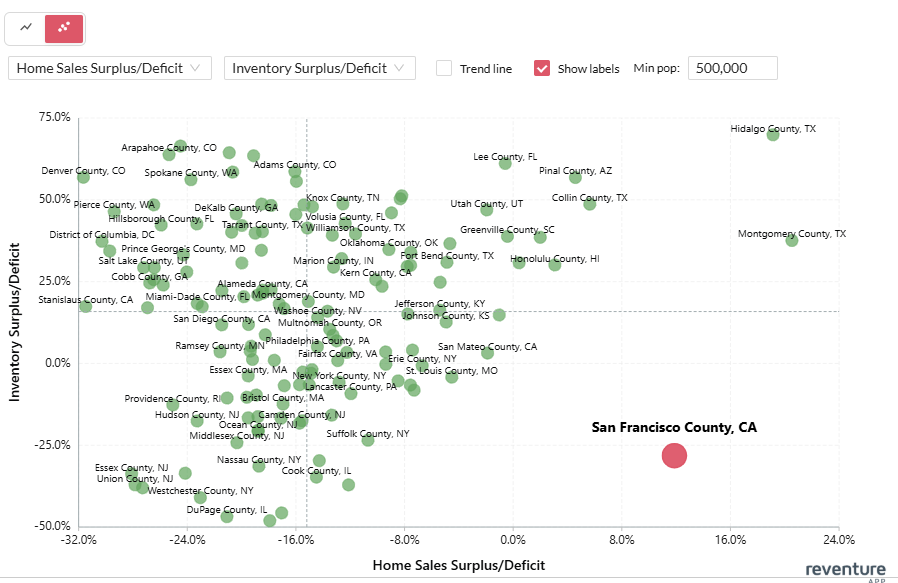
9) Of course - prices in Austin are also dropping hard as well. Down 25% in a similar period.

Reventure thinks there's still some downside left for Austin's market in 2026.

But at some point, it will flip to a buy. To find out when, and to see the 12-month price forecast for your area, go to reventure.app and sign up for a premium account.

• • •

Missing some Tweet in this thread? You can try to force a refresh
 

Keep Current with Nick Gerli

Nick Gerli Profile picture

Stay in touch and get notified when new unrolls are available from this author!

Read all threads

This Thread may be Removed Anytime!

PDF

Twitter may remove this content at anytime! Save it as PDF for later use!

Try unrolling a thread yourself!

how to unroll video
  1. Follow @ThreadReaderApp to mention us!

  2. From a Twitter thread mention us with a keyword "unroll"
@threadreaderapp unroll

Practice here first or read more on our help page!

More from @nickgerli1

Jan 1
U.S. homebuyer demand is near the lowest level on record.

And there's one reason why: horrendous affordability.

Right now, U.S. homebuyers need to pay 39% of their gross income in order to afford to buy a house entering 2026.

And obviously, no one wants to do that. As a result, sales demand has plummeted to the lowest level in 40 years (only 4.7% of occupied homes sold in 2025 - the lowest since 1982).

Historically, you can see these trends are negatively correlated. Mortgage costs go up, sales velocity down, and vice versa.

Note: the single-biggest determinant of Mortgage Costs is actually not Mortgage Rates. It's prices. Prices going up 50% crushes affordability more than rates going from 4 to 6%.

Lower prices will bring down the Mortgage Cost burden, and allow for more home sales.Image
1) if we want to re-stimulate the housing market, and make the American dream accessible again, it all comes down bringing down Mortgage Costs and making the housing market more affordable again.

This is what will bring buyers back.
2) But once again, it's not about mortgage rates.

As you can see - a 50% increase in mortgage rates only causes mortgage costs to go up 19%.

While a 50% increase in prices causes mortgage costs to go up 50%.

It's about prices. Always has, always will. Image
Read 10 tweets
Dec 11, 2025
For all the people who think Reserve Management Purchases are "QE" - look at this graph.

In an ample reserves system, Fed needs a certain amount of excess reserve assets as a % of bank deposits.

If they don't, a banking crisis could happen. And we're now at the point where reserves could be crossing the threshold from "ample" to "scarce".

Through November, excess reserves fell to 15% of bank deposits, now well below the 15-year average, indicating a tightening of conditions.

Which is why they are now ushering in incremental T-Bill purchases to keep bank reserve growth aligned with bank deposit growth.

In its current form, this it not QE.

However - if they were to expand the amount purchased, and/or buy longer dated securities, it would be QE.Image
1) There are several metrics you can use to gauge how much reserve liquidity the Fed needs in the system for their "ample reserves" regime - one is GDP, another is M2, but my personal favorite to gauge this is bank deposits.

During the pandemic, Excess Reserves (Bank Reserve + Reverse Repos) surged to 32% of all commercial bank deposits.

This was the "free money" era with massive QE that created the 2021-22 inflation.

Since then, with operation of QT, and general growth in the economy, the excess reserve ratio deleveraged down from 32% to 15%, indicating a tightening of conditions.
2) Of course - current conditions aren't noticeably "tight" - banks are still lending, the economy is still growing.

But there were some hiccups in overnight lending markets in recent months which suggested reserves were running low.

The Fed's Standing Repo Facility, after lying dormant for four years, had usage in November and December.

Indicating some funding stress in the market, that reserves were starting to run below "ample", at least for some market players.Image
Read 8 tweets
Dec 6, 2025
Why has the housing market been frozen since 2022?

Because the cost to buy a house with a mortgage (green) vaulted way above the a) cost to rent and b) the mortgage cost for existing owners.

The net result is that few people have a financial incentive to move. Cheaper to stay renting, cheaper to stay in current house/mortgage.

But - one interesting trend we are beginning to notice is the mortgage payment for existing owners (orange) is now growing faster than rent.

This is reversed from the post-pandemic period. Where sub-3% mortgages and still cheap taxes/insurance made for a very low cost to own for existing mortgage holders.

Now - taxes and insurance are up, and more of the mortgaged population is holding a 6%+ rate. So the costs for existing mortgage holders are rising.

This likely means we'll see more existing owners elect to sell in 2026, as it becomes less profitable for the average homeowner to rent out their house. And more profitable to cash out on your equity, sell, and rent for a bit until market corrects.

Translation: expect more for sale inventory, and more downward price pressure in the for sale market.Image
1) The other obvious conclusion from the graph above is that finding a way to drive down the cost to buy a house would help unlock the housing market.

e.g., the closer the Mortgage Payment to Buy goes to Monthly Rent and Mortgage Cost for Current Owners, the more home sale transactions will take place.

As the financial incentive to move increases.
2) But that's proving harder to do to than anticipated.

The Fed has cut rates by 1.50% over the last year+, and there has been no meaningful decline in Mortgage Rates.

Meanwhile - national prices are still at near a record high, even if values are dropping in some markets.
Read 13 tweets
Dec 6, 2025
Markets with the biggest rent deflation over the last 3 years:

Austin: -21%
Fort Myers: -19%
CoSprings: -15%
Phoenix: -14%
Raleigh: -13%
San Antonio: -12%
Atlanta: -11%
Denver: -11%

Expect apartments rents in these markets to continue declining in 2026, as vacancy rates remain elevated.

Good news for renters, bad news for investors who bought near the peak.Image
1) The deflationary rental environment, particularly in the Sun Belt area of America, is one reason why I believe we'll continue to see more inventory hit the market next year.

Simply put, many investors and landlords over-extended themselves during the pandemic boom, bought near peak values and low cap rates, and can't afford to hold properties through a declining rental environment.
2) And it's likely we continue to see waves of homes hit the market for rent next year as well.

For instance, take a look at this property north of Nashville.

It was bought for $370k in 2021 and the owner has now listed it for rent at $2,300/month.

That's a poor gross rent yield, and the underlying cap rate is probably only around 4-5%.

But the reason the owner is doing it is because they have a 2.9% mortgage rate, and a low $1,450/month mortgage P&I payment as a result.Image
Read 10 tweets
Dec 2, 2025
San Francisco is the strongest housing market in America right now.

Home sales are 12% above the long-term average.

While inventory is -28% below the long-term average.

The AI boom has flipped SF on its head, and Reventure is now forecasting rising prices over the next 12 months.

(note: where you don't want to be on the graph above is in the top left. That's very low demand, and very high supply).Image
1) Of course - let's not forget that San Francisco was one of the weakest housing markets in America since the pandemic.

With values dropping 14.7% since the middle of 2022, one of the stiffest corrections in the U.S.

The typical price of a condo/house in SF county is now $1.25 million, one of the highest in the U.S., but much cheaper than it was several years ago.Image
2) Due to this price correction, and continuously rising median income, Reventure now has San Francisco County tabbed as 17% undervalued compared to its fair value.

This means that San Francisco is a buy from a value standpoint, and that it's likely the correction is over, and that values will rise from here.Image
Read 4 tweets
Nov 26, 2025
Pending home sales in October 2025 came in -1.2% below last year, and -27% below the long-term average.

Today's contract signings are at the lowest level in 30+ years - even worse than the GFC - and showing no noticeable signs of improvement (even after 6 Fed rate cuts and a big spike in inventory)

Suggesting there's major structural inertia in housing right now. The market is unaffordable, overpriced, and cheaper to rent - and as a result homebuyers are fundamentally disinterested.

On top of that - many households are now delaying family formation and electing not to have kids, which further reduces the urgency to buy.

Sellers who are delisting their houses right now, in hopes of an improved market in 2026, could be making a big mistake.

Access Reventure's Price Forecast for your city and ZIP at reventure.app.Image
1) I can't stress enough how crazy it is that NAR's Pending Sales figures just came in -1.2% below last year.

Remember - last year at this time, we only had one double rate cut.

Since then, we've had another 4 quarter point rate cuts

And demand went down!
2) On top of that, inventory has gone up over 15% since last year, and we now have the most homes for sale since pre-pandemic in South/West.

Plus prices dropping in half the U.S.

And demand is still going down.
Read 15 tweets

Did Thread Reader help you today?

Support us! We are indie developers!


This site is made by just two indie developers on a laptop doing marketing, support and development! Read more about the story.

Become a Premium Member ($3/month or $30/year) and get exclusive features!

Become Premium

Don't want to be a Premium member but still want to support us?

Make a small donation by buying us coffee ($5) or help with server cost ($10)

Donate via Paypal

Or Donate anonymously using crypto!

Ethereum

0xfe58350B80634f60Fa6Dc149a72b4DFbc17D341E copy

Bitcoin

3ATGMxNzCUFzxpMCHL5sWSt4DVtS8UqXpi copy

Thank you for your support!

Follow Us!

:(