
I just want to do a very quick run through the latest up to date charts of rates of sickness absence in *young* doctors here.
Yeah. This is still *really* important, and I'll explain why in a moment.
Yeah. This is still *really* important, and I'll explain why in a moment.
There are some really really important points before I get on to the graphs.
First off - these are young doctors in their mid to late 20s.
'F1s' and 'F2s' and 'Core Training' doctors.
There may be a very tiny number of older F1s and F2s, but *they're rare*.
'F1s' and 'F2s' and 'Core Training' doctors.
There may be a very tiny number of older F1s and F2s, but *they're rare*.
⚠️So they're not old. They are not 'an aging population'.
And they're not all 'from abroad'.
Most F1s (90-95% from year to year) are trained here in medical schools in England.
Most F1s (90-95% from year to year) are trained here in medical schools in England.
⚠️So these aren't people 'coming into the UK from abroad with foreign illnesses'.
And the people who are F1s and F2s *now* are not the people who were F1s and F2s *six years ago*. This is really really important.
Often you hear people say that 'healthcare workers are burned out because of the pandemic'.
⚠️These most recent cohorts were sitting their A-Levels during the first stage of the pandemic. They only started working in hospitals last year - but they are already sicker *in their first month* than the previous year's cohort.
Do you understand that and why it's so important?
When I show you a chart of F1s sickness absence, it isn't the same people each year.
It's different people each year, and each subsequent group of people is sicker than the last.
It's different people each year, and each subsequent group of people is sicker than the last.
Not because they're an aging population.
They're not.
They're not.
Not because they're from countries where people are less healthy.
They're not.
They're not.
Not because they're burnt out.
They're not.
They're not.
They *arrive in work sicker*.
Let me show you:
Here.
(Don't look at the large jags on the red line - the new cohort of F1s start every August, and the stats get messed up.)
Look at the black line which is the rolling six month average.
Look at the steady climb.
(Don't look at the large jags on the red line - the new cohort of F1s start every August, and the stats get messed up.)
Look at the black line which is the rolling six month average.
Look at the steady climb.
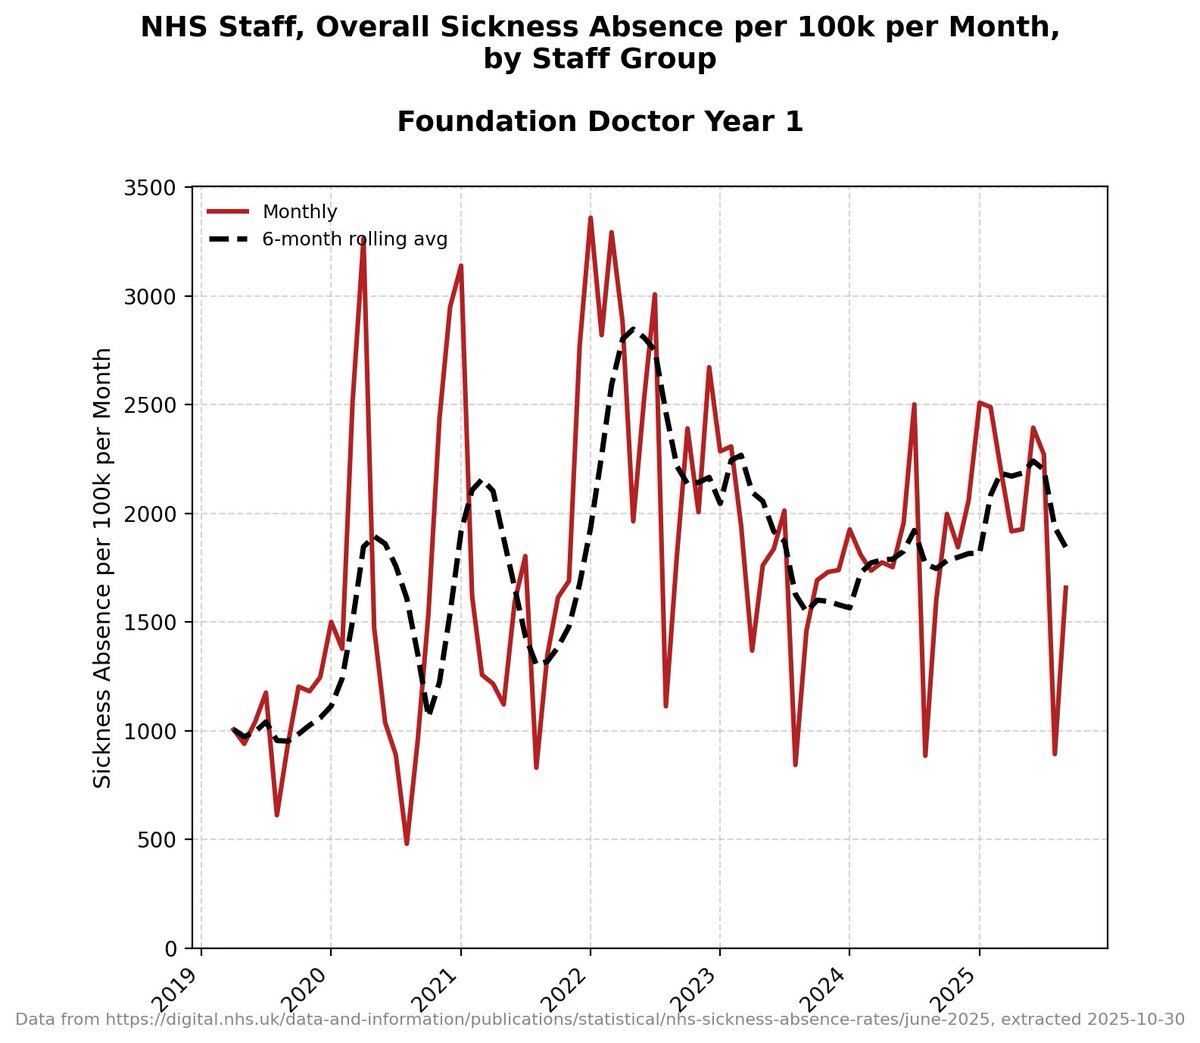
Do you see that?
They're now off sick nearly twice as much as they used to be.
They're now off sick nearly twice as much as they used to be.
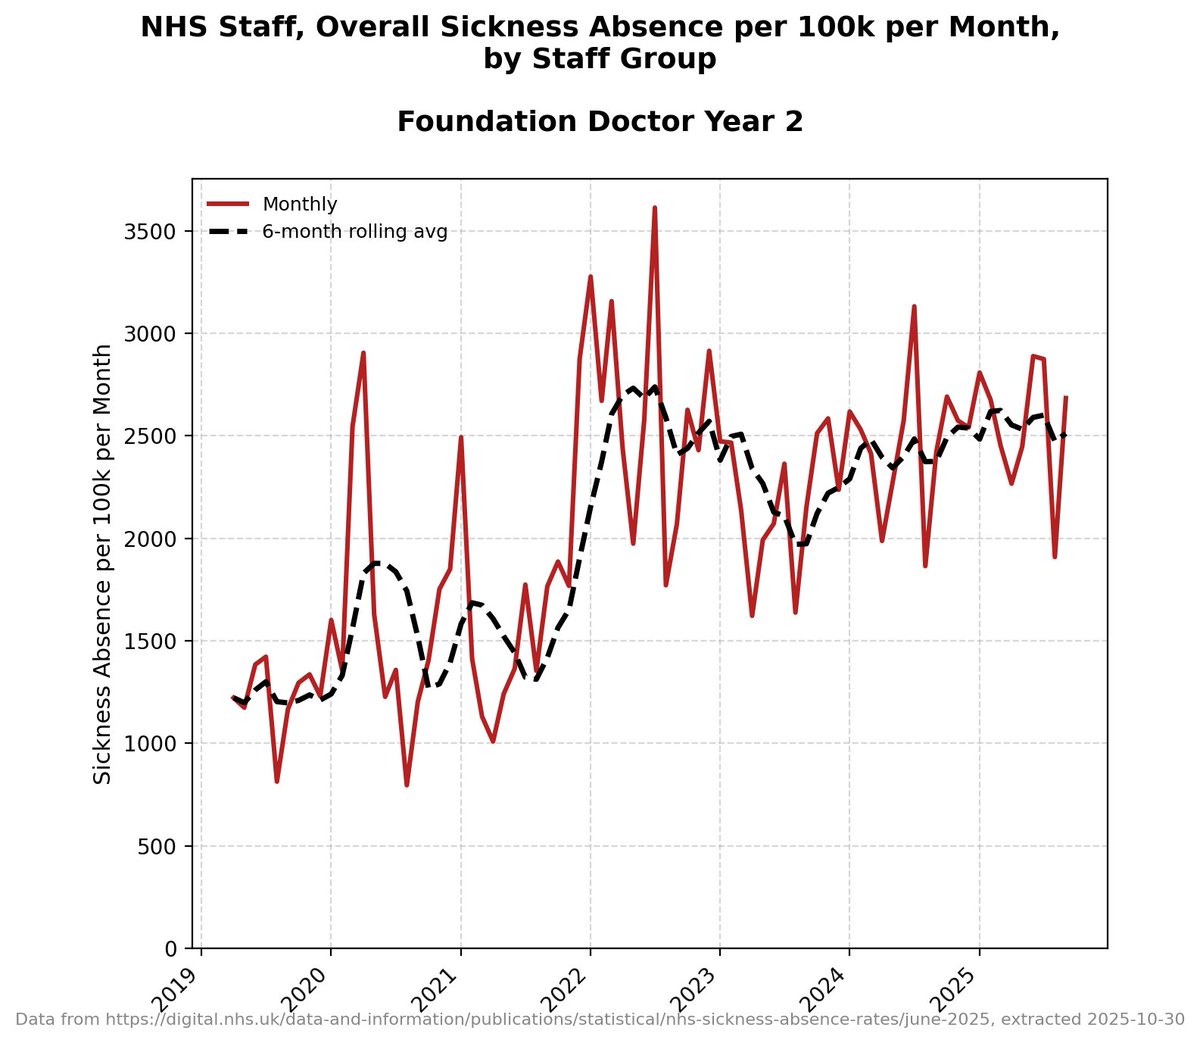
And here's F2s.
They now *are* off sick twice as much as they used to be.
Remember: a different cohort each year.
They now *are* off sick twice as much as they used to be.
Remember: a different cohort each year.
It's worth pointing out that there isn't this granular detail for each band of doctors in the NHS data - this detail only starts in 2019 - but all other data *suggests* that before 2019 these absences were *very consistent and level*.
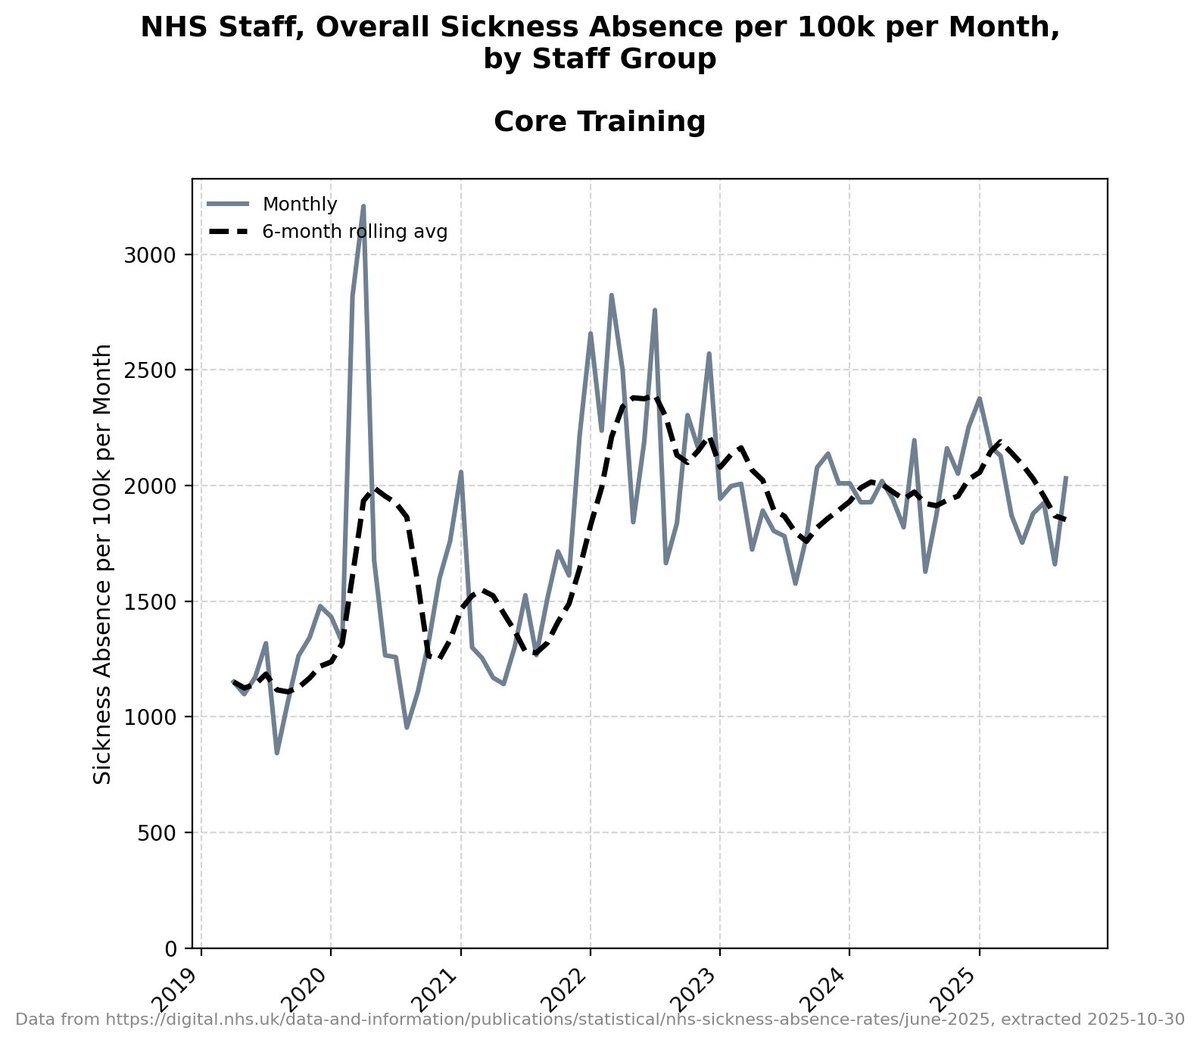
Doctors in Core Training, the next stage after F1s and F2s.
Off sick nearly twice as much now.
Off sick nearly twice as much now.
Now... *why* are they off sick...
Minimisers try to say that 'the most common reason for sickness absence is stress' and 'the pandemic caused burnout'.
But again *remember that these F1s are totally fresh*.
No experience of working in hospitals in 2020/21/22.
Minimisers try to say that 'the most common reason for sickness absence is stress' and 'the pandemic caused burnout'.
But again *remember that these F1s are totally fresh*.
No experience of working in hospitals in 2020/21/22.
Yeah.
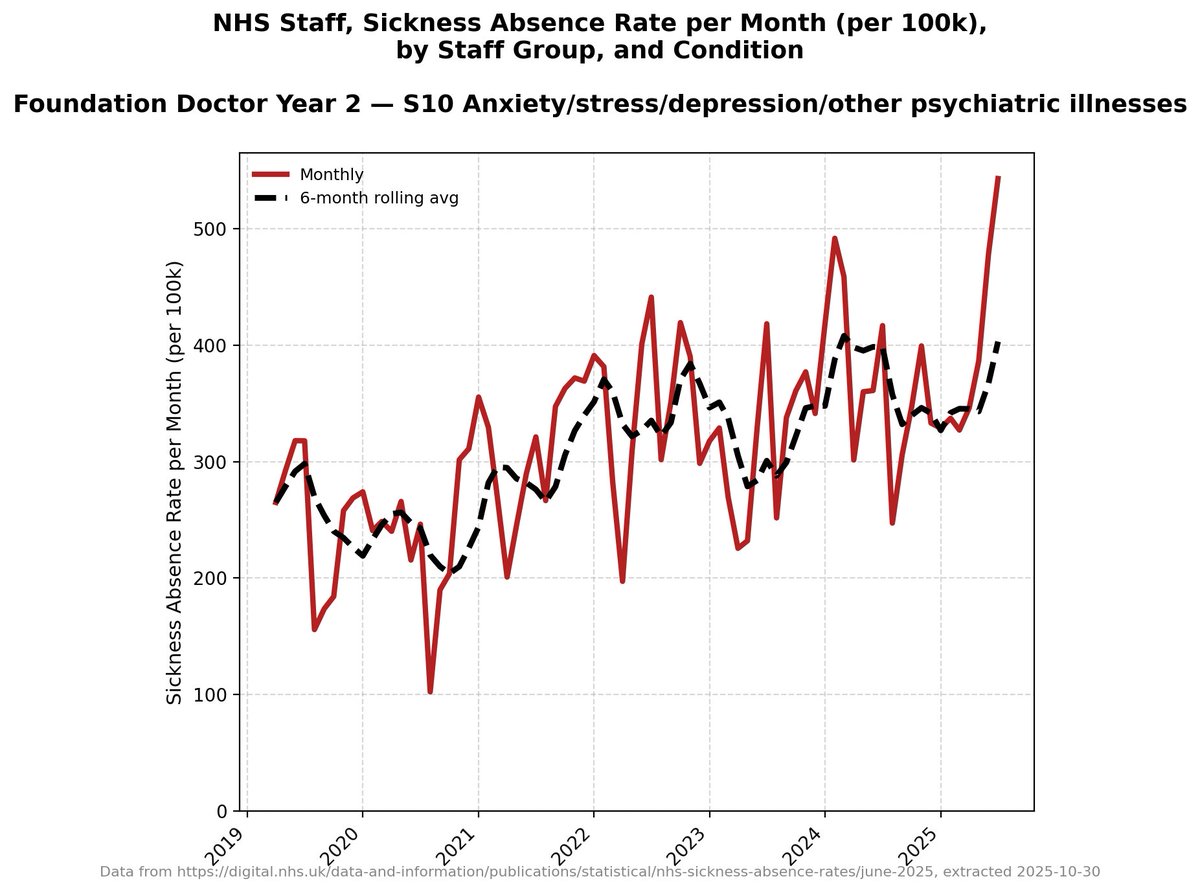
F1s are now more likely to be off sick with anxiety/stress/depression/other psychiatric illness than they used to be - but it's less than 20% of the total... but also all those conditions are *mental health symptoms* that can be caused by *physical infections*.
F1s are now more likely to be off sick with anxiety/stress/depression/other psychiatric illness than they used to be - but it's less than 20% of the total... but also all those conditions are *mental health symptoms* that can be caused by *physical infections*.
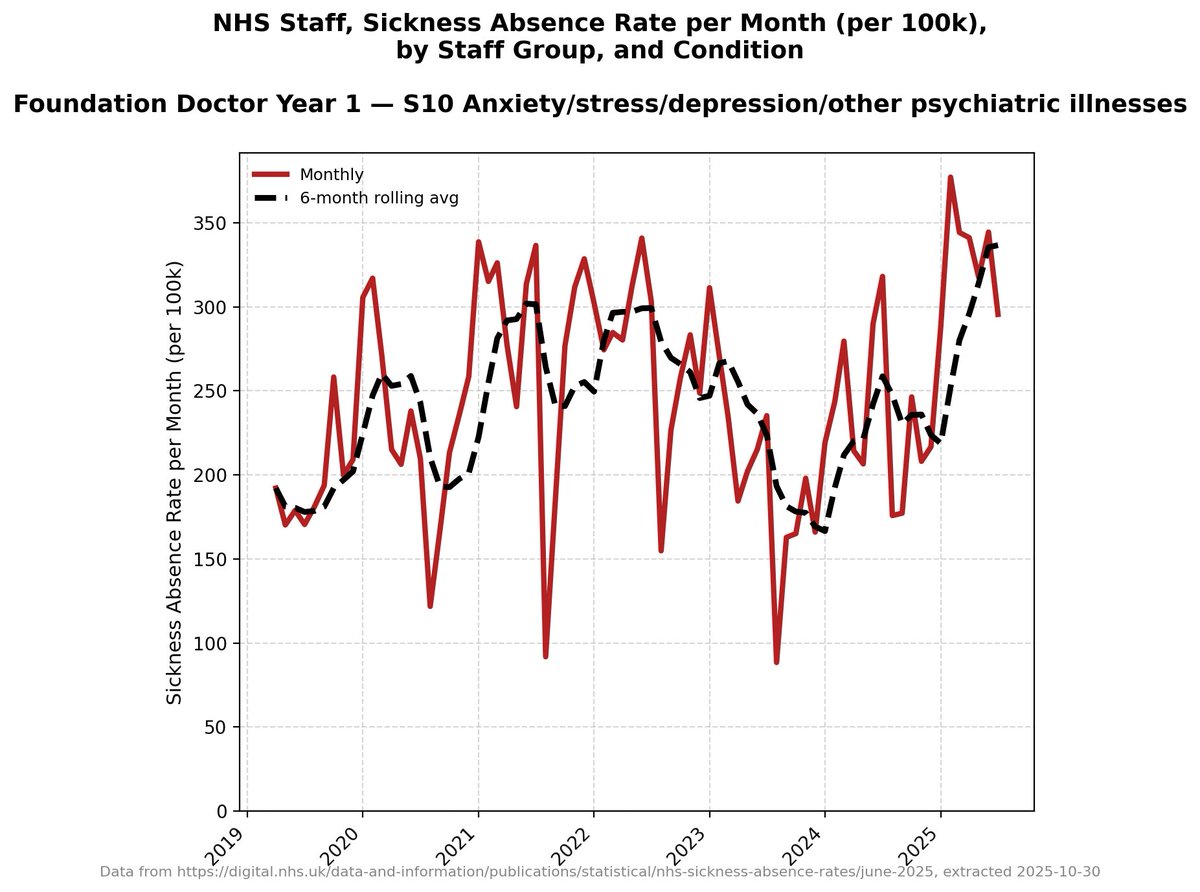
And 'cold cough flu' (which covers a lot of ground) accounts for nearly twice as many sick days.
So in these new doctors stress/anxiety/depression is *not* the main reason for sickness absence.
So in these new doctors stress/anxiety/depression is *not* the main reason for sickness absence.

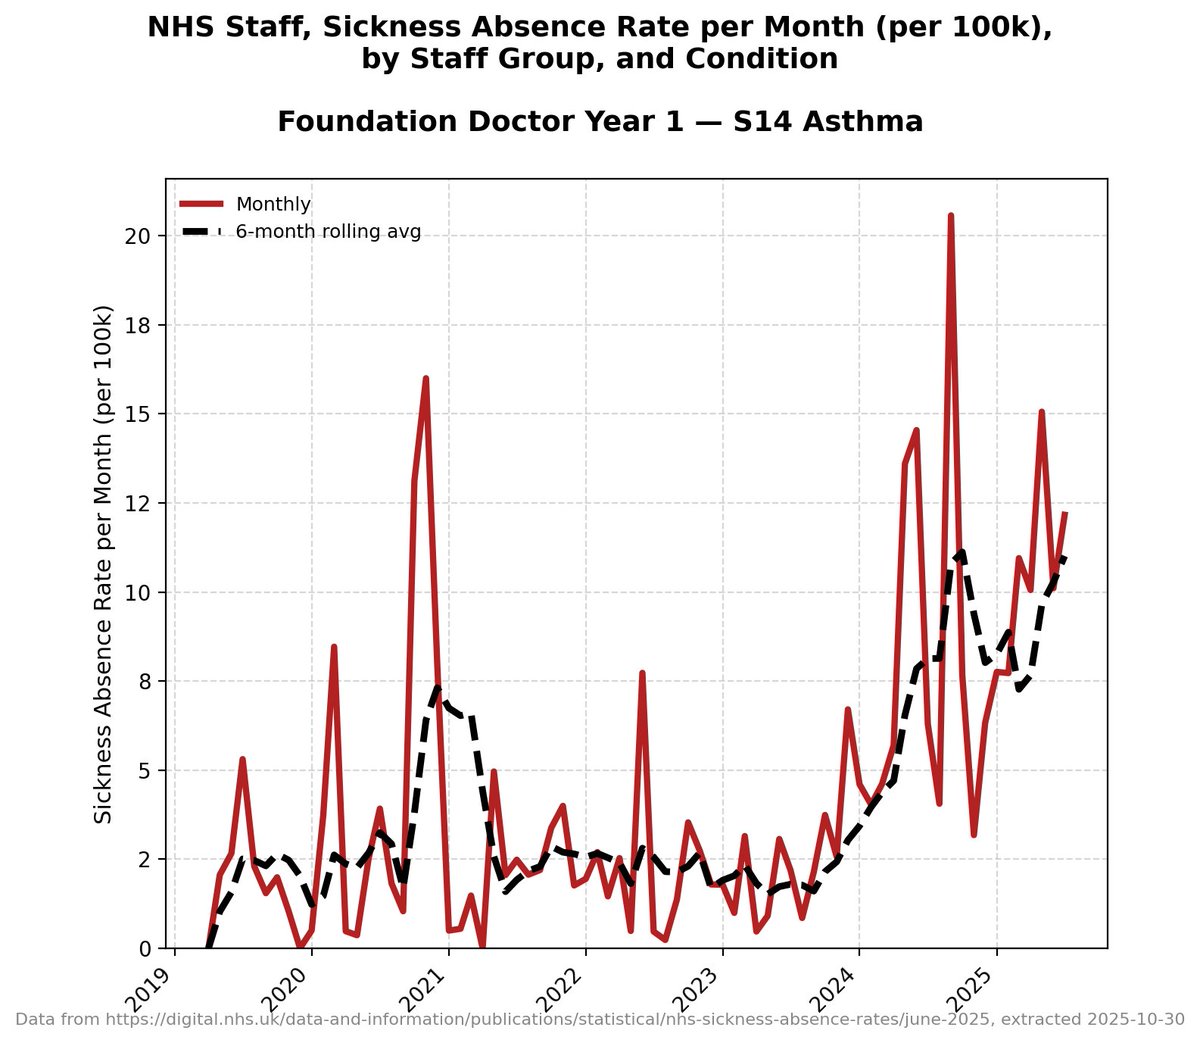
And Asthma 👀
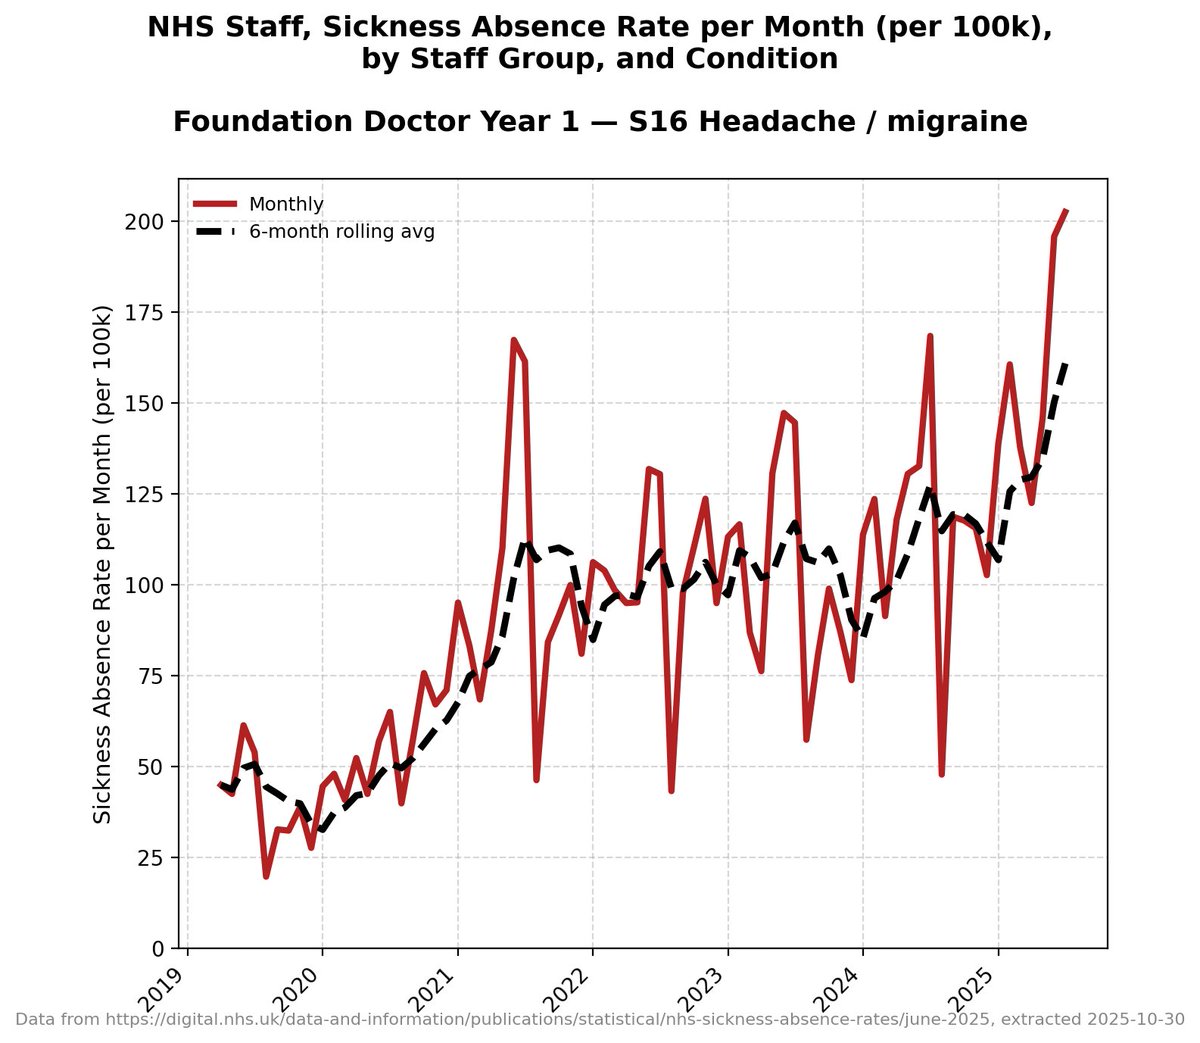
And 'headache/migraine'
👀
😮
Even F1s in their *very first month of work* are more likely than ever before to be off sick with this.
That's astonishing.
👀
😮
Even F1s in their *very first month of work* are more likely than ever before to be off sick with this.
That's astonishing.
Ear/Nose/Throat.
😕
😕

Again... these graphs are *rates*, so this isn't because there are more staff.
This is adjusted for the number of staff.
This is adjusted for the number of staff.
Dental and Oral Problems.
😬
😬
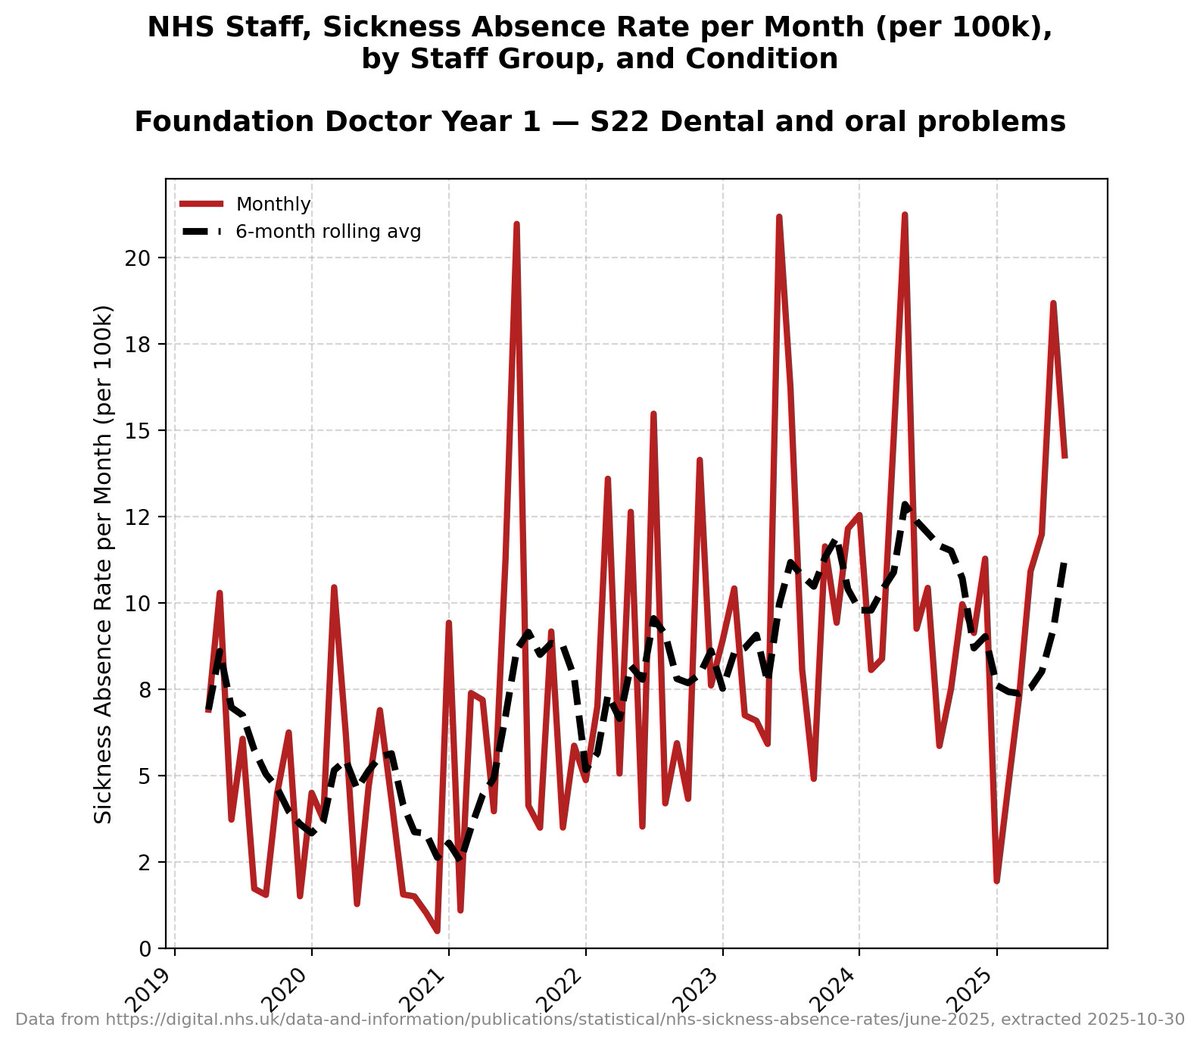
Not massive numbers... but the numbers that there are have more than doubled.
*in young doctors*
*in young doctors*
Now this one is a wtf.
Remember.
This is in people in their very first year of employment.
They're so much worse than people in 2019.
Just mindbending.
Gastrointestinal problems.
Remember.
This is in people in their very first year of employment.
They're so much worse than people in 2019.
Just mindbending.
Gastrointestinal problems.
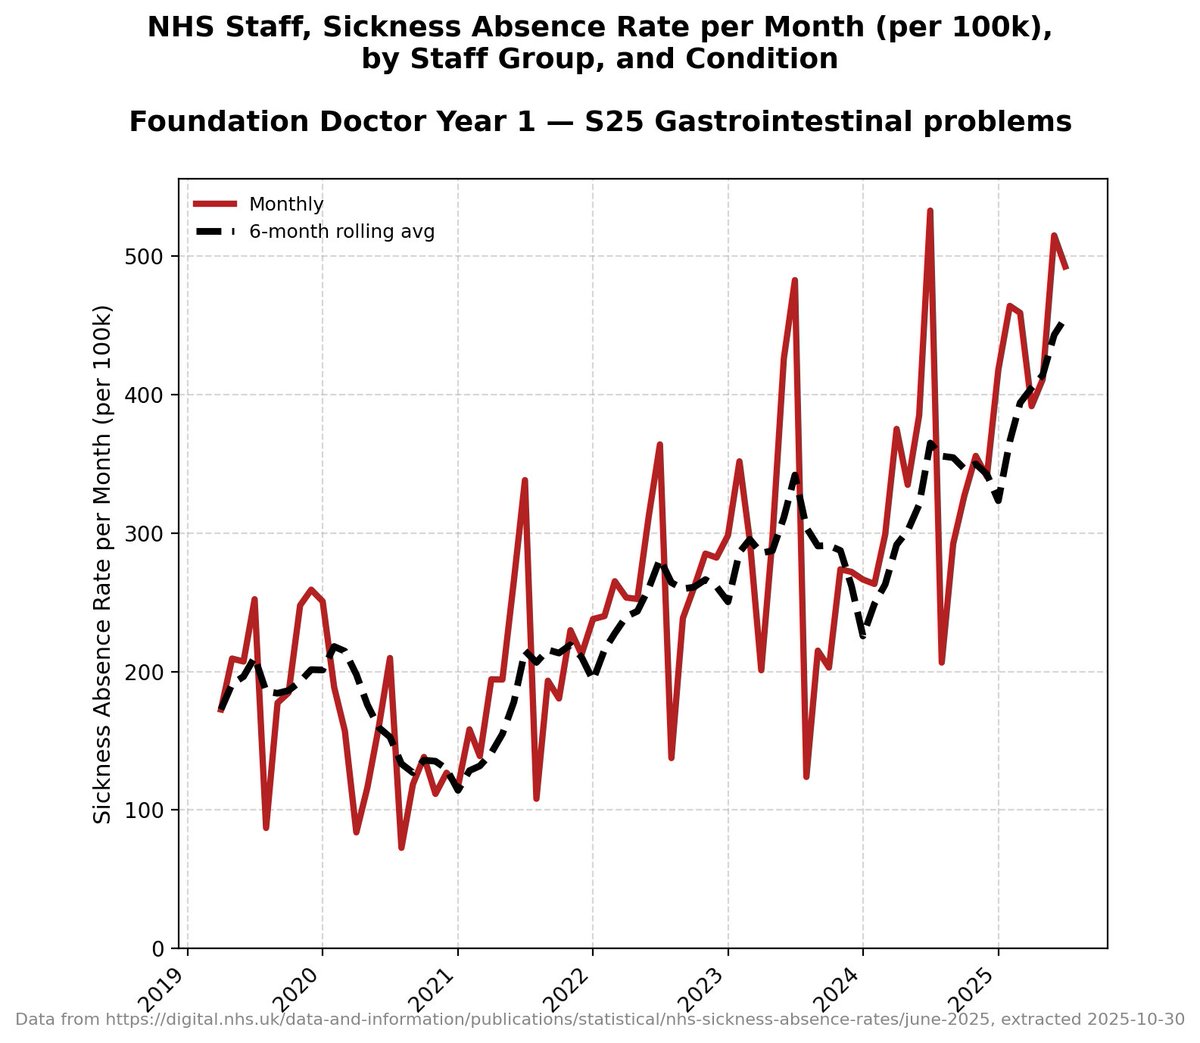
Seriously wtf.
But then this....
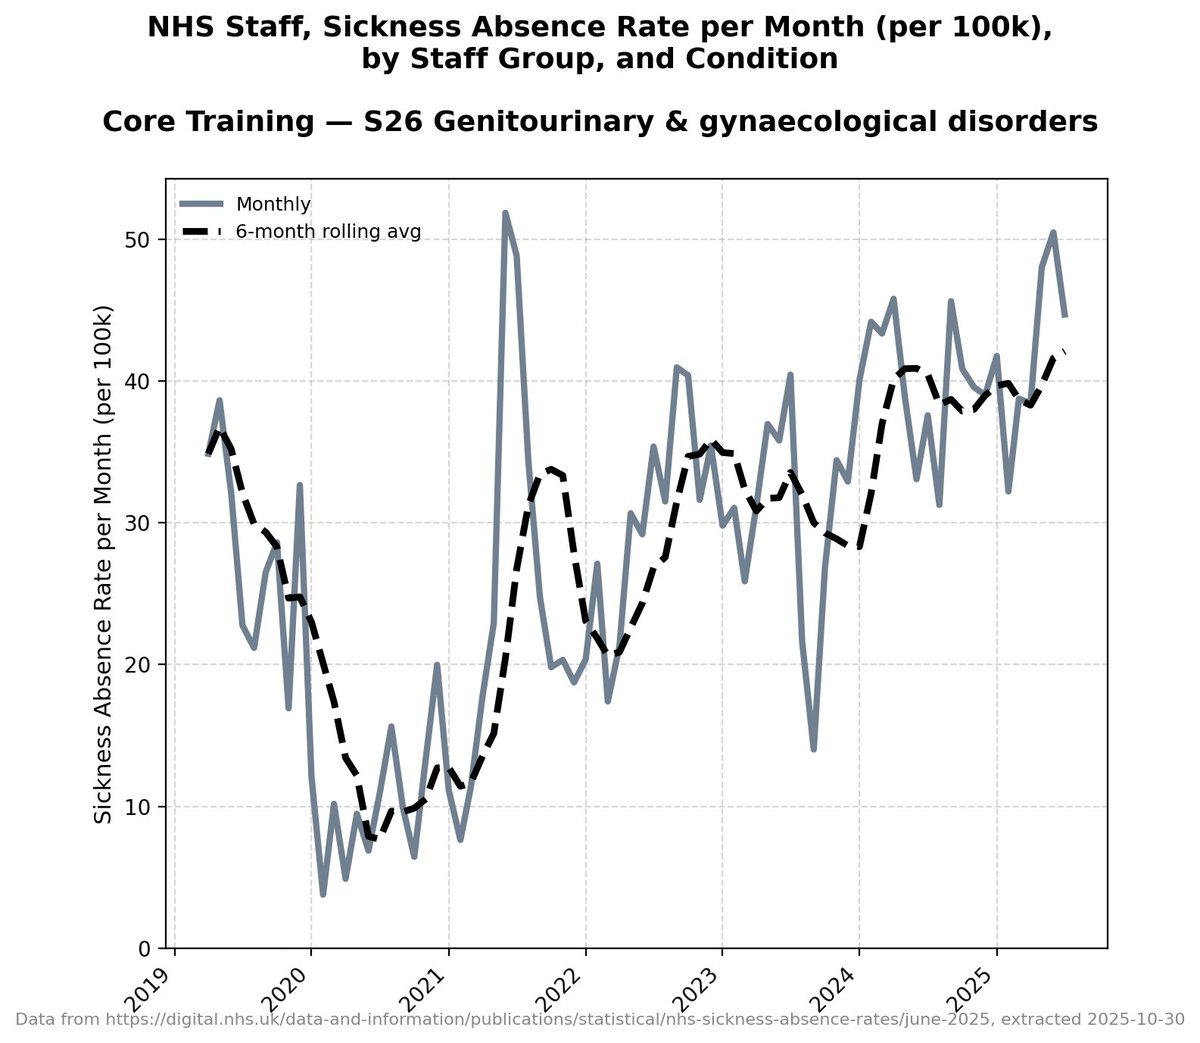
Genitourinary and gynaecological disorders.
👀
Genitourinary and gynaecological disorders.
👀
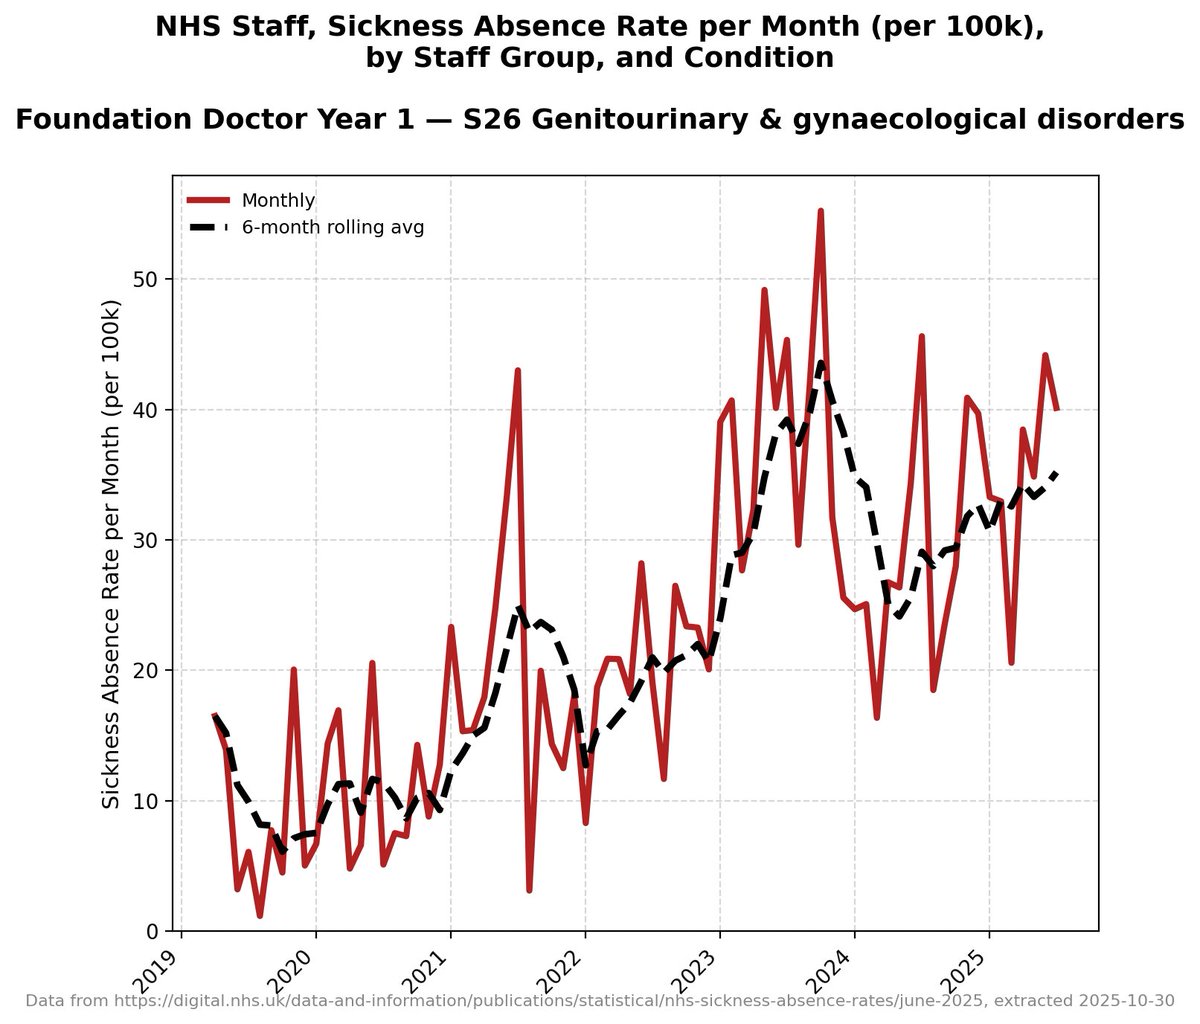
Is this representative of these problems in people in their mid 20s right the way across different industries and across the country?
This one's odd.
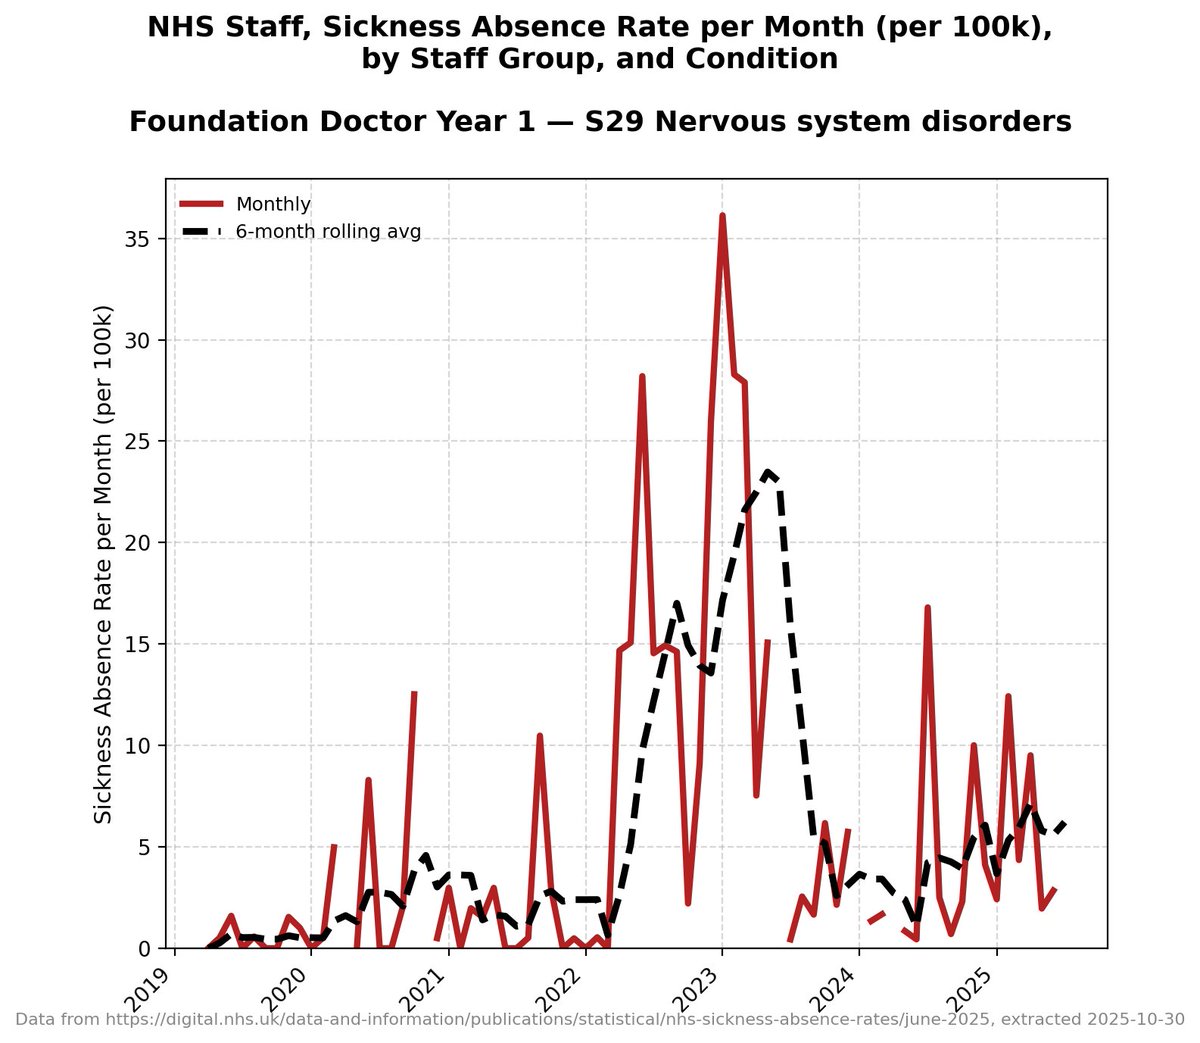
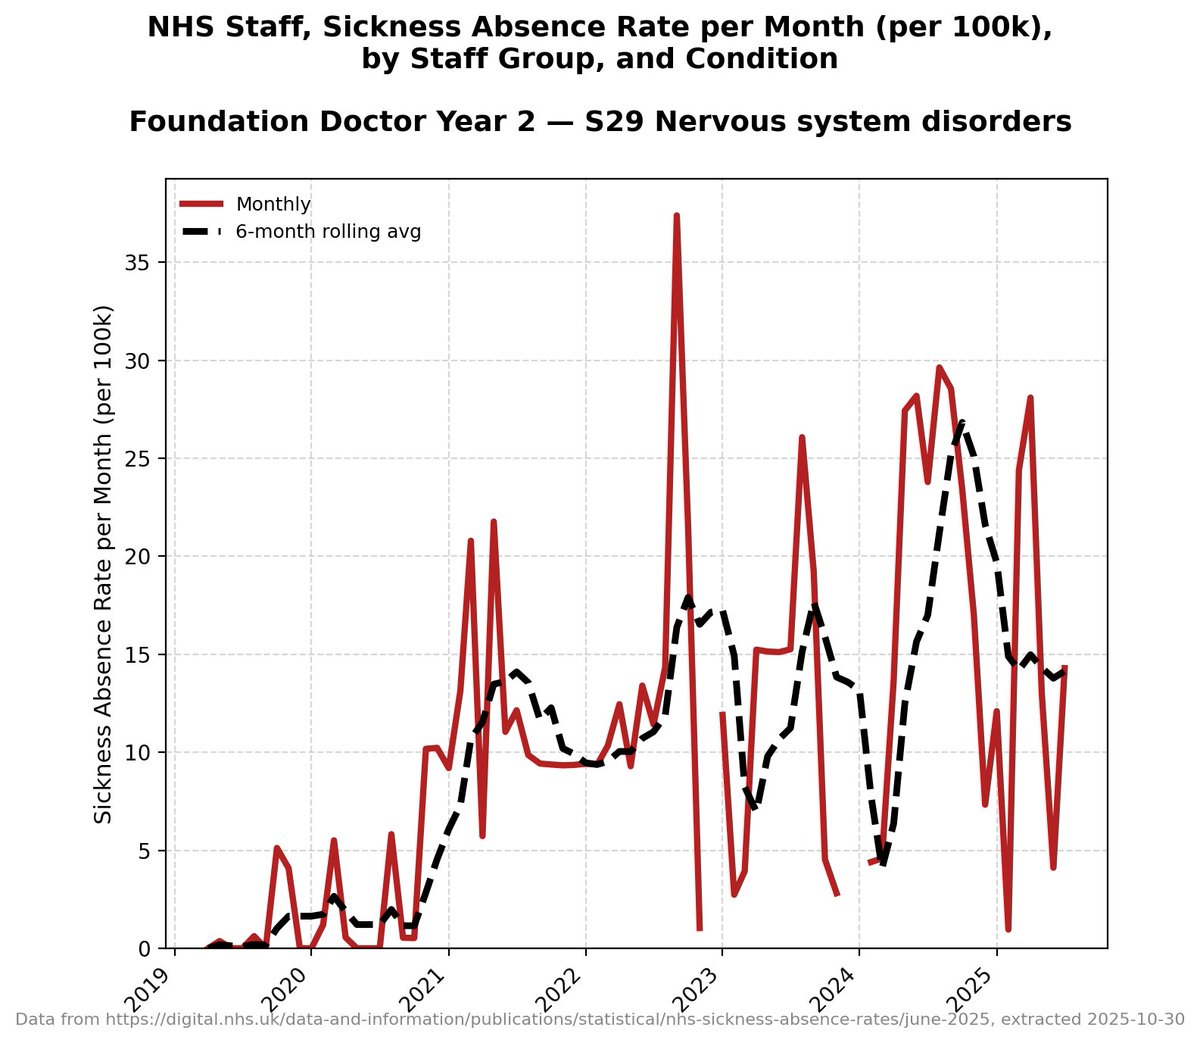
Very low numbers for nervous system disorders, thankfully... but there's a trend there still.
Very low numbers for nervous system disorders, thankfully... but there's a trend there still.
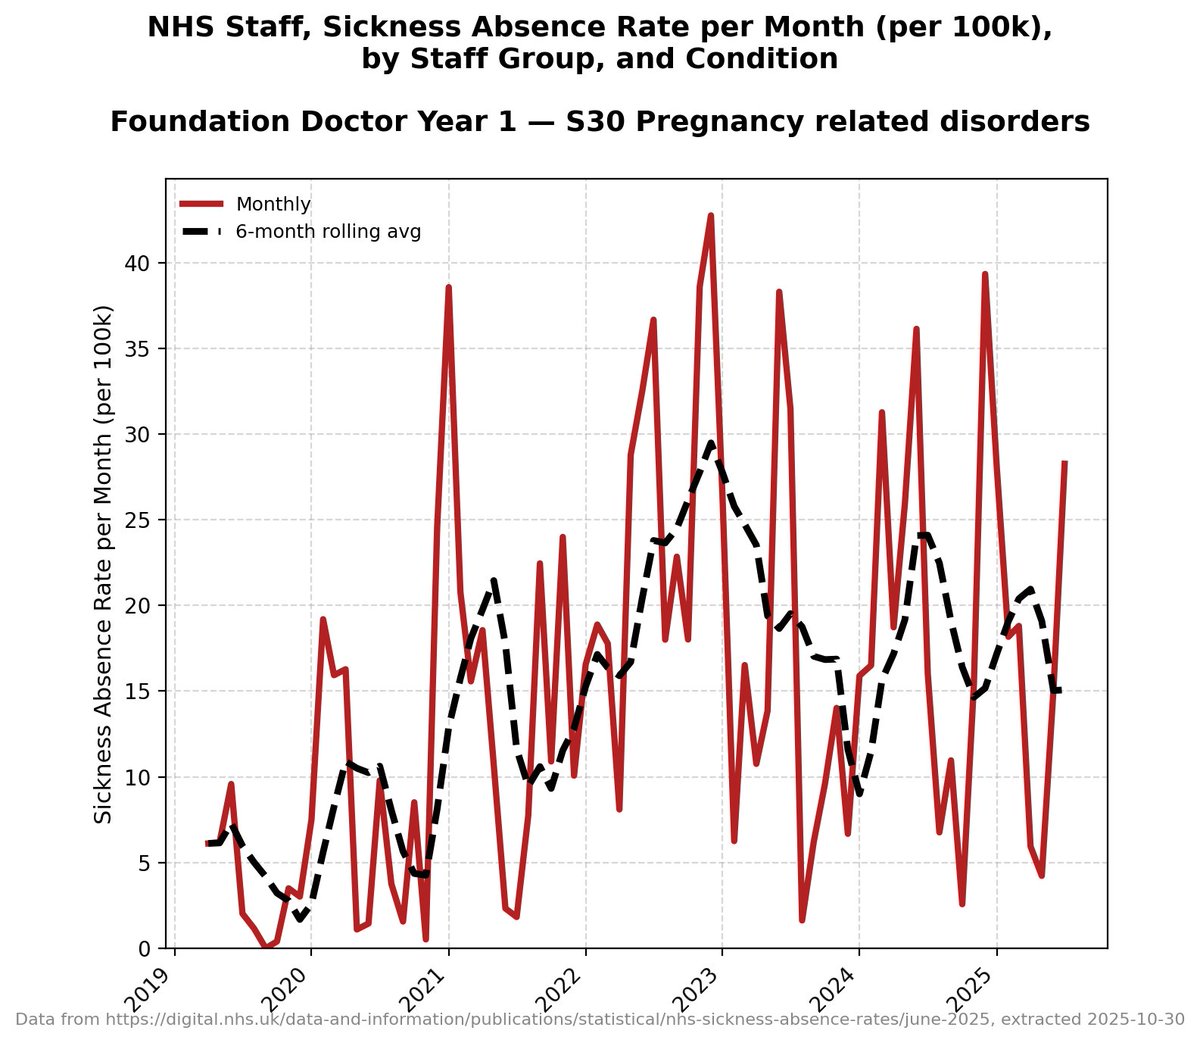
This one's heartbreaking.
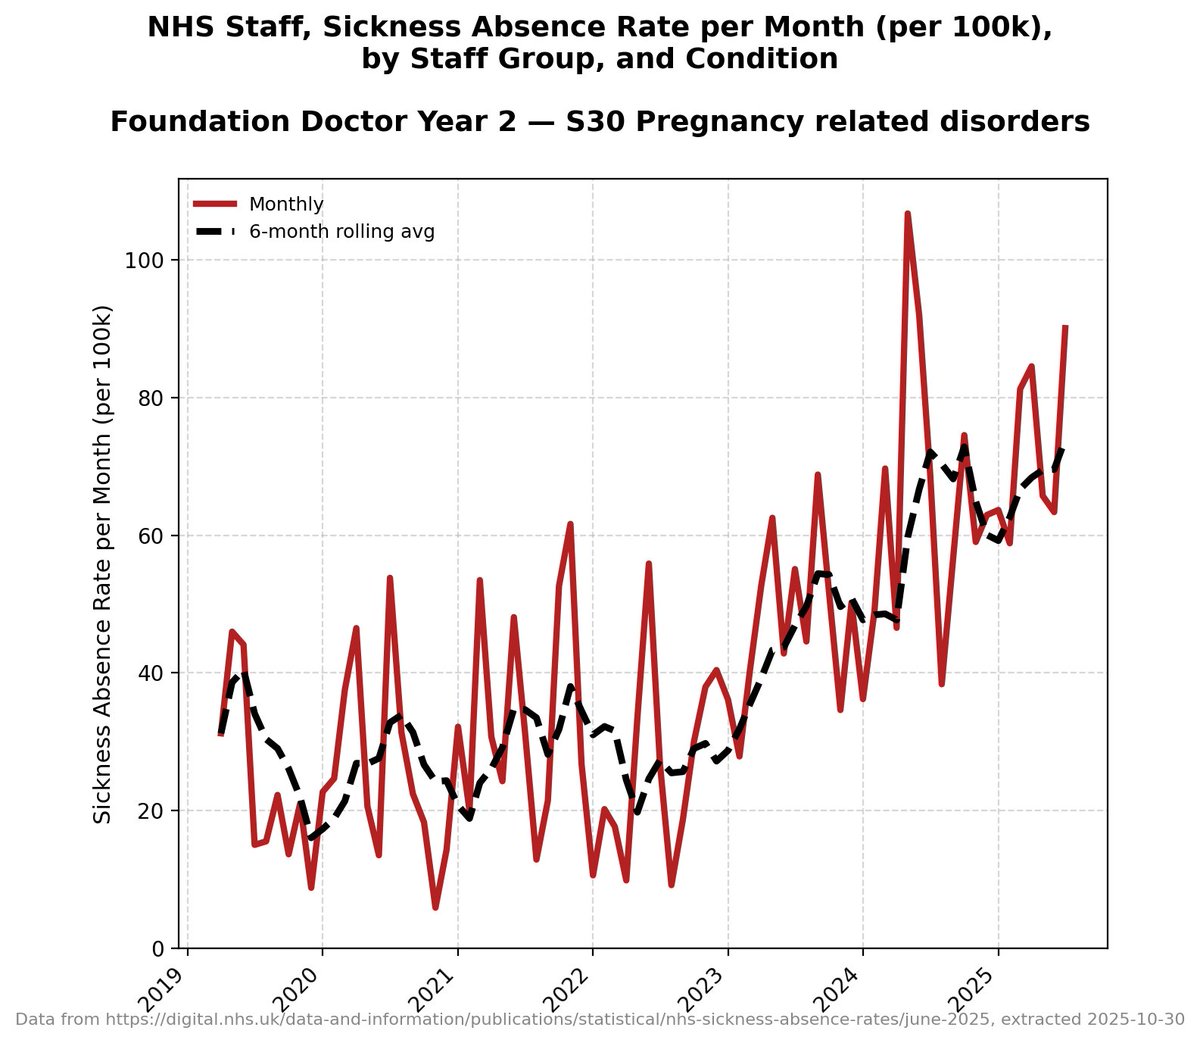
Very low numbers again for pregnancy related disorders in this age group... but we'll come back to this code again with the F2s and Core Training.
Remember this one.
Very low numbers again for pregnancy related disorders in this age group... but we'll come back to this code again with the F2s and Core Training.
Remember this one.
Skin disorders.
We'll come back to this one too.
We'll come back to this one too.

Again, the most recent batch of these F2s have only been working for *one year*.
They started one year ago.
And look at the increased prevalence of these conditions *already*.
Anxiety/stress/depression in F2s.
They started one year ago.
And look at the increased prevalence of these conditions *already*.
Anxiety/stress/depression in F2s.
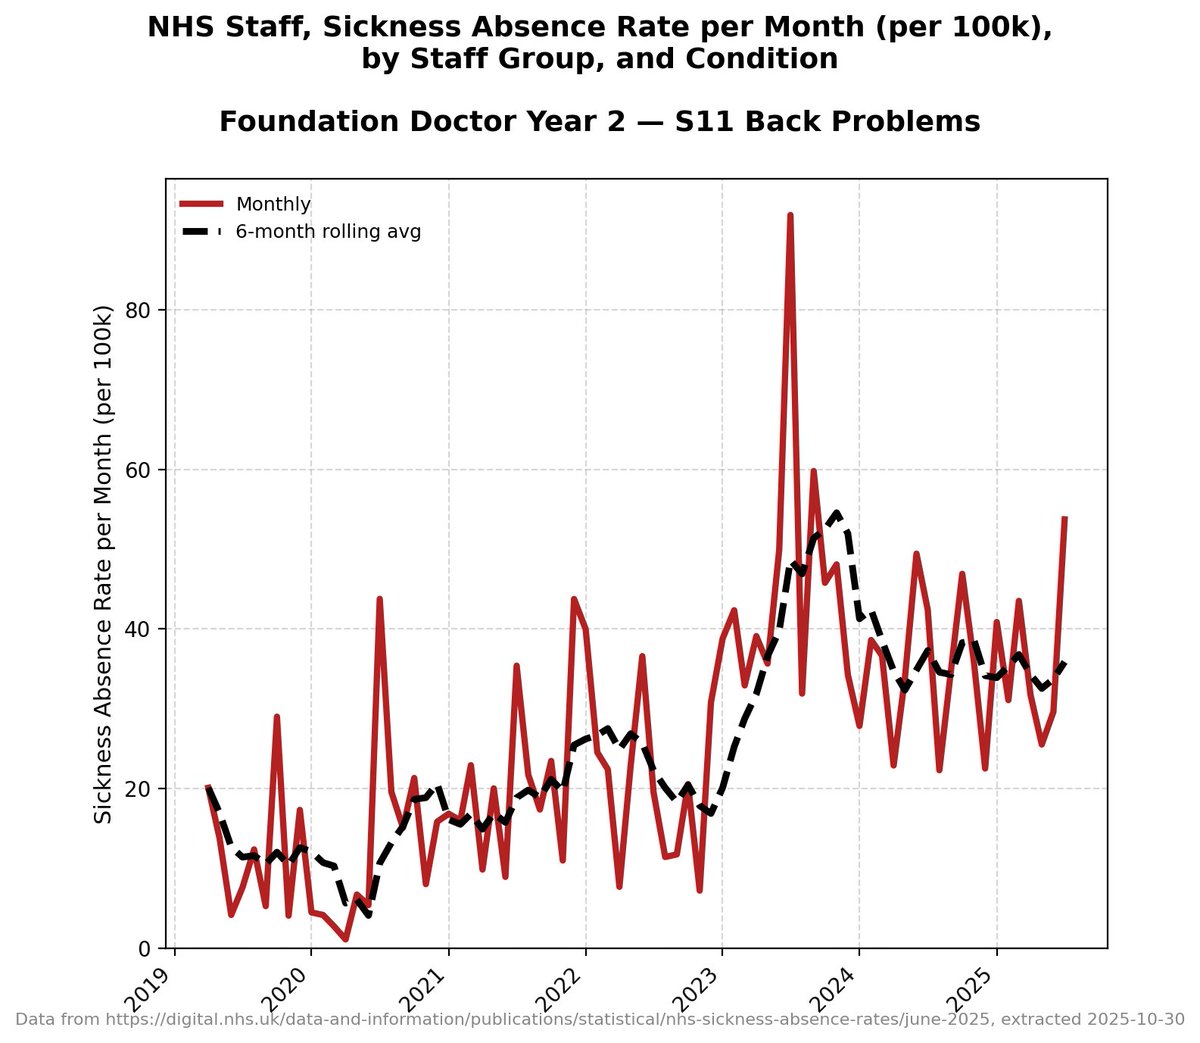
And they seem to either have not been paying attention during manual handling training, or are having problems with their musculoskeletal systems.
Backs:
Backs:
And they are *definitely* having problems with their immune systems.
Three times as likely to be off with
Cold/cough/flu:
Three times as likely to be off with
Cold/cough/flu:

And in their guts too.
Would you look at that.
CAN YOU SEE THE SHAPE OF THAT GRAPH.
Gastrointestinals in F2s:
Would you look at that.
CAN YOU SEE THE SHAPE OF THAT GRAPH.
Gastrointestinals in F2s:
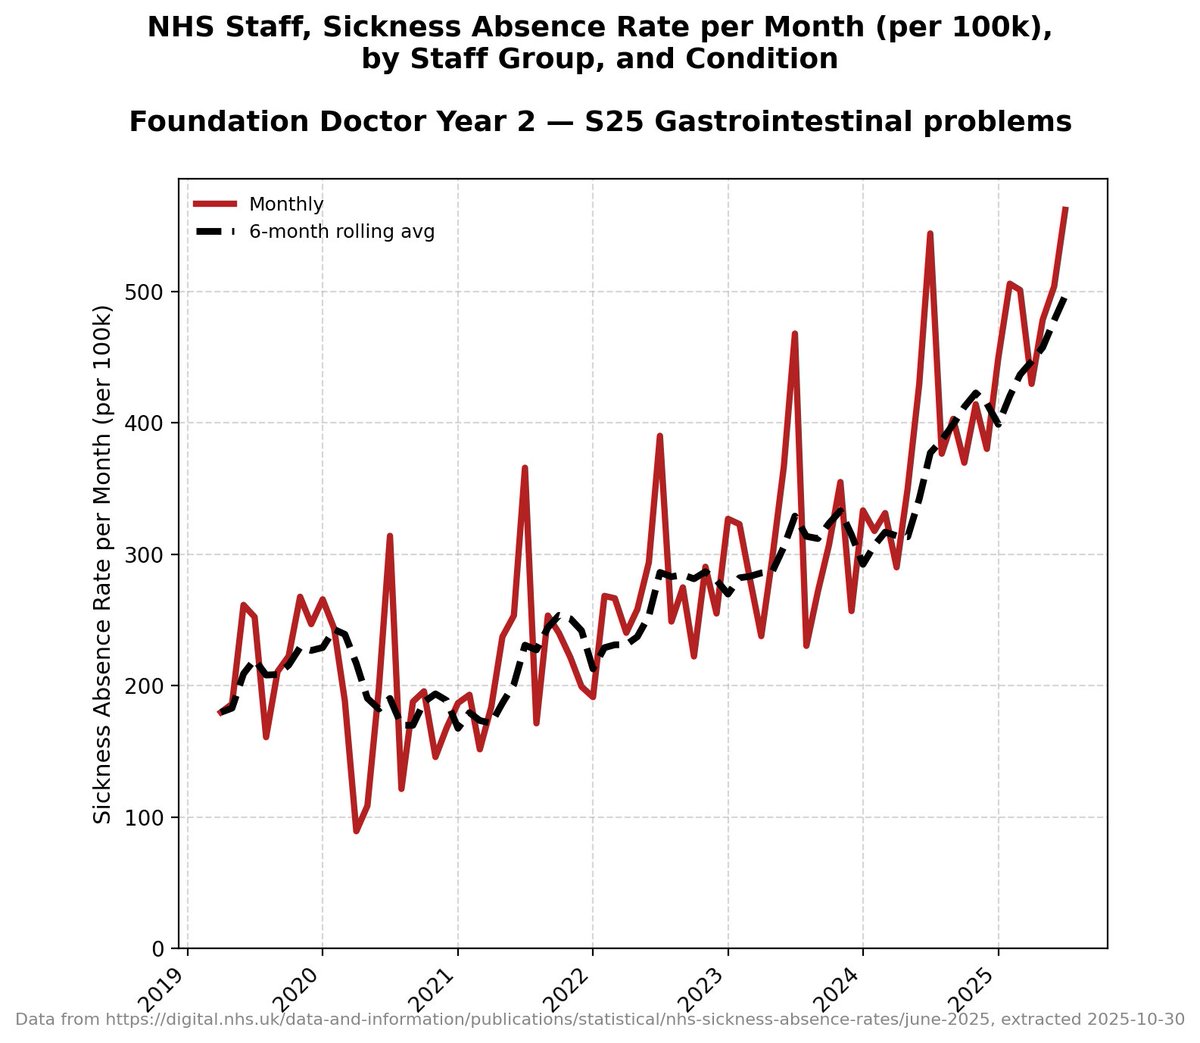
😢
Genitourinary and gynaecological:
Genitourinary and gynaecological:
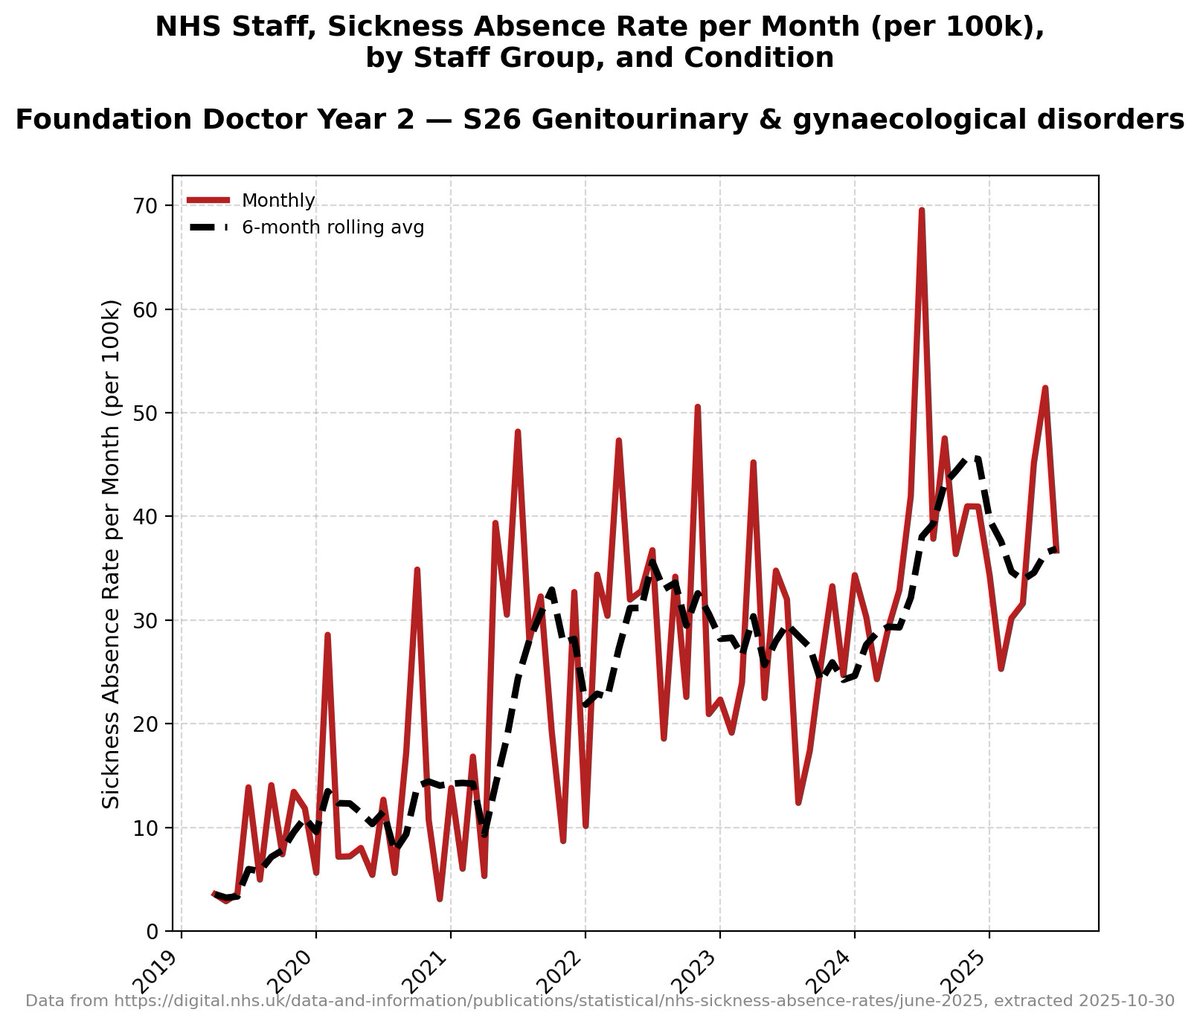
Interesting.
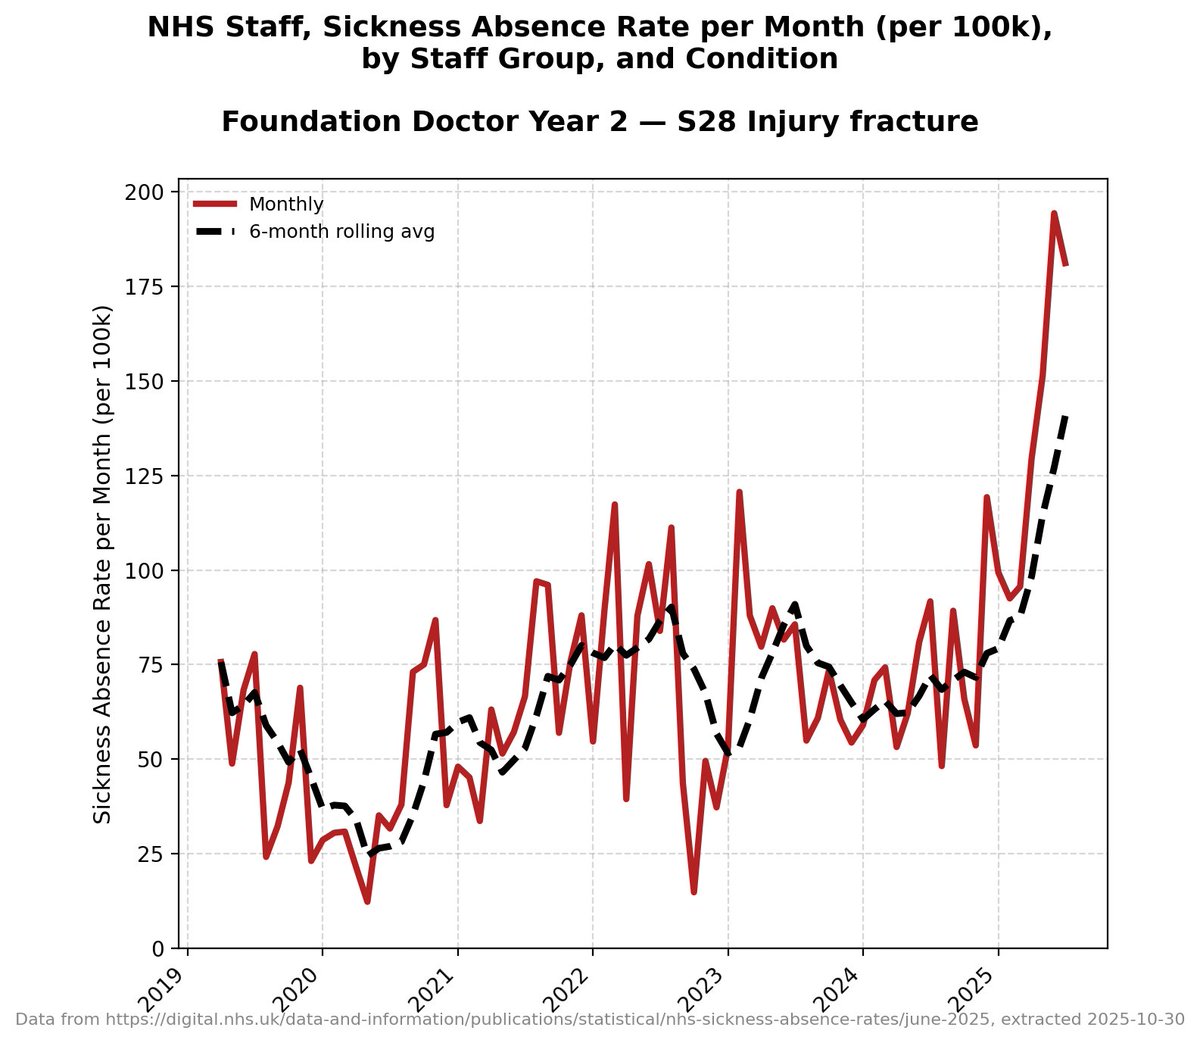
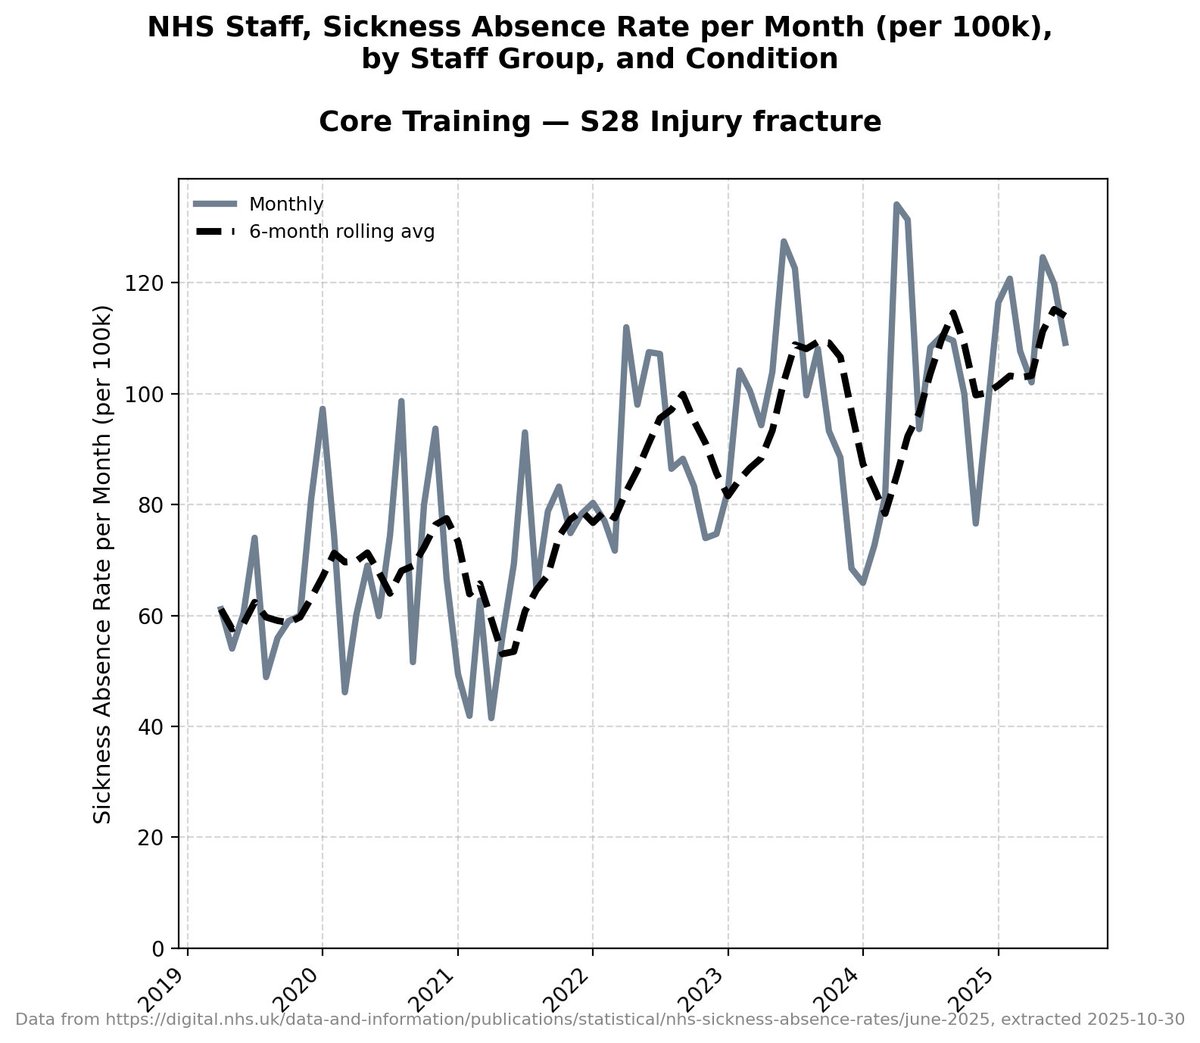
Fractures.
🤔
Fractures.
🤔
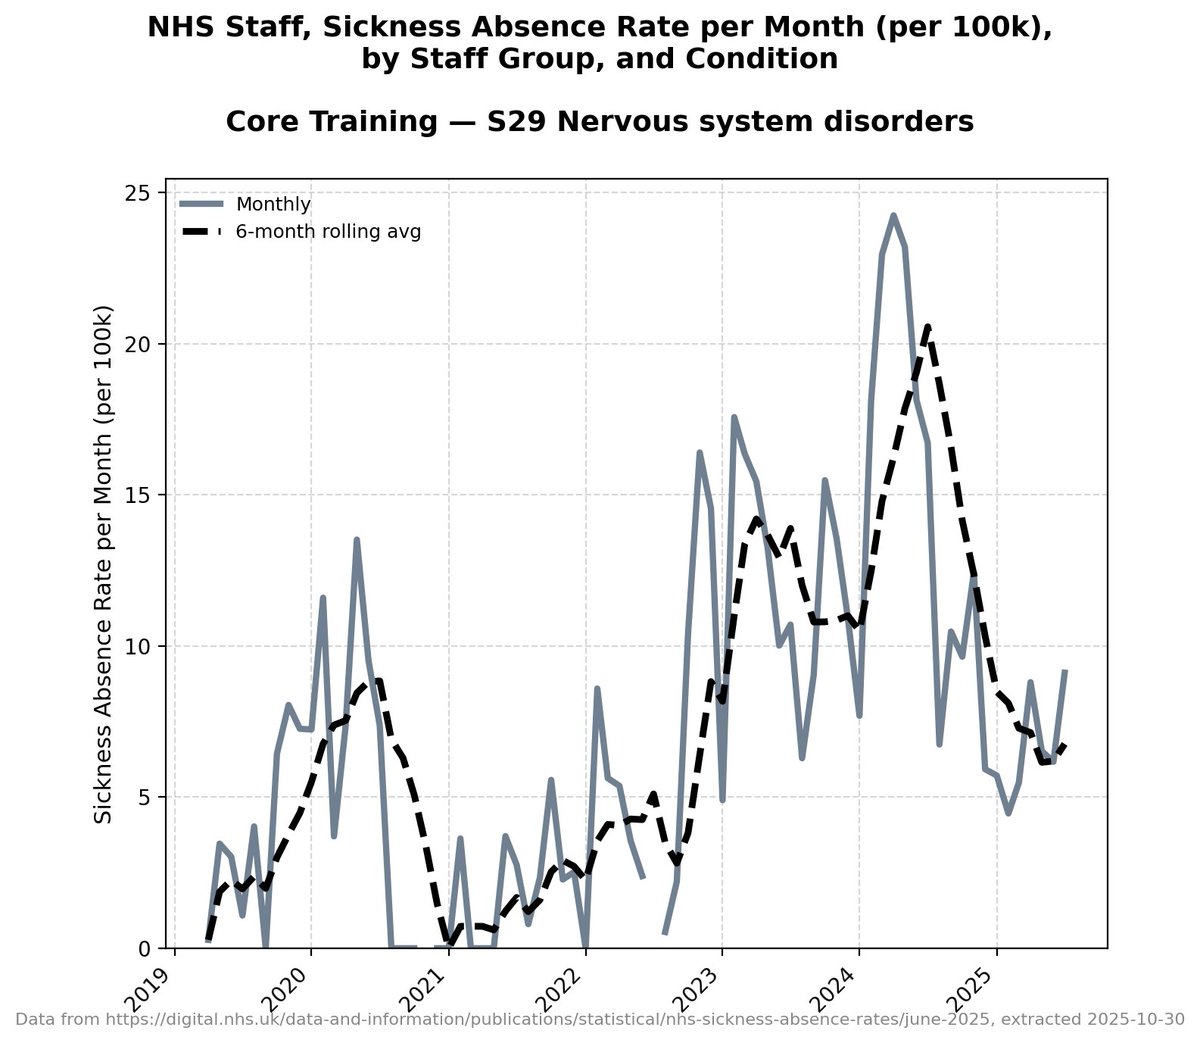
Nervous system disorders.
🧐
🧐
Oh boy.
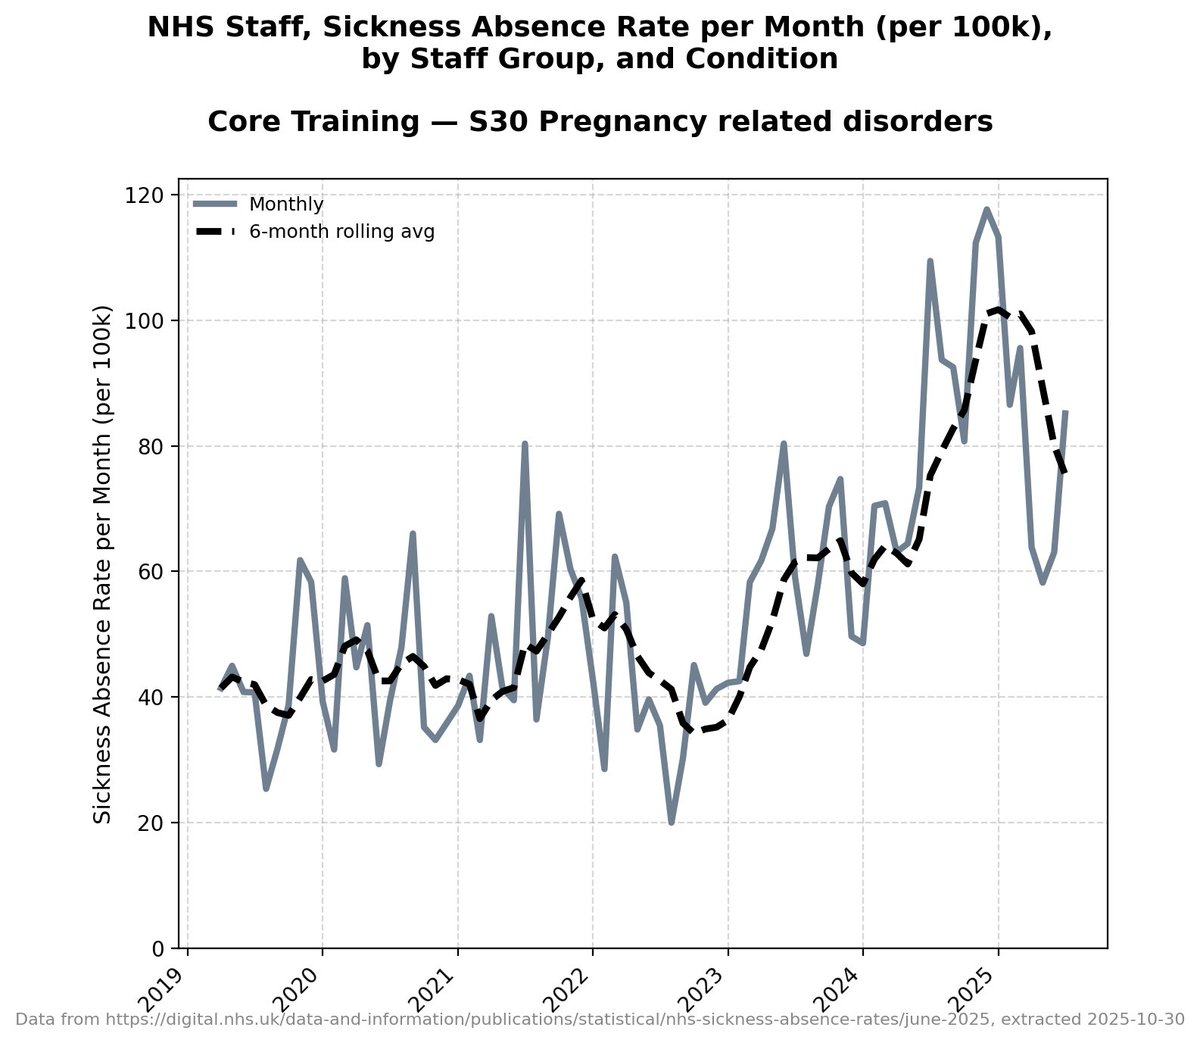
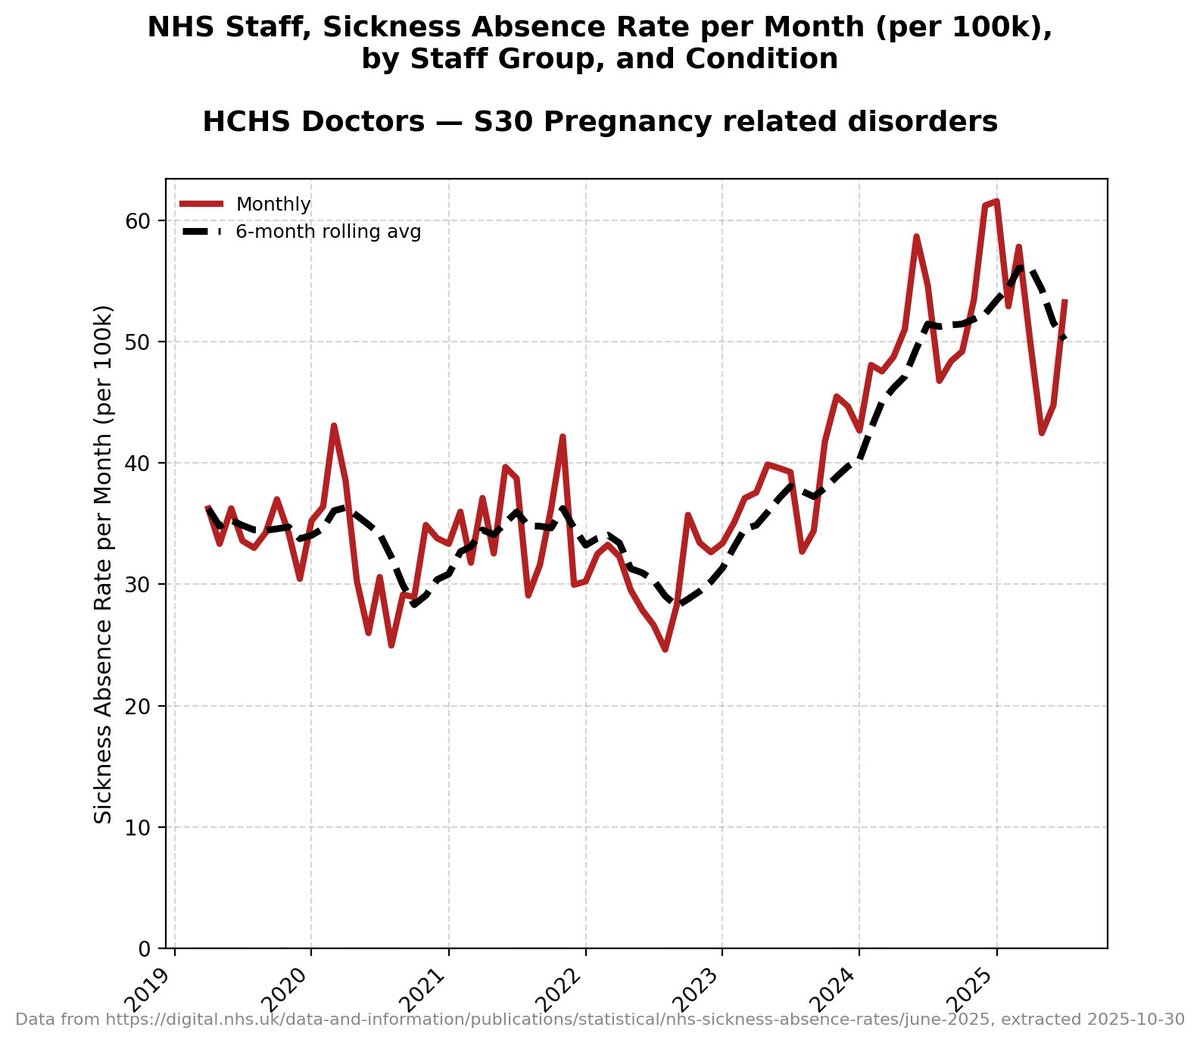
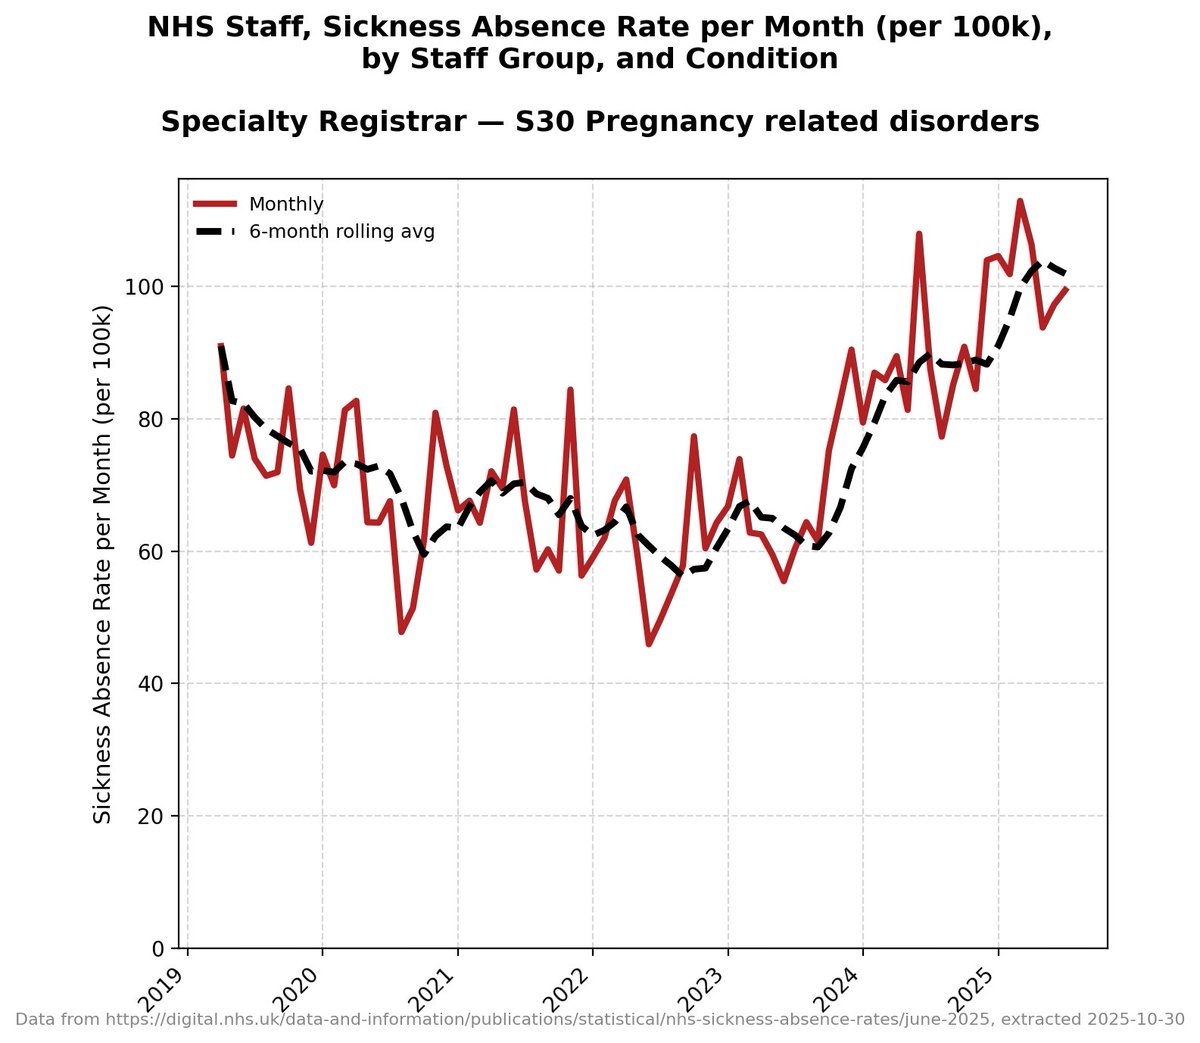
This one. Pregnancy related disorders.
💔
This one. Pregnancy related disorders.
💔
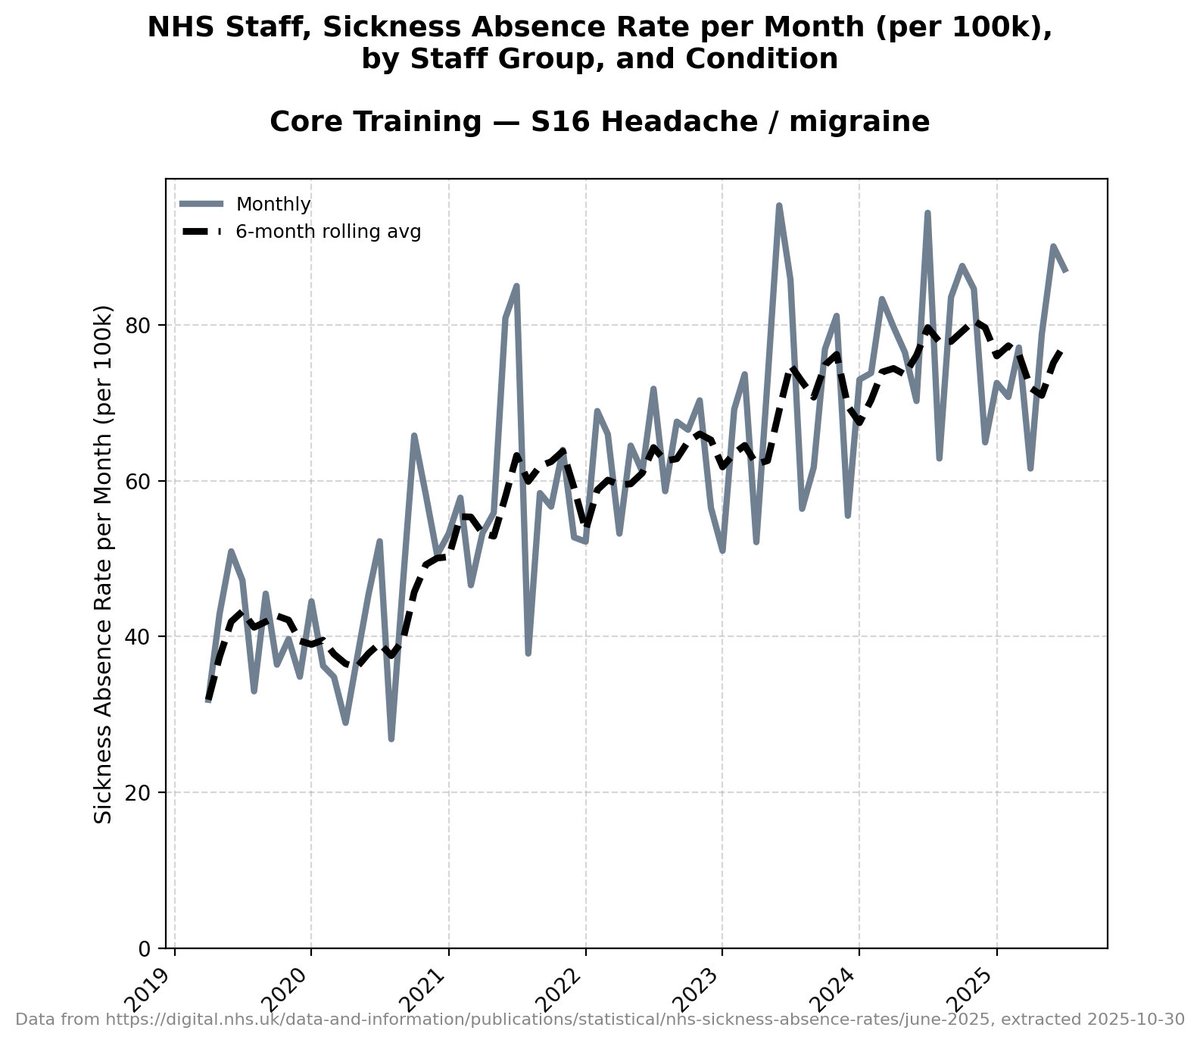
Headache/Migraine.
That
Steady
Climb.
Remember: these are not the same people each year.
It's a new population every 12 months.
Different people, worse problem.
That
Steady
Climb.
Remember: these are not the same people each year.
It's a new population every 12 months.
Different people, worse problem.

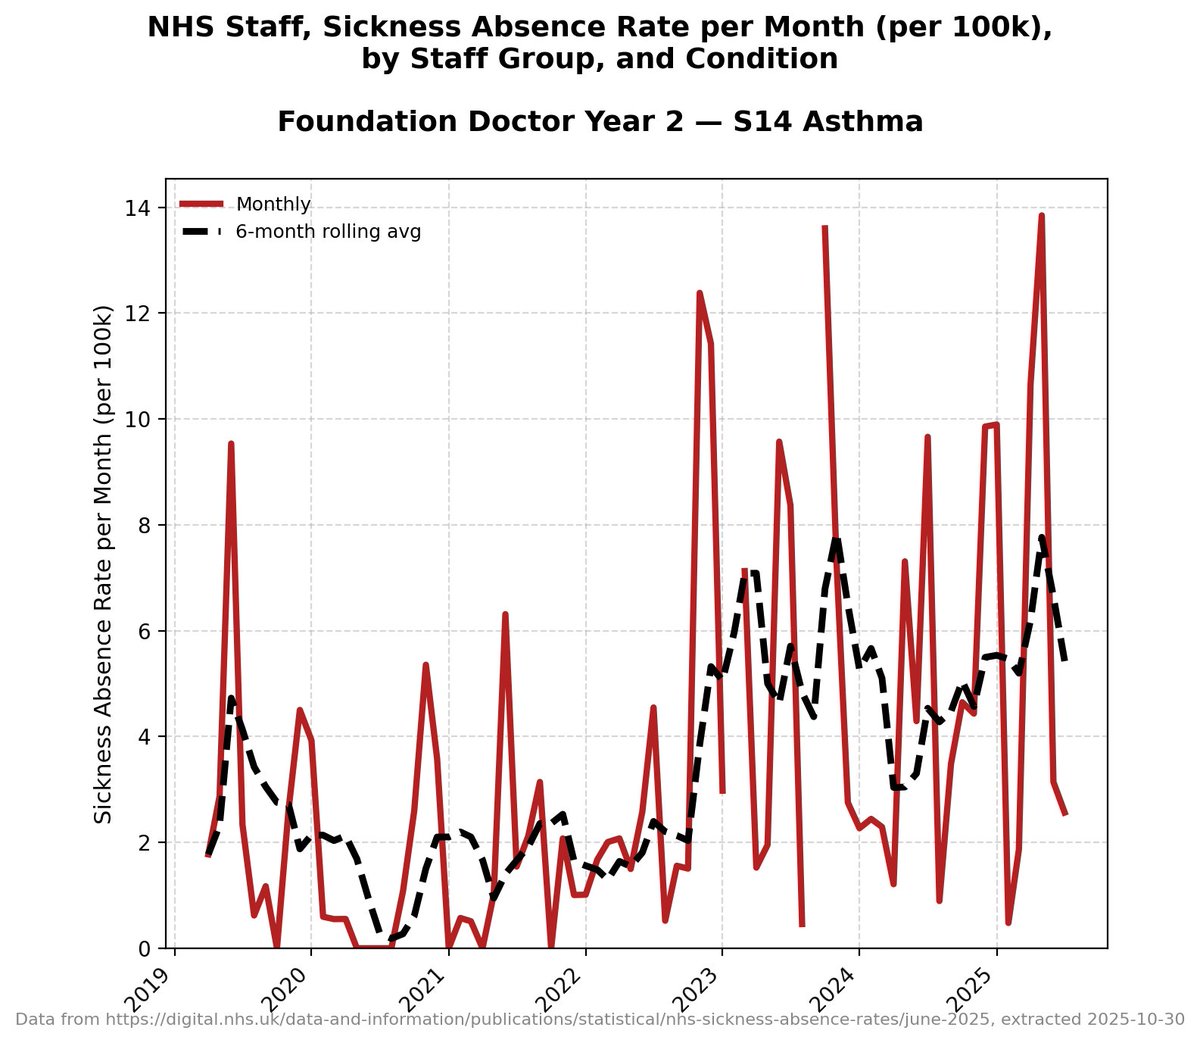
Asthma.
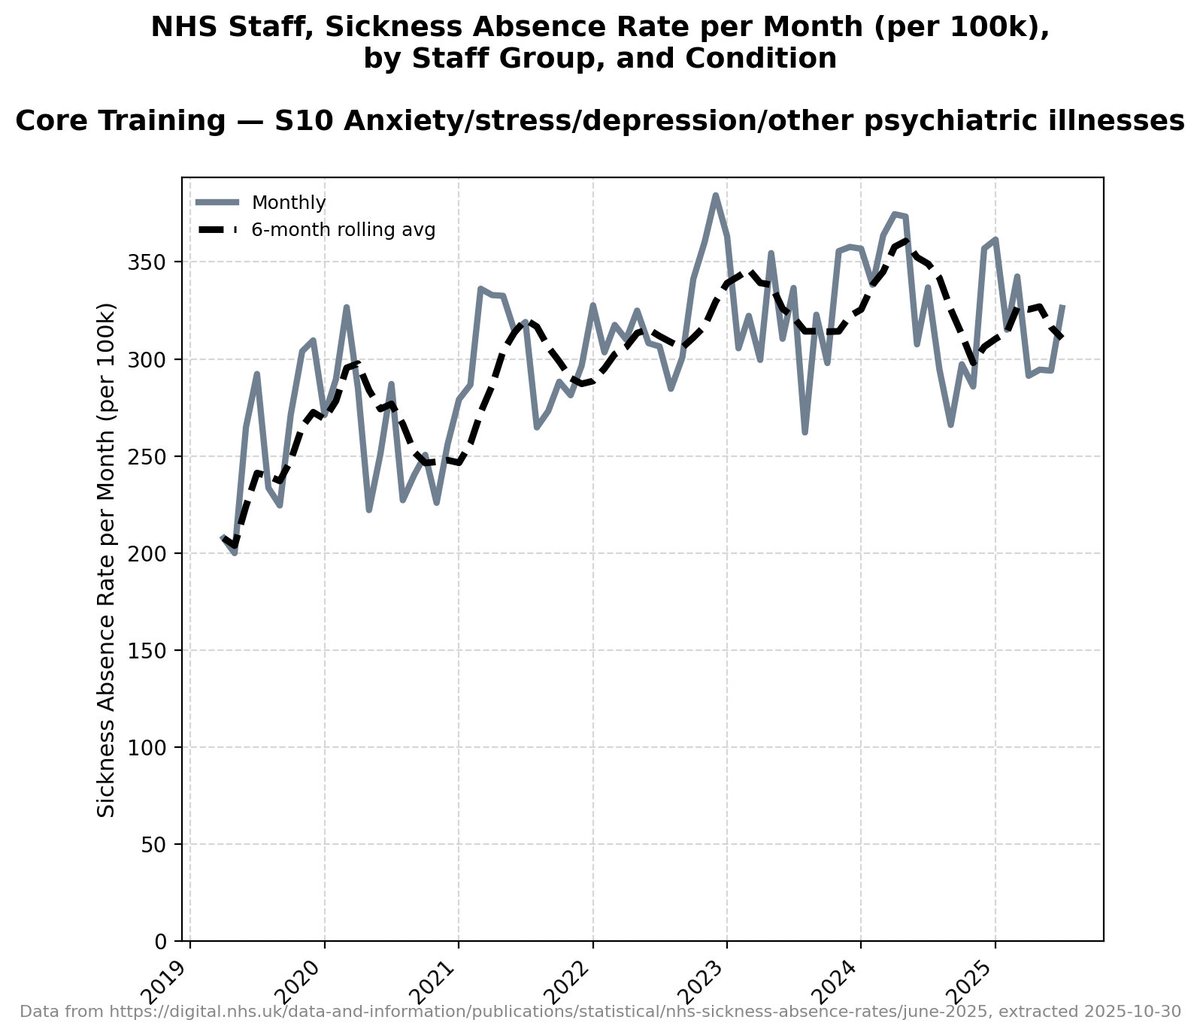
Now... this is getting interesting... A/S/D for doctors in core training is actually taking a dip.
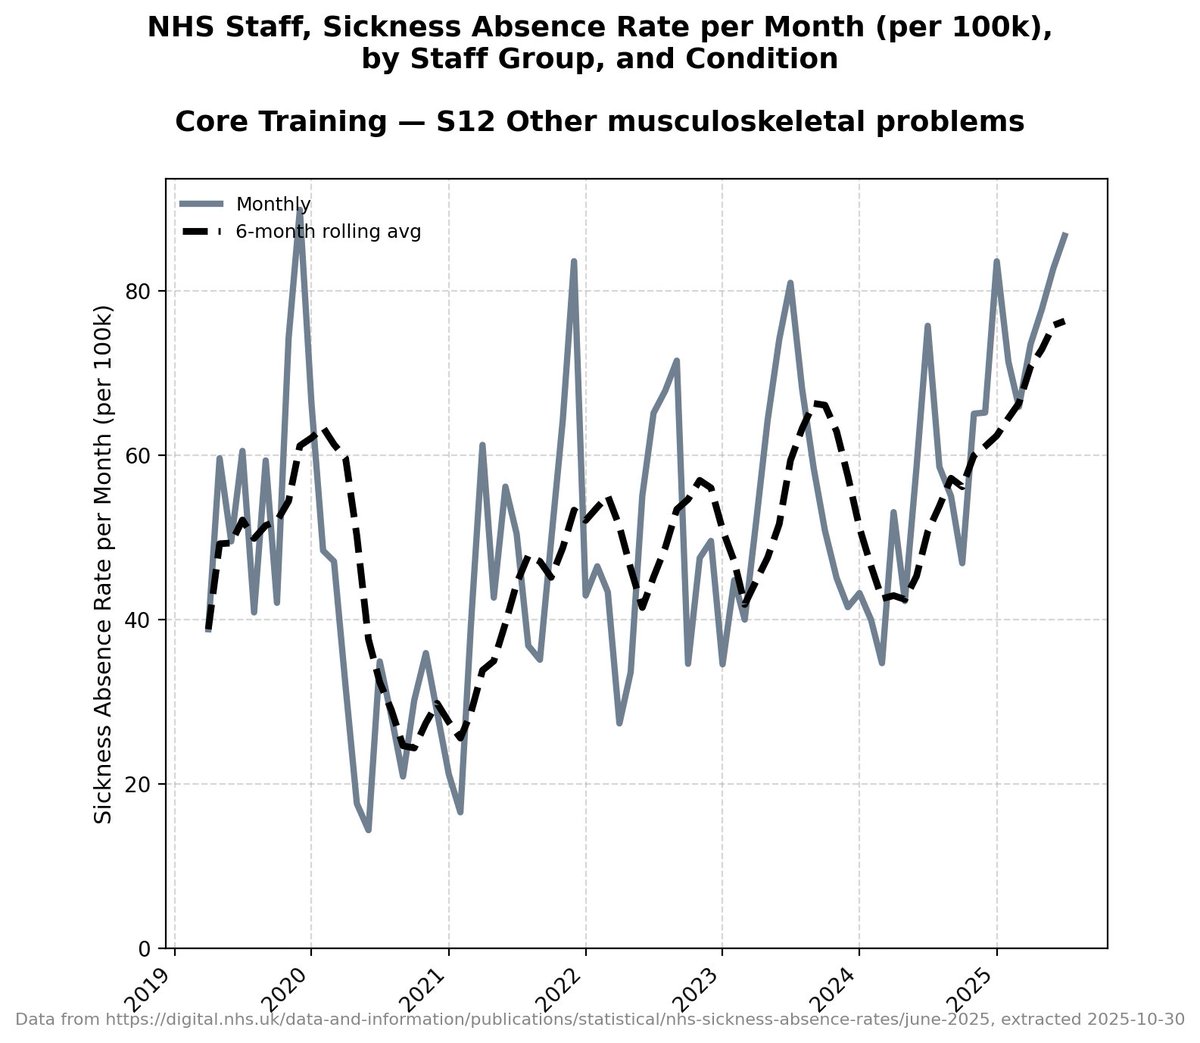
But back problems isn't.

Nor is musculoskeletal.
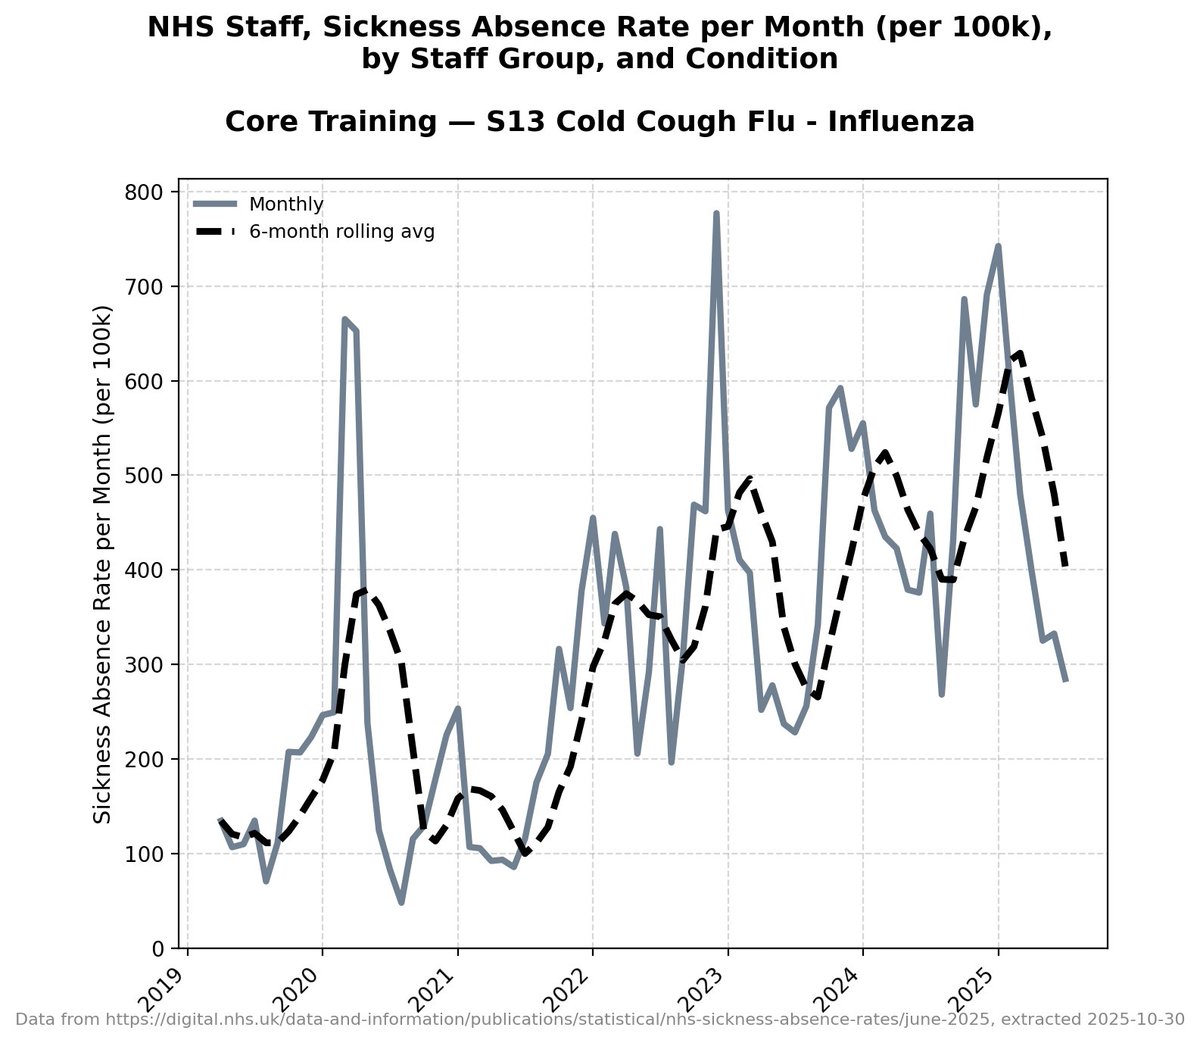
Nor is cold/cough/flu.
This cohort is *slightly* different to F1s and F2s.
They're normally in core training for two to four years depending on their discipline, with the most common ones being two, and the most complicated ones being four.
But look *how much sicker they are*.
This cohort is *slightly* different to F1s and F2s.
They're normally in core training for two to four years depending on their discipline, with the most common ones being two, and the most complicated ones being four.
But look *how much sicker they are*.
And that, yet again, in this group, anxiety/stress/depression is *not* the most common reason for sickness absence.
*Illness is*.
*Illness is*.
Gastro going badly wrong again.
Look at the continued climb.
Look at the continued climb.

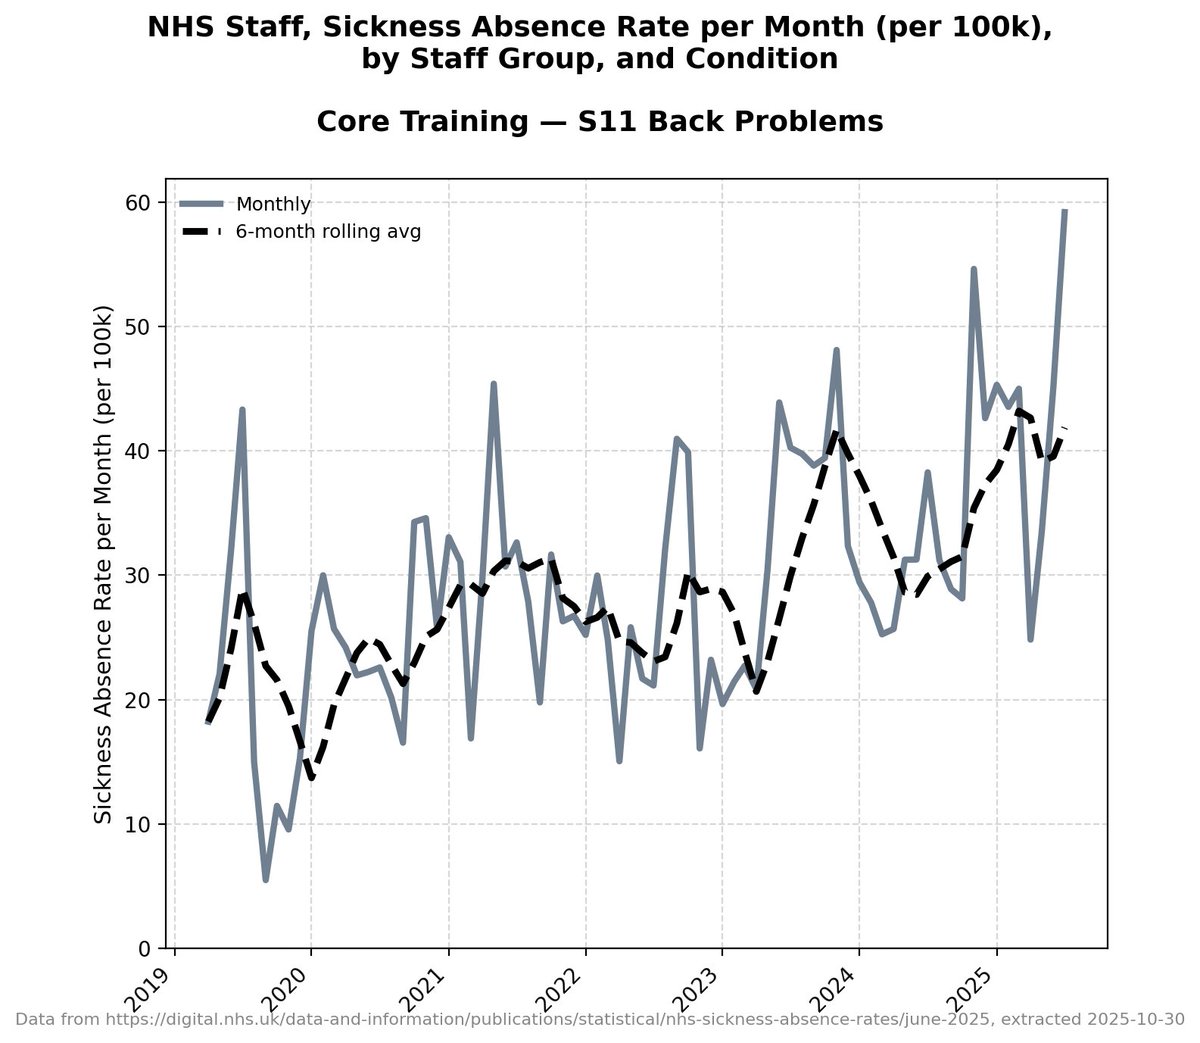
Back.
Other musculoskeletal.

Headache/Migraine
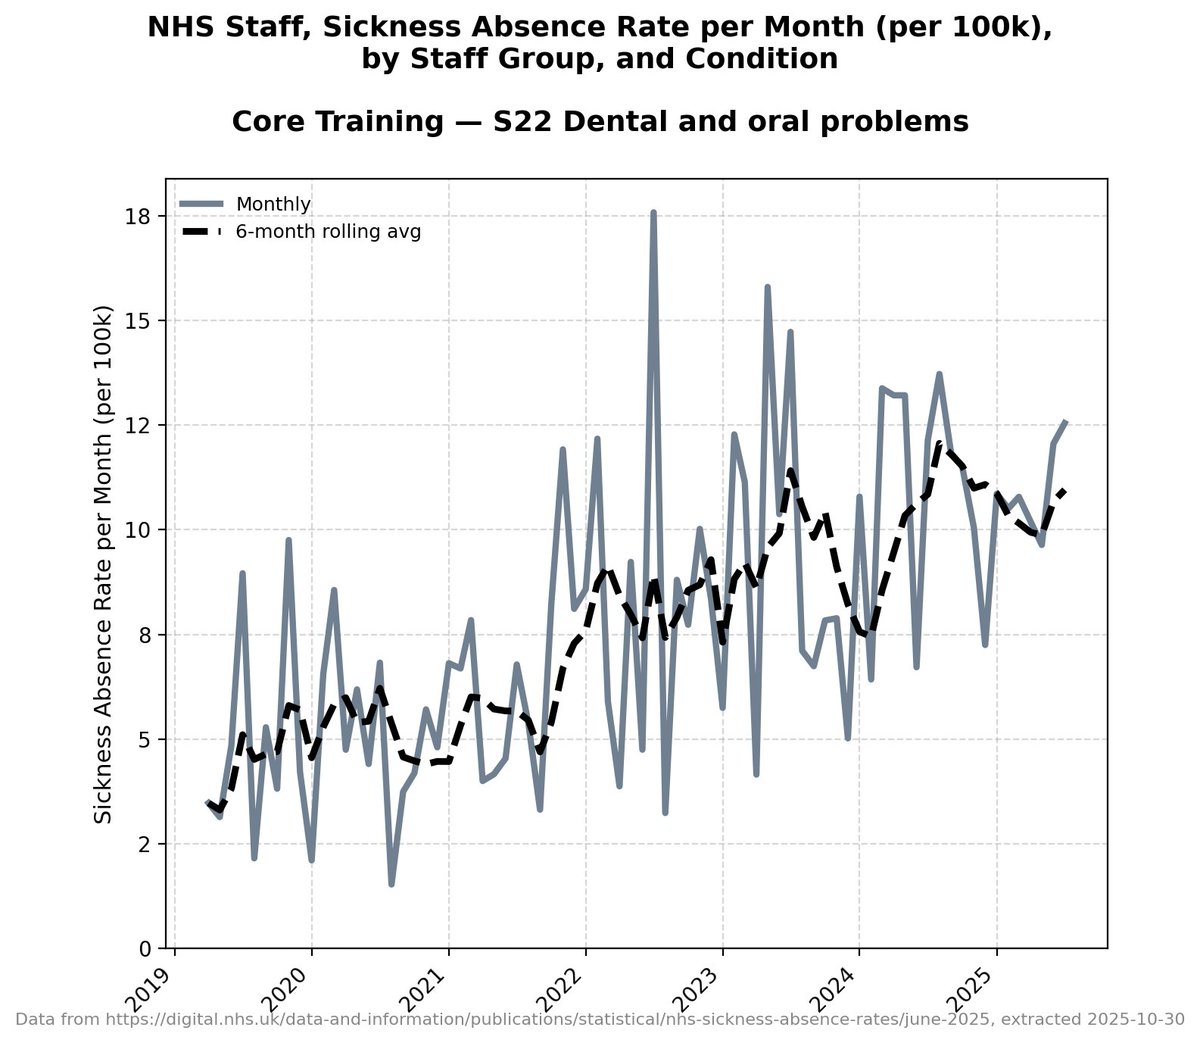
Dental and Oral.
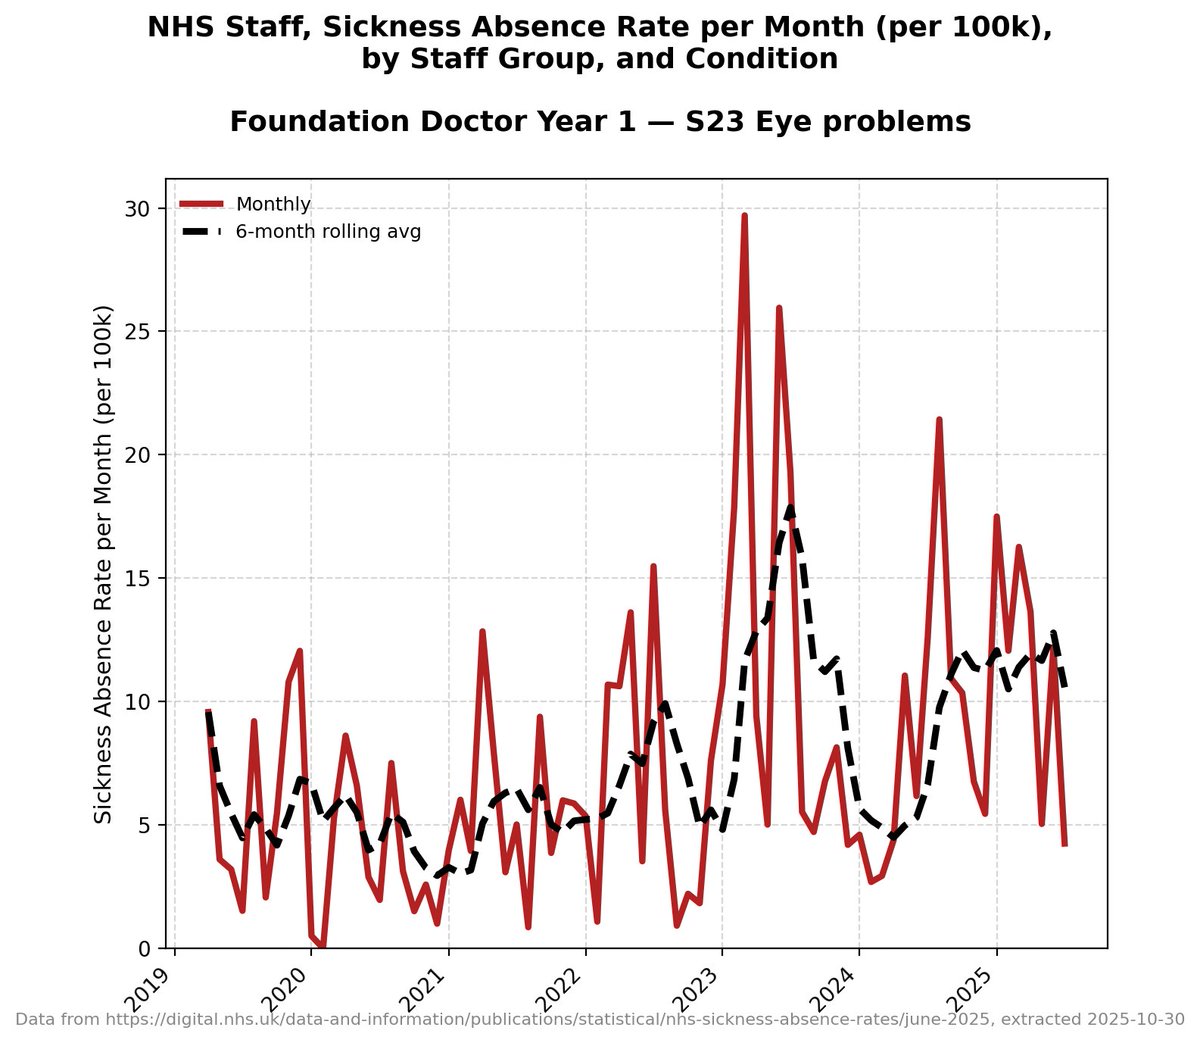
*EYE* problems.
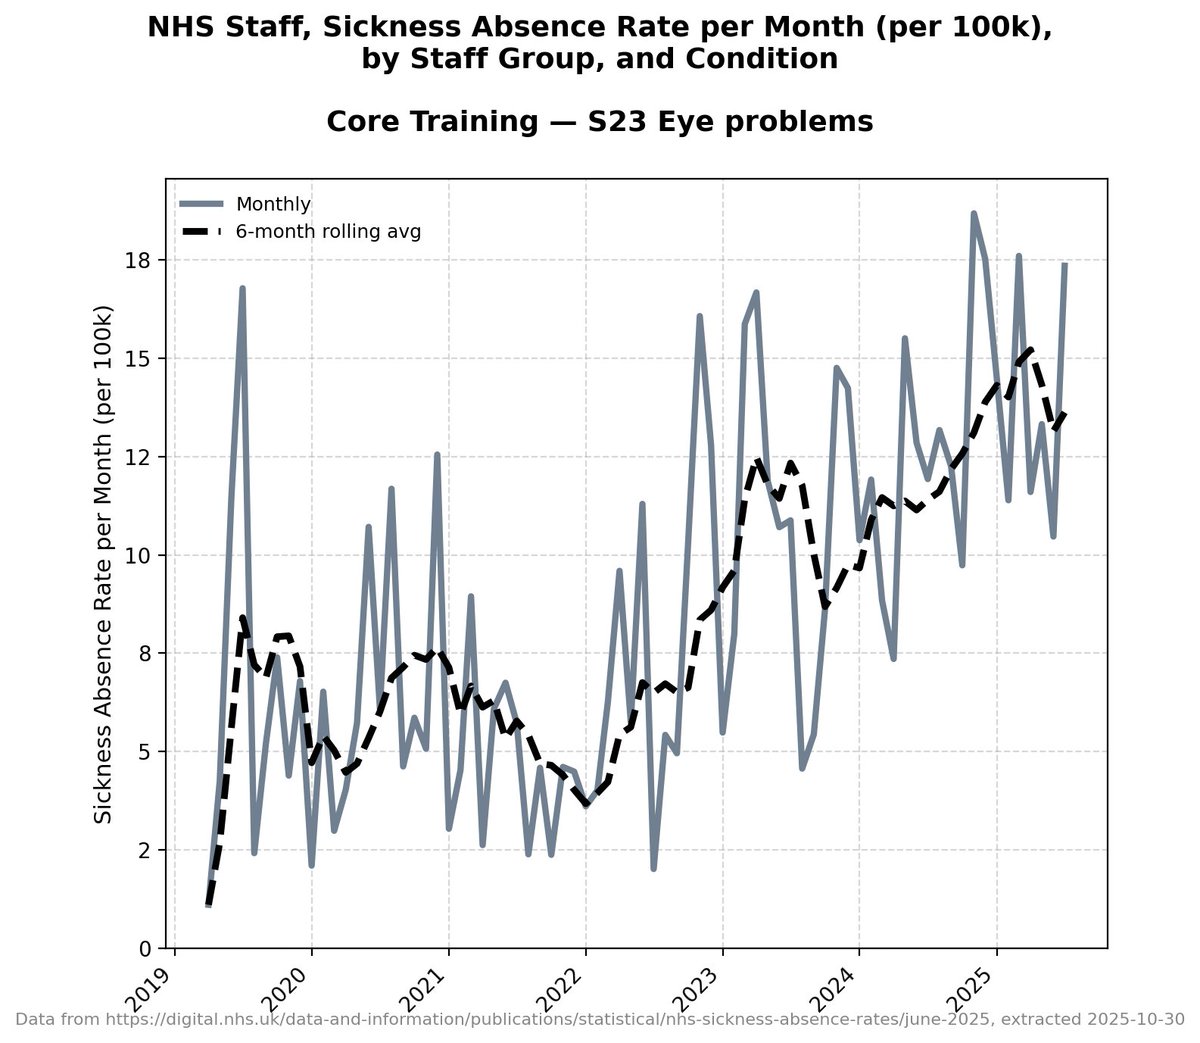
Hmm.
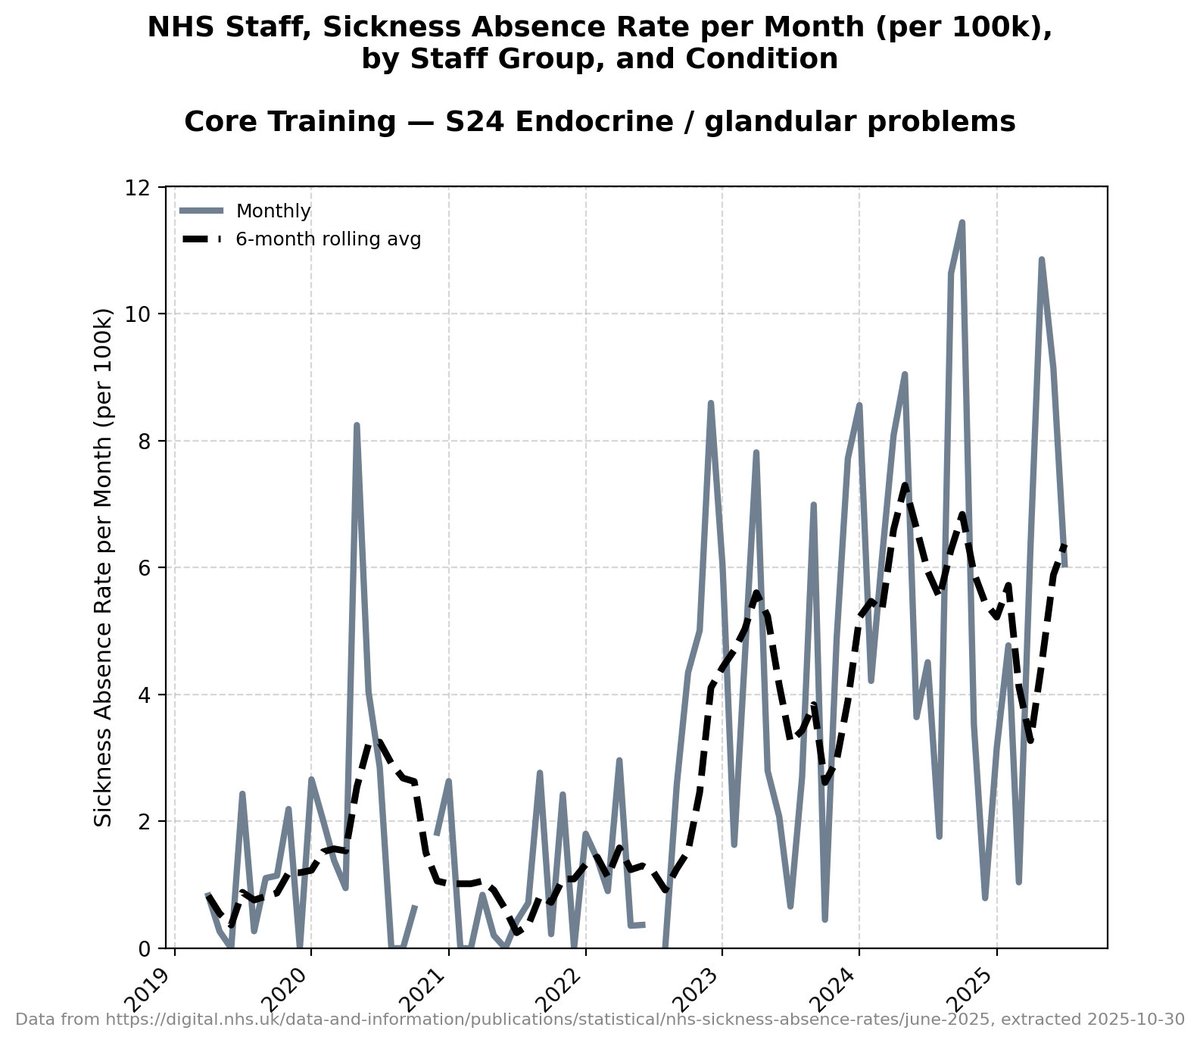
Metabolic problems - endocrine/glandular.
Not a good trend.
Metabolic problems - endocrine/glandular.
Not a good trend.
Genitourinary and gynaecological.
Not a good trend.
Not a good trend.
There are lots of reasons why repeat covid infections might make you more likely to break limbs.
To be honest, I'm surprised this is rising this slowly.
To be honest, I'm surprised this is rising this slowly.
Nervous system disorders.
One to watch very closely.
One to watch very closely.
And this one just makes me cry.
Pregnancy related disorders.
Pregnancy related disorders.
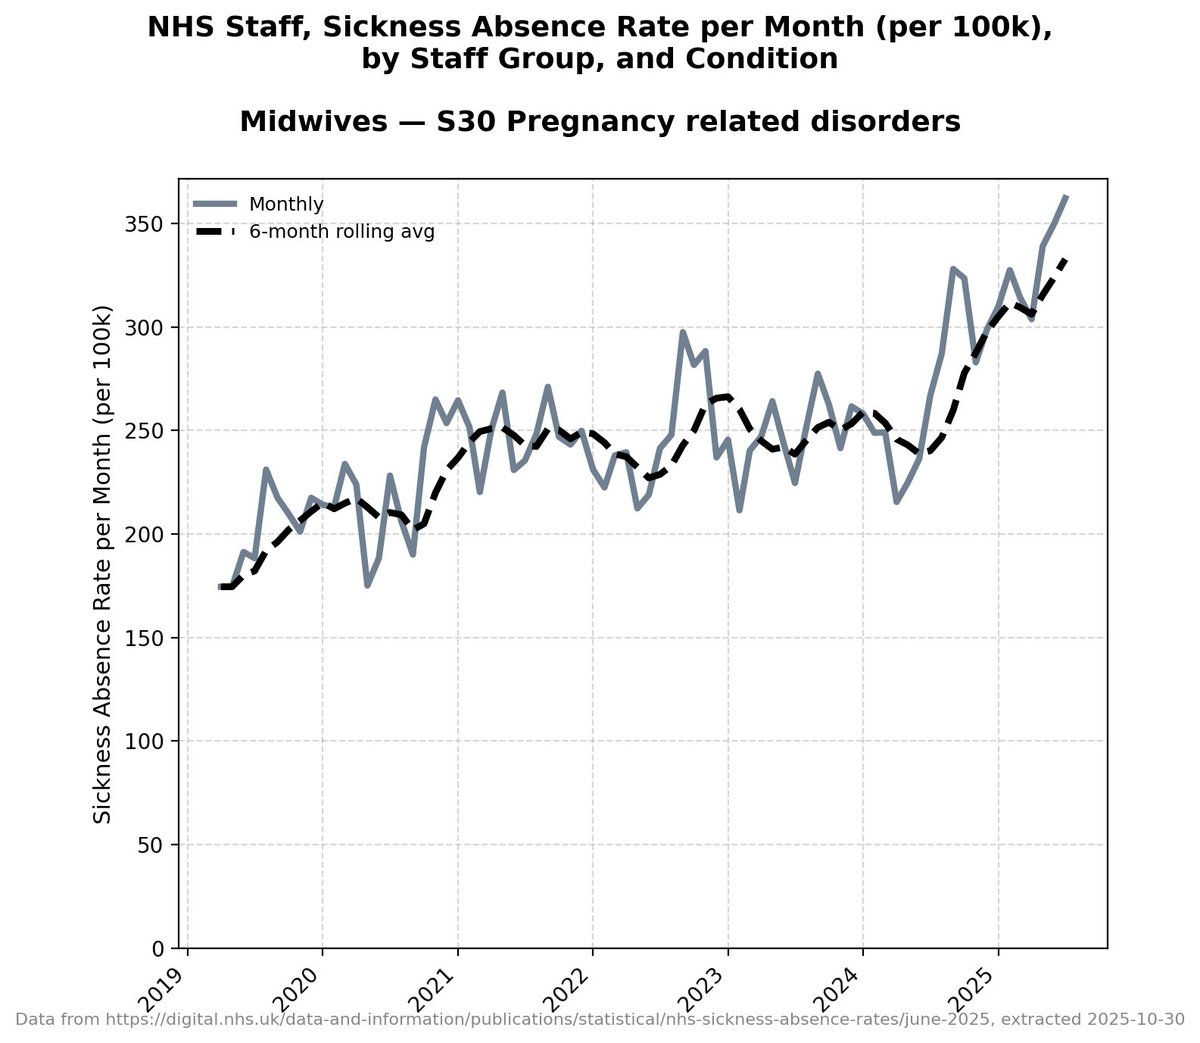
I know I'm supposed to be concentrating on the groups of NHS workers who we *know* are young, but I kind of think this one can be covered for other groups too, because you've kind of got to be a little bit young to be getting pregnant with limits.
*MIDWIVES*
*MIDWIVES*
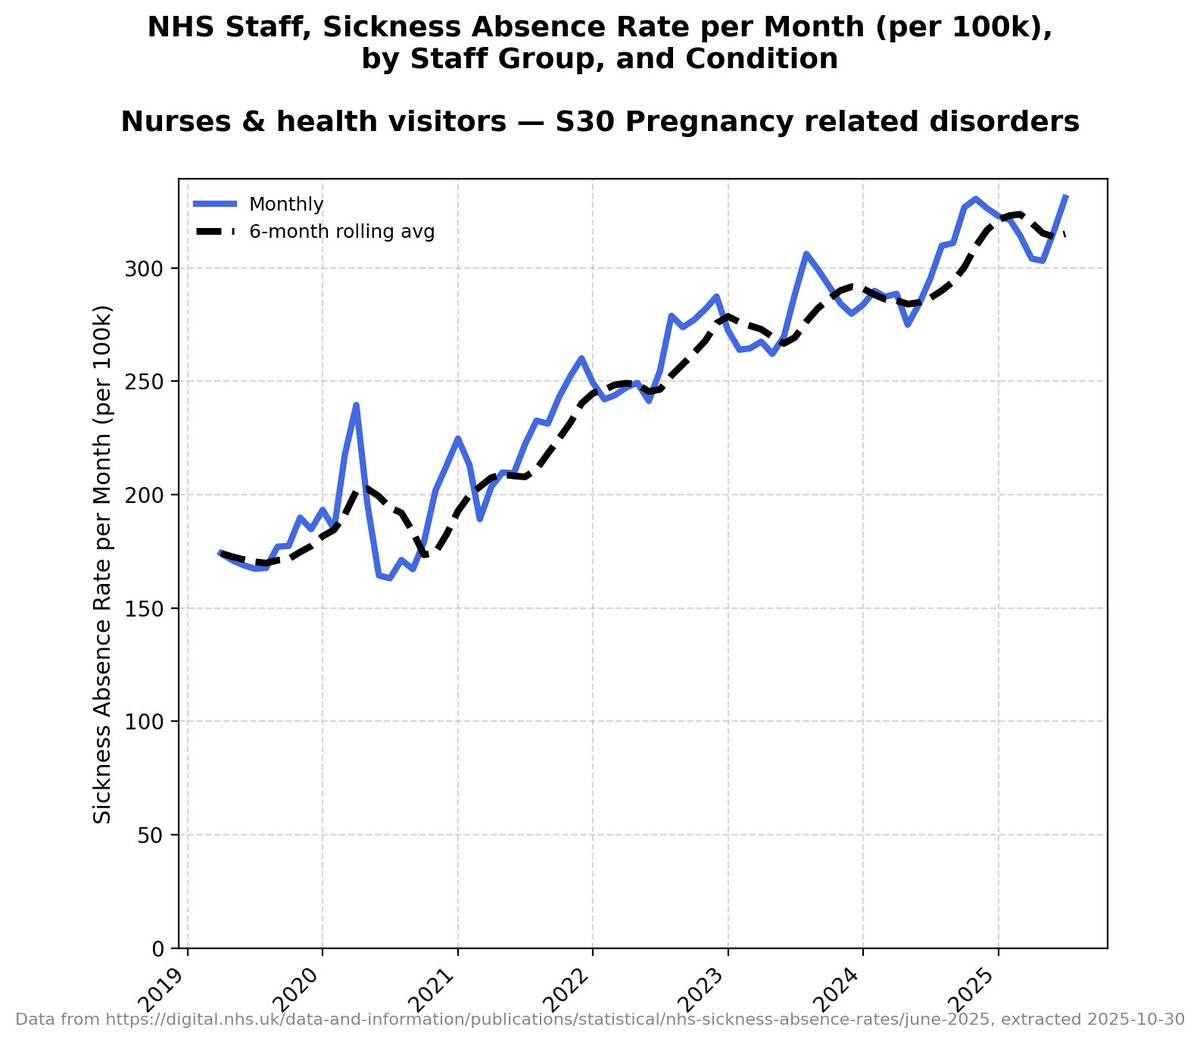
Nurses and Health Visitors
👀
👀
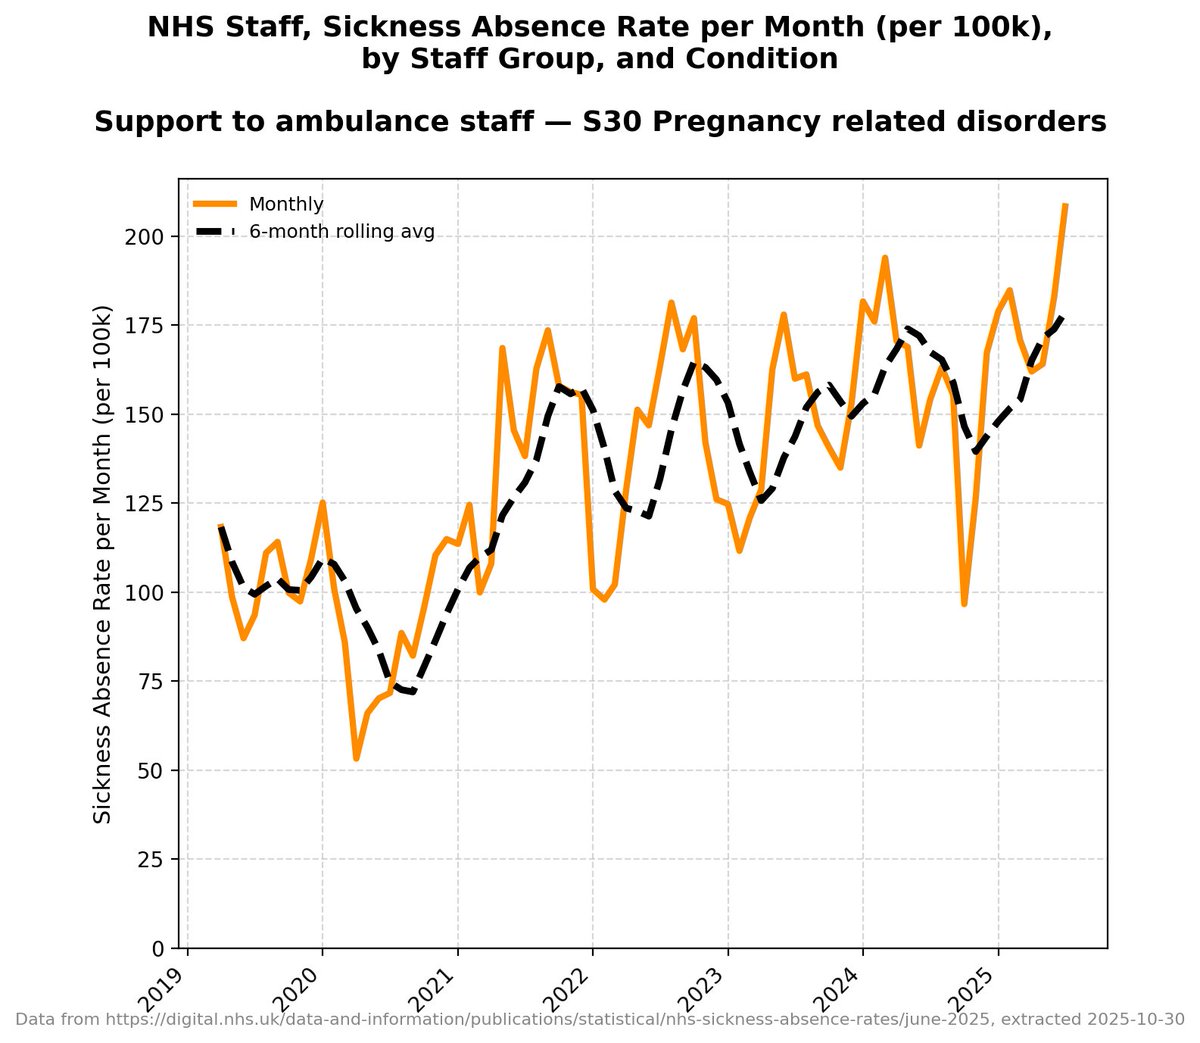
Support to ambulance staff.
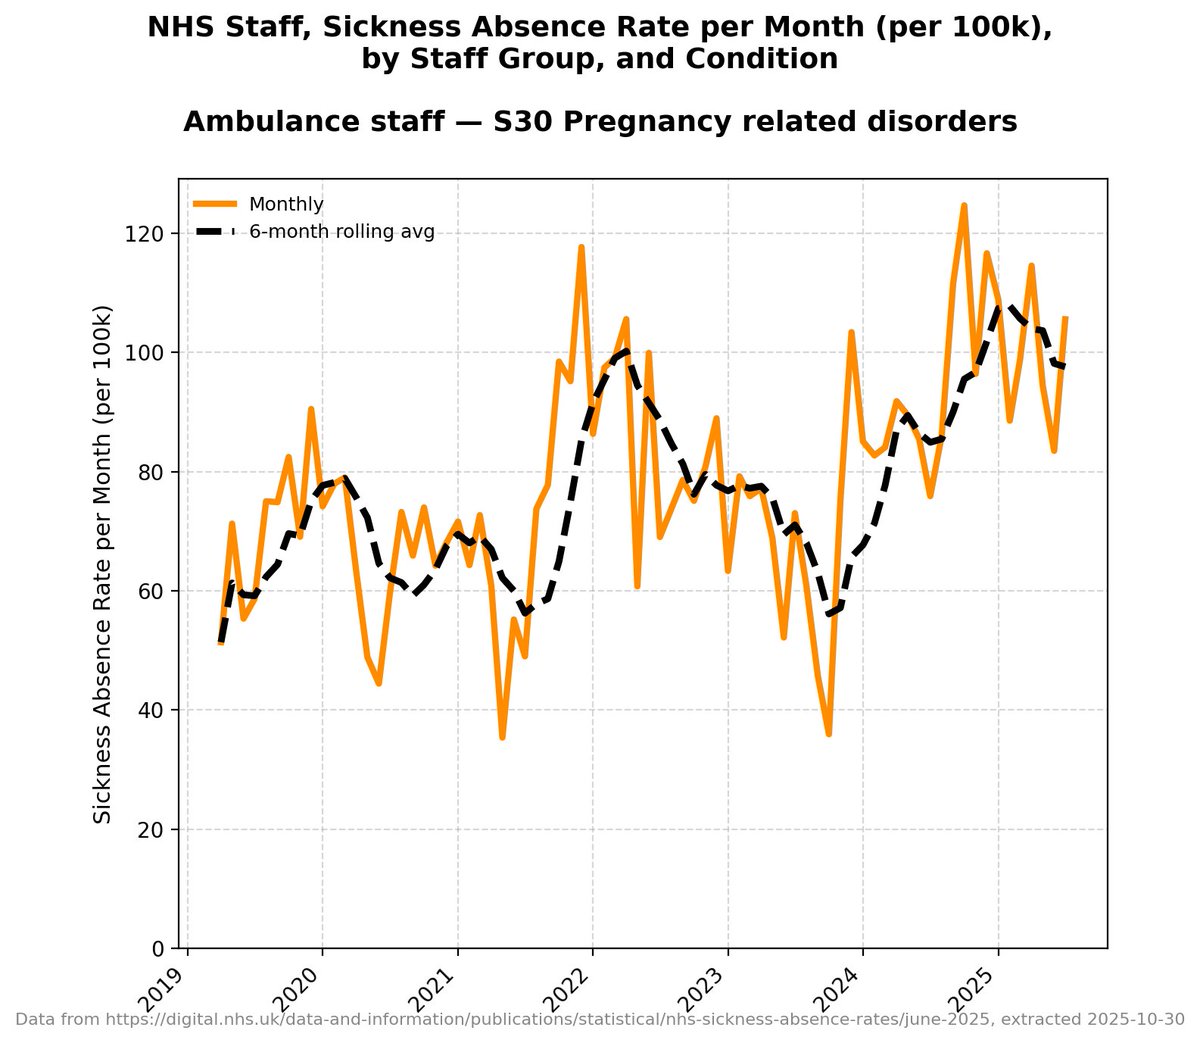
Ambulance staff.
*All* hospital and community health doctors:
Other professionally qualified clinical staff.

Specialty registrars:
Do you know how statistically significant all those graphs are?
All of this in *young staff*.
They've got another thirty years of repeat covid infections ahead of them.
Or maybe not that long if those charts carry on the way they do...
Or these ones do:
https://x.com/1goodtern/status/2009727012391584196?s=20
All the data is from here.
Download it, make some graphs, knock yourself out.
digital.nhs.uk/data-and-infor…
Download it, make some graphs, knock yourself out.
digital.nhs.uk/data-and-infor…
• • •
Missing some Tweet in this thread? You can try to
force a refresh


