In Dem states, illegal immigrants receive welfare, attracting them to the state.
Lack of voter ID allows them to vote.
This creates an incentive for illegal immigrant voting.
But it's not just theory. It's election outcomes.
Illegals are swinging elections.
A thread.
Lack of voter ID allows them to vote.
This creates an incentive for illegal immigrant voting.
But it's not just theory. It's election outcomes.
Illegals are swinging elections.
A thread.
https://twitter.com/kevinnbass/status/2007745285183668631
Why do Democrats insist on providing welfare to illegal immigrants?
Why are they so hostile to voter ID laws?
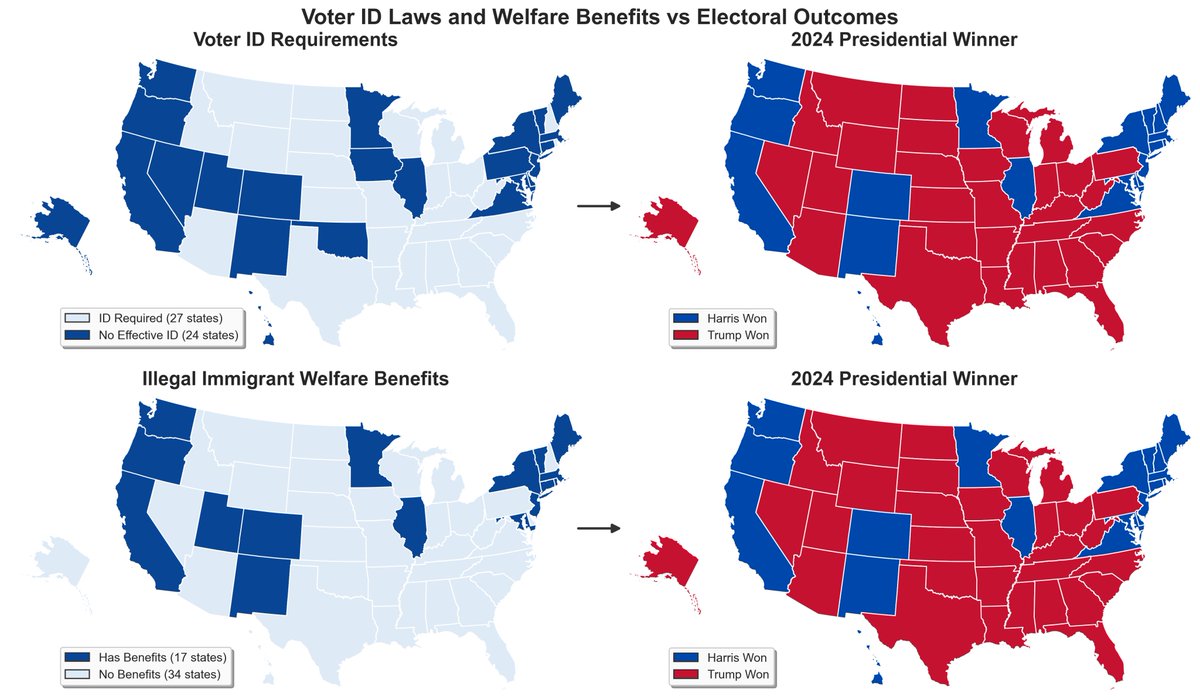
In 2024, Trump won almost every state that required voter ID.
He also won almost every state that did not provide welfare to illegal immigrants.
In contrast, Kamala won almost every state that did NOT require voter ID.
And she won almost every state that DID provide welfare to illegal immigrants.
Why are they so hostile to voter ID laws?
In 2024, Trump won almost every state that required voter ID.
He also won almost every state that did not provide welfare to illegal immigrants.
In contrast, Kamala won almost every state that did NOT require voter ID.
And she won almost every state that DID provide welfare to illegal immigrants.

For voter ID laws, almost all states had election outcomes that aligned with the policies.
Strict voter ID law states went to Trump almost every single time.
Likewise, effective no-ID law states went to Harris almost every single time.
Only 8 of 51 states did not. (DC included.)
Strict voter ID law states went to Trump almost every single time.
Likewise, effective no-ID law states went to Harris almost every single time.
Only 8 of 51 states did not. (DC included.)

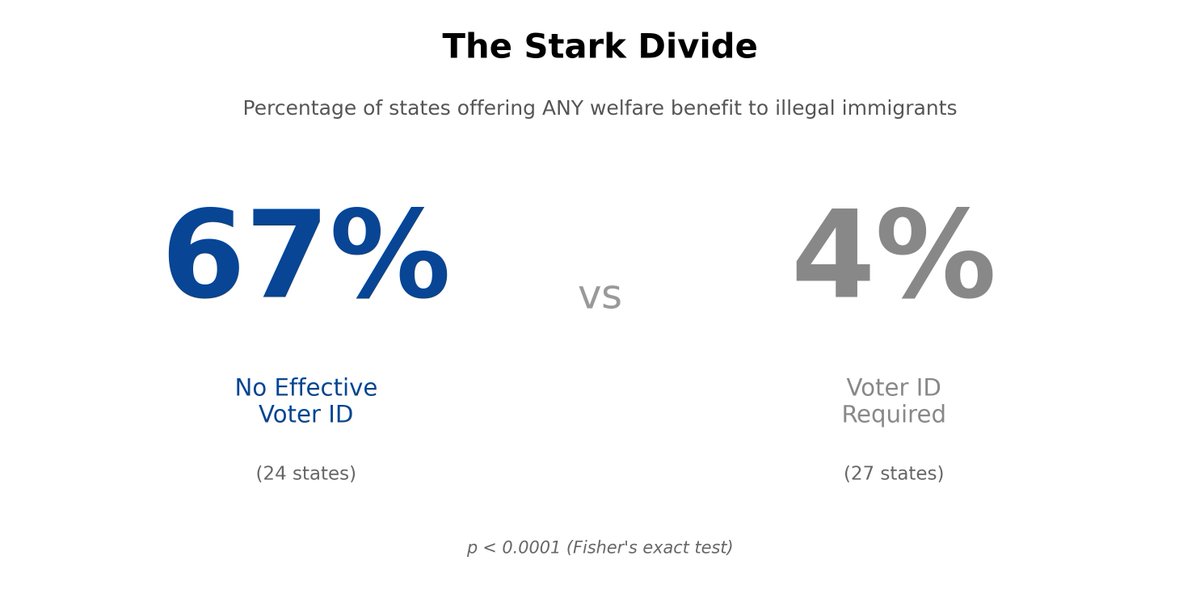
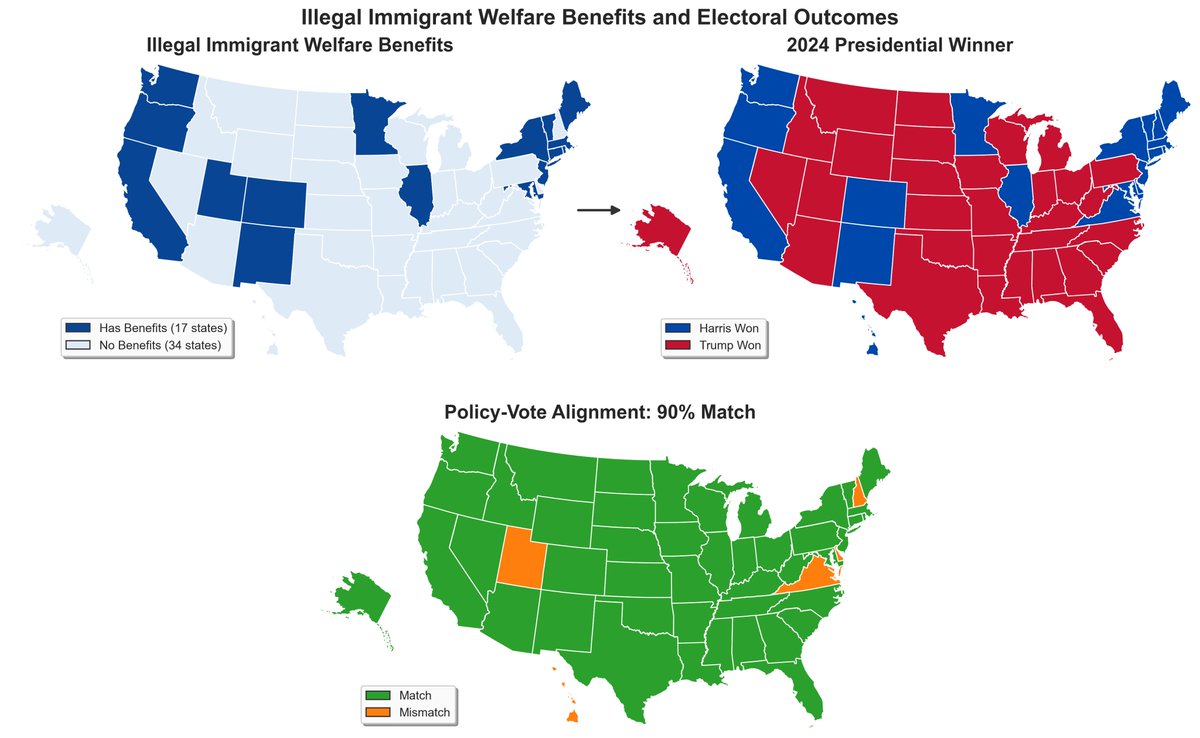
The relationship between state policies providing welfare benefits to illegal immigrants welfare and election outcomes is even tighter.
Only 5 states went against the pattern.
Only 5 states went against the pattern.
The effect is huge.
States with effective voter ID laws had, on average, a 14% swing toward Trump compared to those that didn't.
States with illegal immigrant welfare benefits had, on average, a 16% swing toward Harris compared to those that didn't.
States with effective voter ID laws had, on average, a 14% swing toward Trump compared to those that didn't.
States with illegal immigrant welfare benefits had, on average, a 16% swing toward Harris compared to those that didn't.

That's right.
If ID-required states averaged 39.9% for Harris and no-ID states averaged 54.2%, the gap is -14.3 percentage points.
The negative sign indicates ID-required states lean more Republican.
Huge difference.
If ID-required states averaged 39.9% for Harris and no-ID states averaged 54.2%, the gap is -14.3 percentage points.
The negative sign indicates ID-required states lean more Republican.
Huge difference.
For Congressional elections, the effect is even bigger.
In the House of Representatives, there is a full 21% and 23% vote swing, respectively.
That's massive.
In the House of Representatives, there is a full 21% and 23% vote swing, respectively.
That's massive.

Now, one might say: this effect is too big. This must be just a correlation.
True. It's big. Too big.
And maybe blue states just have illegal immigrant welfare and loose voter ID laws and red states the opposite, and this is more the OUTCOME of elections rather than the CAUSE.
True. It's big. Too big.
And maybe blue states just have illegal immigrant welfare and loose voter ID laws and red states the opposite, and this is more the OUTCOME of elections rather than the CAUSE.
So I dealt with this by pairing counties across state borders where ONLY the state voter ID and illegal immigrant welfare benefit policies differed.
The counties are nearly identical--only state policies differ.
Is there a difference in election outcomes between these counties?
The counties are nearly identical--only state policies differ.
Is there a difference in election outcomes between these counties?
Here's for counties in neighboring states where one state has effective voter ID laws and the other doesn't.

Here's for welfare benefits for illegal immigrants.
We are comparing election outcomes only between these counties, for both voter ID and welfare to illegal immigrants.
We are comparing election outcomes only between these counties, for both voter ID and welfare to illegal immigrants.

The same relationship holds up.
Nearly identical counties show a big swing from Republican-to-Democrat--and vice versa--solely based on the host state's voter ID laws and illegal immigrant welfare benefits.
Nearly identical counties show a big swing from Republican-to-Democrat--and vice versa--solely based on the host state's voter ID laws and illegal immigrant welfare benefits.

Bonus figure.
The illegal immigrant population has little impact on election outcomes, with little overlap in whether a state has an above-median or below-median illegal immigrant population.
What matters is not whether there are illegal immigrants, but whether they are allowed to vote.
The illegal immigrant population has little impact on election outcomes, with little overlap in whether a state has an above-median or below-median illegal immigrant population.
What matters is not whether there are illegal immigrants, but whether they are allowed to vote.

What matters is not whether there are illegal immigrants, but whether they are allowed to vote.
These Democrat policies are evil and a mortal threat to American democracy.
Tag your Congressmen and other politicians.
@LeaderJohnThune must pass the SAVE Act now.
These Democrat policies are evil and a mortal threat to American democracy.
Tag your Congressmen and other politicians.
@LeaderJohnThune must pass the SAVE Act now.
Methodology
Data Sources
I combined three types of data to generate these visualizations.
Voter ID Laws.
State-by-state ID requirements from the National Conference of State Legislatures (NCSL), which classifies states on a 5-tier scale based on what identification is required and how strictly it's enforced. Tier 1 (Strict Photo ID) requires voters to show photo ID, with provisional ballots not counted without it. Tier 2 (Strict Non-Photo ID) requires non-photo ID with strict enforcement. Tier 3 (Non-Strict Photo ID) requests photo ID but allows alternatives. Tier 4 (Non-Strict Non-Photo ID) requests ID but lets voters sign an affidavit or use other workarounds. Tier 5 (No Document Required) doesn't request ID at all.
For my primary analysis, I collapsed this to 2 tiers based on functional outcome. ID Required (Tiers 1-3) includes 36 states where voters must present some form of identification. No Effective ID (Tiers 4-5) includes 15 states where voters can vote without presenting any document—via affidavit, signature match, or no request at all.
Welfare Benefits.
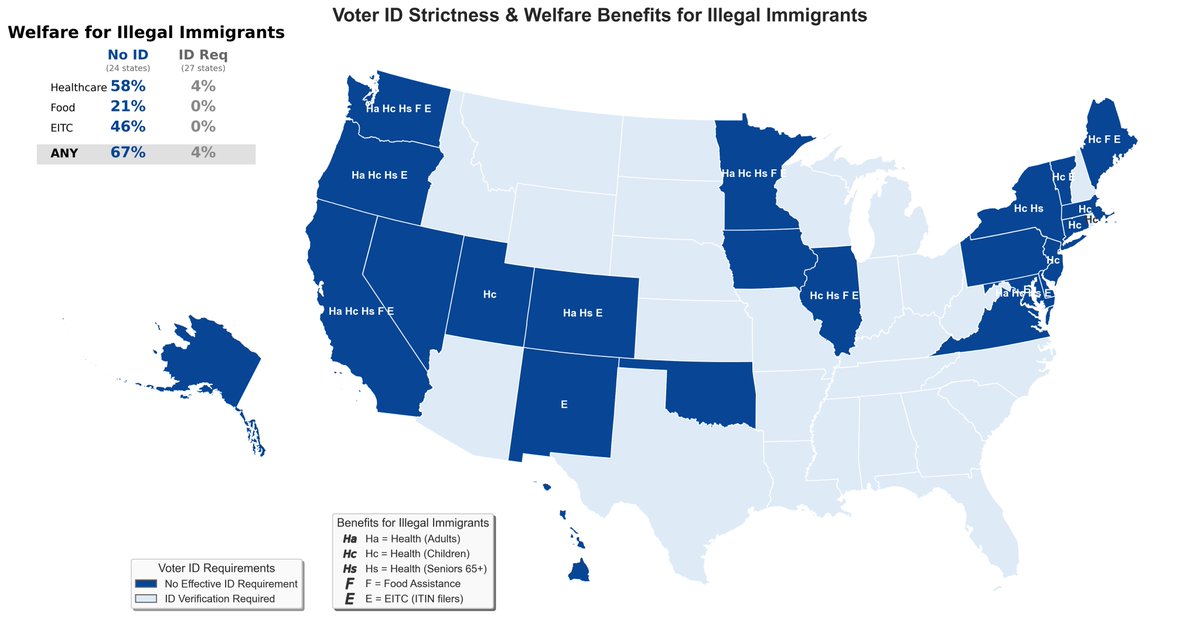
Whether states provide any of five benefit categories to unauthorized immigrants: healthcare for children, healthcare for adults, healthcare for seniors (all from KFF and NILC health coverage maps), food assistance via state-funded SNAP-equivalent programs (from NILC state food programs table), and state earned income tax credits (from ITEP state EITC analysis). States offering at least one of these five benefits are coded as "Has Benefits" (17 states); the rest as "No Benefits" (34 states).
Election Results.
State-level presidential vote shares from official returns compiled in our panel dataset (1976-2024). County-level presidential results from MIT Election Data and Science Lab county returns (2000-2020). Border county analysis uses 2020 data, which is the most recent available at county level.
Geographic Data.
State boundaries from U.S. Census Bureau TIGER/Line shapefiles. County adjacency pairs from Census Bureau county adjacency file, which identifies all counties sharing a physical border.
Map Generation.
Each three-panel figure follows the same structure:
The policy map (top-left) shows states colored by their policy status using a two-tone scheme—dark for states with the policy characteristic, light for states without.
The electoral map (top-right) shows the same states colored by 2024 presidential winner—blue for Harris, red for Trump.
The alignment map (bottom) overlays these two dimensions. States where the policy status correctly "predicts" the electoral outcome appear in green; mismatches appear in orange. For voter ID, a "match" means ID-required states voted Trump or no-ID states voted Harris. For welfare, a "match" means benefit states voted Harris or no-benefit states voted Trump.
Alignment percentages are calculated on all 51 jurisdictions (50 states plus DC).
Border County Analysis.
For a more granular view, I identified counties that physically border each other across state lines where policies differ. Using Census Bureau county adjacency data, we found all county pairs where one county is in a policy state and its neighbor is in a non-policy state. This creates a natural comparison—neighboring counties share similar demographics, economies, and media markets, but face different state policies.
Each unique county is counted once to avoid weighting by number of cross-border neighbors. For voter ID borders, this yielded 196 unique border counties. For welfare borders, 234 unique border counties.
Statistical Approach
What I Measured.
The core statistic is the gap in Democratic vote share between states (or counties) with a policy versus those without.
For example, if ID-required states averaged 39.9% for Harris and no-ID states averaged 54.2%, the gap is -14.3 percentage points. The negative sign indicates ID-required states lean more Republican.
State-Level Results.
Voter ID (Presidential 2024): States requiring ID averaged 39.9% Democratic; states with no effective ID averaged 54.2% Democratic. Gap: 14.3 percentage points—ID states voted substantially more Republican.
Welfare Benefits (Presidential 2024): States offering benefits averaged 57.3% Democratic; states without benefits averaged 41.3% Democratic. Gap: 16.0 percentage points in the opposite direction—benefit states voted substantially more Democratic.
Alignment rates: 90% of states (46 of 51) show the expected pattern for welfare benefits. 84% (45 of 51) show the expected pattern for voter ID.
Border County Results.
Border counties provide a tighter comparison because neighboring counties are more similar to each other than randomly selected states.
Voter ID borders (2020): Counties in ID-required states averaged 27.9% Democratic; their neighbors in no-ID states averaged 31.0%. Gap: 3.1 percentage points.
Welfare borders (2020): Counties in benefit states averaged 36.9% Democratic; their neighbors in non-benefit states averaged 31.9%. Gap: 5.0 percentage points.
The gaps shrink considerably at the county level (3-5 points vs 14-16 points at state level), which is expected—neighboring counties are more similar than entire states. But the direction remains consistent, and gaps of this magnitude across hundreds of border counties suggest a real pattern rather than noise.
What This Does and Doesn't Show
These are correlations, not causal estimates. The maps show that voter ID laws and welfare benefits track closely with partisan voting patterns—but they don't prove that policies cause voting behavior or vice versa.
States don't adopt policies randomly. Republican-leaning states tend to pass voter ID laws; Democratic-leaning states tend to extend benefits to immigrants. The policies may reflect existing political preferences rather than shape them. Likewise, these policies may entrench pre-existing political preferences by incentivizing voting by illegal immigrants.
The border county analysis helps narrow this gap by comparing similar places, but it still can't rule out that counties on different sides of a state line differ in unmeasured ways that drive both their state's policies and their own voting behavior.
Data Sources
I combined three types of data to generate these visualizations.
Voter ID Laws.
State-by-state ID requirements from the National Conference of State Legislatures (NCSL), which classifies states on a 5-tier scale based on what identification is required and how strictly it's enforced. Tier 1 (Strict Photo ID) requires voters to show photo ID, with provisional ballots not counted without it. Tier 2 (Strict Non-Photo ID) requires non-photo ID with strict enforcement. Tier 3 (Non-Strict Photo ID) requests photo ID but allows alternatives. Tier 4 (Non-Strict Non-Photo ID) requests ID but lets voters sign an affidavit or use other workarounds. Tier 5 (No Document Required) doesn't request ID at all.
For my primary analysis, I collapsed this to 2 tiers based on functional outcome. ID Required (Tiers 1-3) includes 36 states where voters must present some form of identification. No Effective ID (Tiers 4-5) includes 15 states where voters can vote without presenting any document—via affidavit, signature match, or no request at all.
Welfare Benefits.
Whether states provide any of five benefit categories to unauthorized immigrants: healthcare for children, healthcare for adults, healthcare for seniors (all from KFF and NILC health coverage maps), food assistance via state-funded SNAP-equivalent programs (from NILC state food programs table), and state earned income tax credits (from ITEP state EITC analysis). States offering at least one of these five benefits are coded as "Has Benefits" (17 states); the rest as "No Benefits" (34 states).
Election Results.
State-level presidential vote shares from official returns compiled in our panel dataset (1976-2024). County-level presidential results from MIT Election Data and Science Lab county returns (2000-2020). Border county analysis uses 2020 data, which is the most recent available at county level.
Geographic Data.
State boundaries from U.S. Census Bureau TIGER/Line shapefiles. County adjacency pairs from Census Bureau county adjacency file, which identifies all counties sharing a physical border.
Map Generation.
Each three-panel figure follows the same structure:
The policy map (top-left) shows states colored by their policy status using a two-tone scheme—dark for states with the policy characteristic, light for states without.
The electoral map (top-right) shows the same states colored by 2024 presidential winner—blue for Harris, red for Trump.
The alignment map (bottom) overlays these two dimensions. States where the policy status correctly "predicts" the electoral outcome appear in green; mismatches appear in orange. For voter ID, a "match" means ID-required states voted Trump or no-ID states voted Harris. For welfare, a "match" means benefit states voted Harris or no-benefit states voted Trump.
Alignment percentages are calculated on all 51 jurisdictions (50 states plus DC).
Border County Analysis.
For a more granular view, I identified counties that physically border each other across state lines where policies differ. Using Census Bureau county adjacency data, we found all county pairs where one county is in a policy state and its neighbor is in a non-policy state. This creates a natural comparison—neighboring counties share similar demographics, economies, and media markets, but face different state policies.
Each unique county is counted once to avoid weighting by number of cross-border neighbors. For voter ID borders, this yielded 196 unique border counties. For welfare borders, 234 unique border counties.
Statistical Approach
What I Measured.
The core statistic is the gap in Democratic vote share between states (or counties) with a policy versus those without.
For example, if ID-required states averaged 39.9% for Harris and no-ID states averaged 54.2%, the gap is -14.3 percentage points. The negative sign indicates ID-required states lean more Republican.
State-Level Results.
Voter ID (Presidential 2024): States requiring ID averaged 39.9% Democratic; states with no effective ID averaged 54.2% Democratic. Gap: 14.3 percentage points—ID states voted substantially more Republican.
Welfare Benefits (Presidential 2024): States offering benefits averaged 57.3% Democratic; states without benefits averaged 41.3% Democratic. Gap: 16.0 percentage points in the opposite direction—benefit states voted substantially more Democratic.
Alignment rates: 90% of states (46 of 51) show the expected pattern for welfare benefits. 84% (45 of 51) show the expected pattern for voter ID.
Border County Results.
Border counties provide a tighter comparison because neighboring counties are more similar to each other than randomly selected states.
Voter ID borders (2020): Counties in ID-required states averaged 27.9% Democratic; their neighbors in no-ID states averaged 31.0%. Gap: 3.1 percentage points.
Welfare borders (2020): Counties in benefit states averaged 36.9% Democratic; their neighbors in non-benefit states averaged 31.9%. Gap: 5.0 percentage points.
The gaps shrink considerably at the county level (3-5 points vs 14-16 points at state level), which is expected—neighboring counties are more similar than entire states. But the direction remains consistent, and gaps of this magnitude across hundreds of border counties suggest a real pattern rather than noise.
What This Does and Doesn't Show
These are correlations, not causal estimates. The maps show that voter ID laws and welfare benefits track closely with partisan voting patterns—but they don't prove that policies cause voting behavior or vice versa.
States don't adopt policies randomly. Republican-leaning states tend to pass voter ID laws; Democratic-leaning states tend to extend benefits to immigrants. The policies may reflect existing political preferences rather than shape them. Likewise, these policies may entrench pre-existing political preferences by incentivizing voting by illegal immigrants.
The border county analysis helps narrow this gap by comparing similar places, but it still can't rule out that counties on different sides of a state line differ in unmeasured ways that drive both their state's policies and their own voting behavior.
All figures generated programmatically in Python using GeoPandas and Matplotlib with Census Bureau shapefiles. Replication code available on GitHub.
github.com/kevinnbass/vot…
github.com/kevinnbass/vot…
• • •
Missing some Tweet in this thread? You can try to
force a refresh