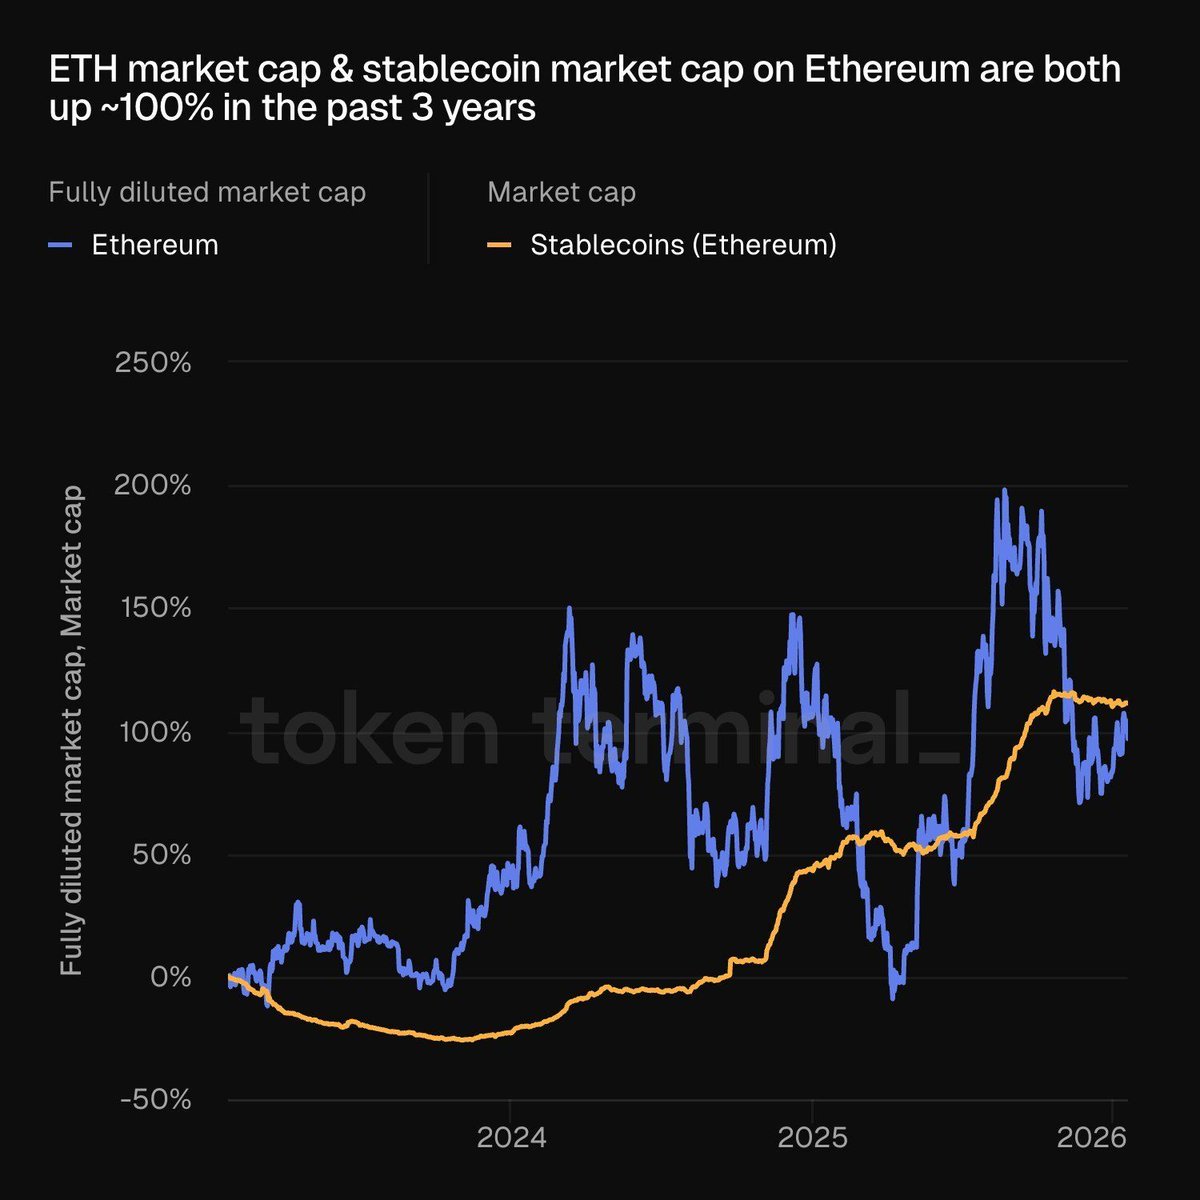
ETH market cap and stablecoin market cap on Ethereum are both up ~100% over the past three years. 📈
They ended up in the same place, but the journey looked very different.
🔹 Stablecoin market cap grew steadily, almost in a straight line
🔹 ETH market cap was volatile, cyclical, and emotional
🔹 Stablecoins reflect real usage and economic activity
🔹 ETH reflects market sentiment, liquidity, and risk cycles
• • •
Missing some Tweet in this thread? You can try to
force a refresh
📊 Ethereum Layer 2 Scaling: Base Achieves New All-Time Highs 📊
1/ Base, currently one of the most popular Layer 2 networks, is experiencing a significant surge in adoption. Recent metrics show remarkable growth:
1.74M 🟢 active addresses—an all-time high.
5.52M 🟢 daily transactions, continuing an upward trend.
11.96 Mgas/s 🟢 throughput, a new peak in network capacity.
2/ Base’s Rapid Growth 📈:
Fast Adoption: Base is leading Ethereum’s Layer 2 landscape with one of the steepest adoption curves.
Increased Throughput: With nearly 12 Mgas/s, Base is scaling efficiently, maintaining sub-cent fees as network usage increases.
3/ Pectra Upgrade on the Horizon 🔧
Ethereum’s upcoming Pectra upgrade will address the growing demand on Layer 2s like Base, introducing PeerDAS to enhance data availability.
Die meisten von euch wissen, dass ich in Sachen #Krypto immer extrem bullish bin, daran hat sich auch nichts geändert😉
Trotzdem möchte ich heute einen interessanten Indikator vorstellen, der darauf hindeutet, dass wir den Boden bei #Bitcoin & Co. noch nicht gesehen haben.
Die Differenz zwischen den Renditen 10-jähriger und 2-jähriger US-Staatsanleihen (Yield Curve) war in den letzten 30 Jahren noch nie so negativ wie heute (rote Linie im Chart).
Diese Entwicklung ist insofern interessant, als dass sich Yield Curves in den USA als hervorragende Frühindikatoren für Rezessionen erwiesen haben.
Immer wenn Yield Curves negativ verlaufen, weil die Renditen kürzerer Laufzeiten über jenen längerer liegen, naht eine Rezession.