Modern and Ancient Genomes Reveal Neolithic Paternal Expansions of Millet and Rice Farmers and Demic Diffusion from China into Mainland Southeast Asia
advanced.onlinelibrary.wiley.com/doi/10.1002/ad…
advanced.onlinelibrary.wiley.com/doi/10.1002/ad…
Abstract
“The genomic formation and diversity of underrepresented southern Chinese and Southeast Asian populations have long fascinated researchers, particularly regarding Late Paleolithic to Holocene expansions and early paternal interactions. Here, we present a large-scale paternal genomic aggregation dataset of 14435 ancient and present-day Eurasian individuals, including 584 newly sequenced whole Y-chromosome genomes. We reconstruct the highest-resolution Y-chromosome phylogeny to date for ancient East and Southeast Asian populations based on our fully resolved modern eastern Eurasian maximum-likelihood phylogenetic framework. We identify 138 paternal lineages that diversify during the Neolithic in a time-calibrated phylogeny and find that 17 dominant lineages are shared between China and Mainland Southeast Asia (MSEA), with a marked expansion beginning ca. 5 kya and peaking between 3.5 and 3 kya. While northern and southern Han populations show minimal paternal differentiation, southern ethnolinguistic minorities exhibit clear substructures, in which coastal groups align with Tai-Kadai speakers, southwestern groups with Hmong-Mien speakers, and highland groups with Tibeto-Burman speakers. Our findings support a demic diffusion model of Neolithic farming and Han culture, highlighting the significant paternal contributions of ancient millet farmers and their Han descendants to the genetic landscape of southern China and MSEA, with subsequent enrichment from rice farmer-mediated expansions.”
“The genomic formation and diversity of underrepresented southern Chinese and Southeast Asian populations have long fascinated researchers, particularly regarding Late Paleolithic to Holocene expansions and early paternal interactions. Here, we present a large-scale paternal genomic aggregation dataset of 14435 ancient and present-day Eurasian individuals, including 584 newly sequenced whole Y-chromosome genomes. We reconstruct the highest-resolution Y-chromosome phylogeny to date for ancient East and Southeast Asian populations based on our fully resolved modern eastern Eurasian maximum-likelihood phylogenetic framework. We identify 138 paternal lineages that diversify during the Neolithic in a time-calibrated phylogeny and find that 17 dominant lineages are shared between China and Mainland Southeast Asia (MSEA), with a marked expansion beginning ca. 5 kya and peaking between 3.5 and 3 kya. While northern and southern Han populations show minimal paternal differentiation, southern ethnolinguistic minorities exhibit clear substructures, in which coastal groups align with Tai-Kadai speakers, southwestern groups with Hmong-Mien speakers, and highland groups with Tibeto-Burman speakers. Our findings support a demic diffusion model of Neolithic farming and Han culture, highlighting the significant paternal contributions of ancient millet farmers and their Han descendants to the genetic landscape of southern China and MSEA, with subsequent enrichment from rice farmer-mediated expansions.”
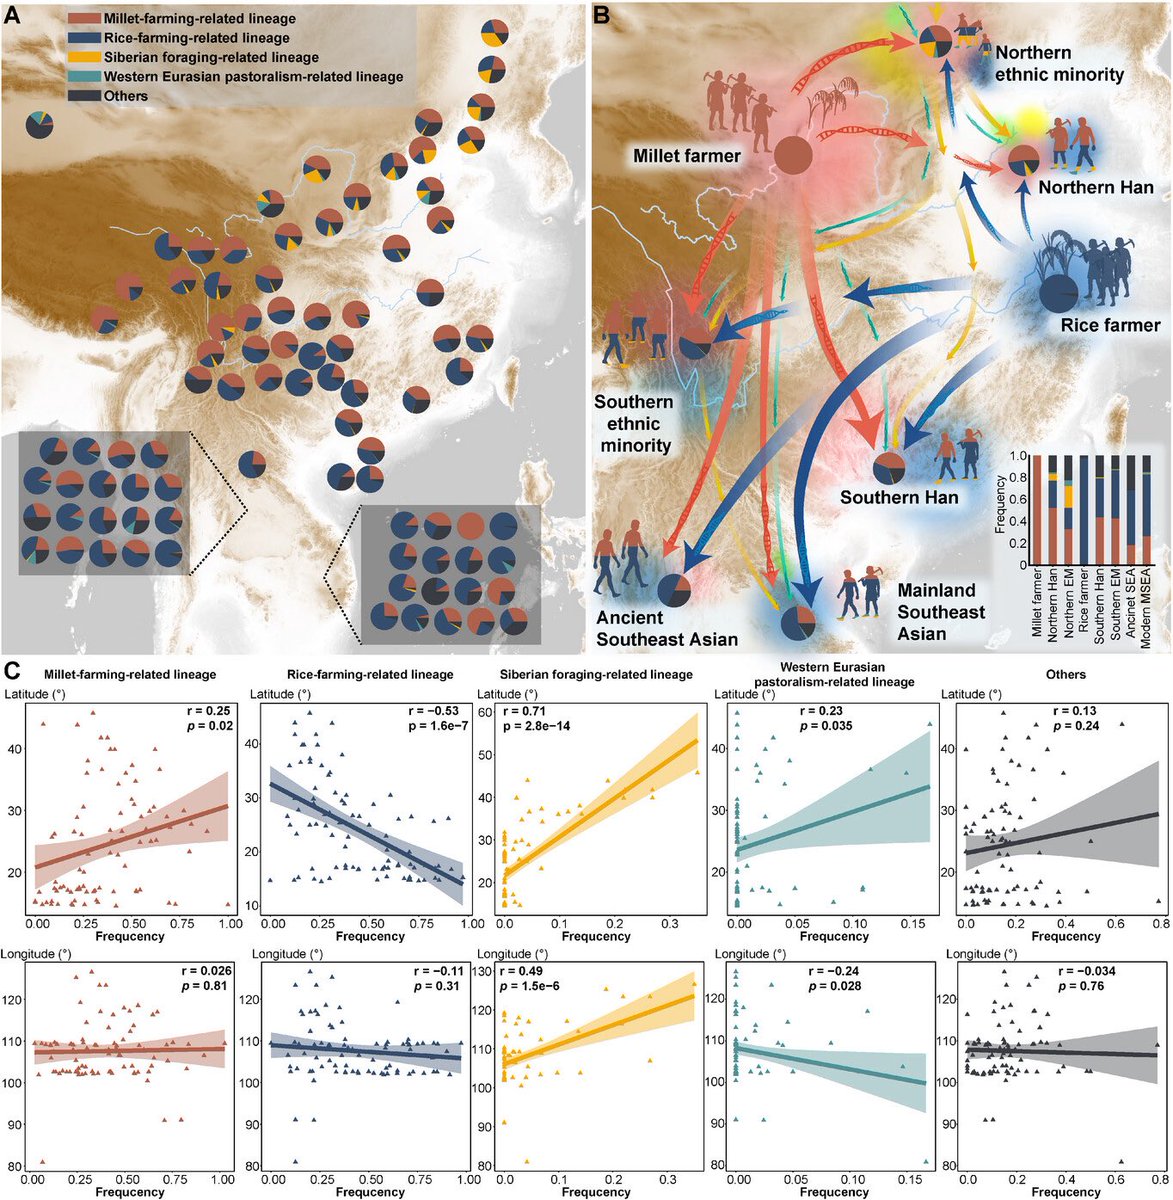
Paternal genetic contributions of ancient agriculturalists to present-day China and MSEA.
(A) Frequencies of subsistence-related paternal haplogroups across 86 Chinese and MSEA populations. MSEA groups are displayed in boxes. Populations on the lower left are from Thailand; those on the lower right are from Vietnam.
(B) Contributions of millet- and rice-farming-associated haplogroups to ancient and modern meta-populations. "EM" denotes ethnic minorities. Arrow colors match the haplogroups shown in (A); arrow thickness corresponds to haplogroup frequencies within each meta-population; arrow paths are schematic and do not represent actual migration routes. Color gradients indicate migration directions, with lighter colors showing origins and darker colors showing destinations. Light blue lines indicate the Yellow and Yangtze Rivers. The inset bar plot shows haplogroup frequencies within each meta-population.
(C) Pearson correlation analysis between the frequencies of subsistence-related haplogroups across Chinese and MSEA populations (n = 86) and geographic coordinates, with p < 0.05 considered significant. Line colors match those in (A).
• • •
Missing some Tweet in this thread? You can try to
force a refresh