I am horrified. I cannot believe it.
I analyzed public databases and media reporting on violent confrontations with ICE over the past year.
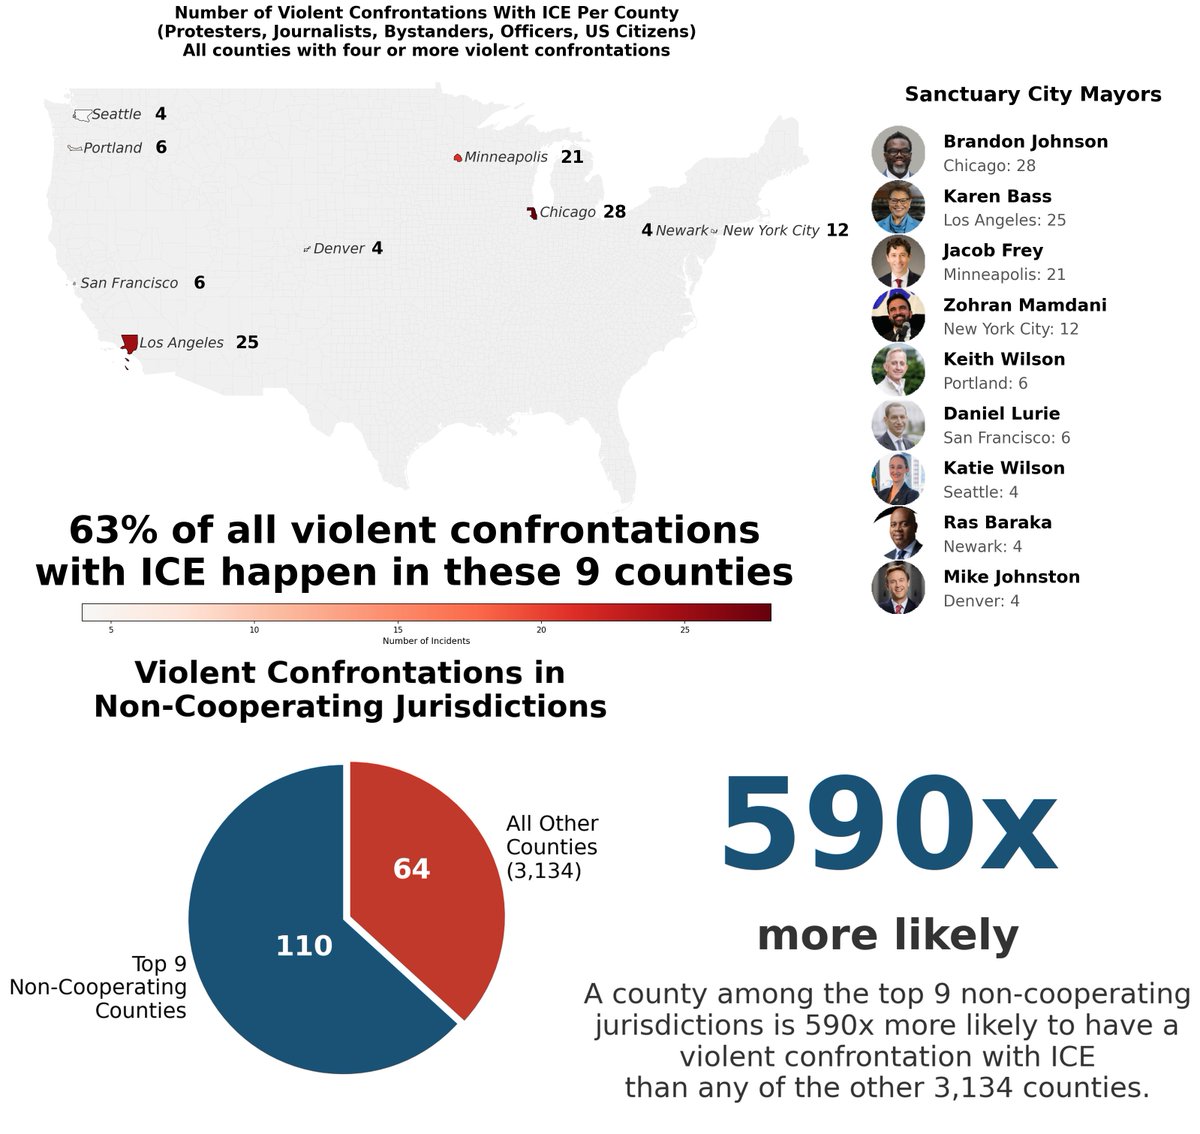
Just 9 counties accounted for TWO-THIRDS of violent confrontations with ICE in America.
This is twice all violent confrontations in the remaining 3,134 counties COMBINED.
A violent confrontation in these 9 counties was 590 TIMES more likely than any of these other 3,134 counties.
590 times.
I plotted these 9 counties, and I found that all 9 counties are sanctuary jurisdictions run by Democrat politicians that resist immigration law enforcement.
These violent confrontations are RARE in states and cities where local officials cooperate with law enforcement.
I analyzed public databases and media reporting on violent confrontations with ICE over the past year.
Just 9 counties accounted for TWO-THIRDS of violent confrontations with ICE in America.
This is twice all violent confrontations in the remaining 3,134 counties COMBINED.
A violent confrontation in these 9 counties was 590 TIMES more likely than any of these other 3,134 counties.
590 times.
I plotted these 9 counties, and I found that all 9 counties are sanctuary jurisdictions run by Democrat politicians that resist immigration law enforcement.
These violent confrontations are RARE in states and cities where local officials cooperate with law enforcement.
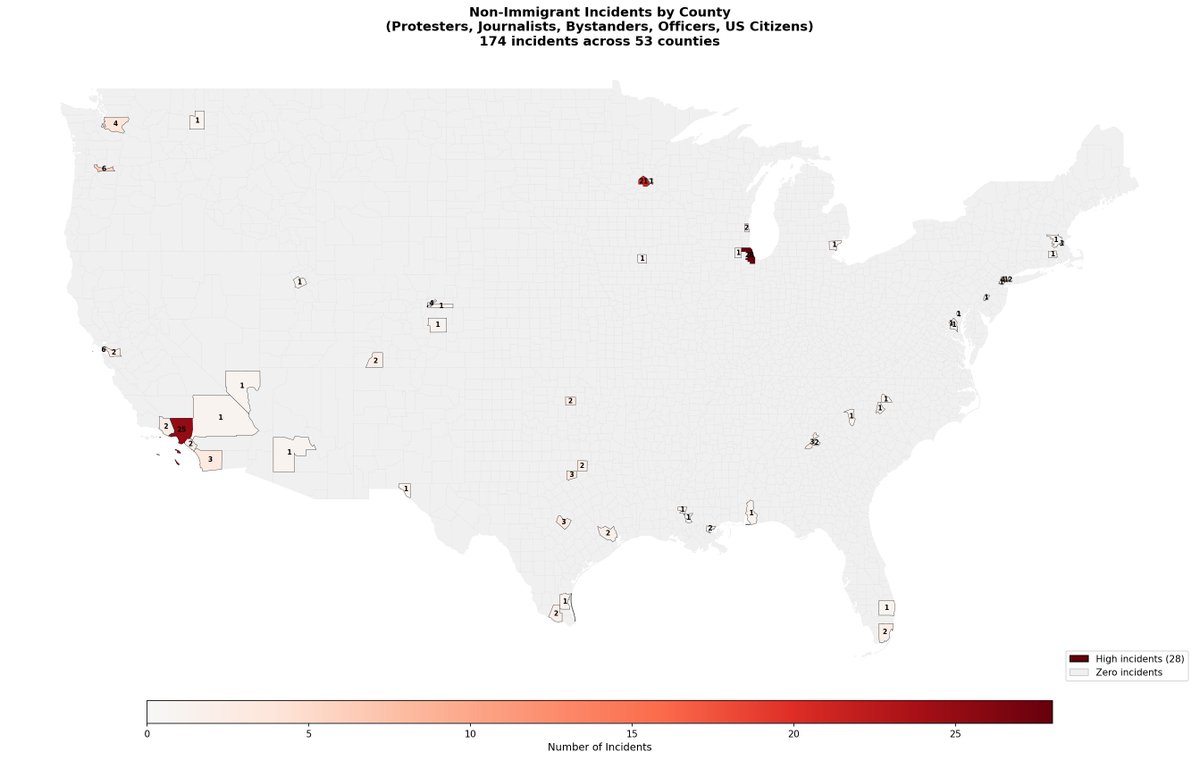
For the above figure, I excluded all counties with 3 or fewer incidents to highlight the counties with the highest concentration of violent confrontations.
For transparency, here is the full figure, which includes the remaining 65 of 175 violent confrontation spread elsewhere.
For transparency, here is the full figure, which includes the remaining 65 of 175 violent confrontation spread elsewhere.
The major cities in these top 9 counties are well-known:
Chicago is at the top, with Brandon Johnson as mayor.
Then, in order:
Los Angeles (Karen Bass)
Minneapolis (Jacob Frey)
New York City (Zohran Mamdani)
Portland (Karen Wilson)
Then San Francisco, Seattle, Newark, and Denver.
Chicago is at the top, with Brandon Johnson as mayor.
Then, in order:
Los Angeles (Karen Bass)
Minneapolis (Jacob Frey)
New York City (Zohran Mamdani)
Portland (Karen Wilson)
Then San Francisco, Seattle, Newark, and Denver.
Methodology and detailed findings
ICE ENFORCEMENT INCIDENTS ANALYSIS (2025-2026)
An analysis of violent confrontations between ICE agents and non-immigrants
(protesters, journalists, bystanders, officers, and US citizens) during
immigration enforcement operations.
KEY FINDING: EXTREME GEOGRAPHIC CONCENTRATION
The top 9 counties account for 63% of all violent confrontations with non-immigrants nationwide.
A violent confrontation is 590 TIMES MORE LIKELY in the top 9 counties than in any of the other 3,134 US counties.
BY THE NUMBERS
Total non-immigrant incidents: 174
Incidents in top 9 counties: 110 (63%)
Incidents in remaining 3,134 counties: 64 (37%)
Counties with 4+ incidents: 9
Per-county likelihood ratio: 590x
TOP 9 COUNTIES (4+ incidents each)
Rank County City Incidents Mayor
---- ------ ---- --------- -----
1 Cook County, IL Chicago 28 Brandon Johnson
2 Los Angeles Co, CA Los Angeles 25 Karen Bass
3 Hennepin County, MN Minneapolis 21 Jacob Frey
4 New York County, NY New York City 12 Zohran Mamdani
5 Multnomah County, OR Portland 6 Keith Wilson
6 San Francisco Co, CA San Francisco 6 Daniel Lurie
7 King County, WA Seattle 4 Katie Wilson
8 Essex County, NJ Newark 4 Ras Baraka
9 Denver County, CO Denver 4 Mike Johnston
All 9 counties are in jurisdictions with sanctuary policies that limit cooperation with federal immigration enforcement.
WHAT COUNTS AS A "VIOLENT CONFRONTATION"
This analysis focuses on confrontations involving people who are NOT the targets of immigration enforcement:
- Protesters: Individuals at demonstrations against ICE operations
- Journalists: Press covering enforcement actions
- Bystanders: Uninvolved individuals caught in enforcement operations
- US Citizens: American citizens wrongfully detained, assaulted, or deported
- Officers: ICE/CBP agents injured in attacks on facilities
These are tracked separately from incidents involving detainees or enforcement targets.
DATA SOURCES
The data comes from multiple sources, organized by reliability:
TIER 1 - Official Government Data (49 incidents)
Sources: ICE Detainee Death Reporting, DOJ records, court filings
TIER 2 - Investigative Journalism (69 incidents)
Sources: The Trace, ProPublica, NBC News investigations
TIER 3 - Systematic News Search (218 incidents)
Sources: AP, Reuters, major outlets via defined search methodology
TIER 4 - Ad-Hoc News Reports (64 incidents)
Sources: Local news, verified social media reports
TOTAL: 400 documented incidents (174 involving non-immigrants)
HOW THE DATA WAS COLLECTED
Tier 1 (Official Data):
- ICE Detainee Death Reporting website
- American Immigration Lawyers Association death tracking
- DOJ court records and federal litigation filings
- FOIA releases
Note: ICE stopped publishing death reports after October 2025
Tier 2 (Investigative Journalism):
- The Trace: ICE/CBP shootings tracker
- ProPublica: US citizens detained/deported investigation
- ProPublica: Less-lethal weapons documentation
- ProPublica: Banned chokeholds video evidence
- NBC News: ICE shootings compilation
- ACLU litigation filings
Tier 3 (Systematic News Search):
- Defined source list: AP, Reuters, NBC, CBS, ABC, CNN, major regional papers
- Search terms: "ICE shooting", "ICE protest", "CBP force", etc.
- Date range: January 20, 2025 - January 26, 2026
- Each incident verified against at least one additional source
Tier 4 (Ad-Hoc Reports):
- Local newspapers
- Verified social media posts
- Community organization reports
- Each record includes source URL for verification
SANCTUARY STATUS CLASSIFICATION
Primary source: DOJ Sanctuary Jurisdiction List (Executive Order 14287)
Secondary source: ILRC State Map on Immigration Enforcement
Categories:
- Sanctuary: State/local policy limits cooperation with ICE
- Anti-sanctuary: State law requires cooperation with ICE
- Neutral: No formal policy either direction
- Cooperative: Voluntarily cooperates with ICE detainers
KNOWN LIMITATIONS
1. Media coverage bias - Sanctuary jurisdictions may receive more media attention, potentially inflating incident counts in those areas
2. ICE reporting gaps - ICE stopped publishing death reports after October 2025
3. Selection bias - Tier 3-4 data has higher selection bias risk
4. Known undercounts:
- ProPublica found 170+ US citizen detentions; ~50 documented here
- The Trace identified 26 shootings; 19 with full details here
- GAO found ICE couldn't provide 5 years of use-of-force data
DATA COVERAGE
Time period: January 20, 2025 - January 26, 2026
Geographic scope: All 50 US states + DC
Last updated: January 26, 2026
FOR MORE INFORMATION
The full dataset with source URLs for each incident is available in the data files. Each incident record includes the original news source for verification.
Discussion
Democrat media and politicians antagonize and agitate activists in these cities, encouraging violent confrontation.
We now have evidence that in Minneapolis, the Lieutenant governor herself was coordinating violent resistance.
Judges have repeatedly dismissed cases of violent assault by activists in these cities against ICE agents.
This allows these activists to act with impunity. It emboldens them.
The media never talks about this.
The American public not understanding the strategy is required for it to work.
On the other hand, any time an ICE agent makes a mistake after being constantly threatened, often with deadly force from these activists, the media talks about it constantly.
What's clear is that these cities do not represent America.
They represent a violent, activist extreme, supported by a phalanx of activist judges and media.
These extremists are trying to create and provoke violence in these decaying, dying parts of the country.
Their hope, it appears, is to hamper and eliminate immigration enforcement around the country.
After the Covid pandemic, I was horrified that science wasn't safe from politics. When I spoke up, I was dismissed from medical school, smeared, my reputation destroyed. Donations much appreciated for the legal fight to reveal the truth. givesendgo.com/kevinbasslegal
To explain the 590x number more clearly:
If you take the number of incidents in the top 9 counties and compare the number of incidents in the remaining 3,134 counties
You're 590x more likely to have an incident in one of these top 9 counties than in one of these 3,134 counties
If you take the number of incidents in the top 9 counties and compare the number of incidents in the remaining 3,134 counties
You're 590x more likely to have an incident in one of these top 9 counties than in one of these 3,134 counties
I have just corrected a minor error in the methodology, related to calculating the ratio.
The ratio *was* based on the tier 3 and 4 sources.
The update is included in the github readme file.
The possible interpretations that this opens up (likely not correct--but admittedly possible) are still very unfavorable to left-wing narratives.
I did take these interpretations into account before posting. Science is very complex and I always simplify for social media but I also always take into account "forking interpretations" to ensure that my analyses cleave to the substantial truth (i.e., they introduce what might be called "narrative dilemmas" no matter which interpretations critics choose).
Only a tiny percentage of scientists will understand what I mean by all of the above. I've chosen politics (or rather, politics chose me), but I'm always more than happy to discourse with scientists. In the end, politics without truth is empty--and potentially catastrophic. That's one big reason why we must always keep insisting on science.
Some have said that some of my source's URLs do not work. I therefore built a robust validation script and also reviewed them myself.
All 586 sources should now work. In addition, the full text from 573 articles are now available for review on github.
All 586 sources should now work. In addition, the full text from 573 articles are now available for review on github.
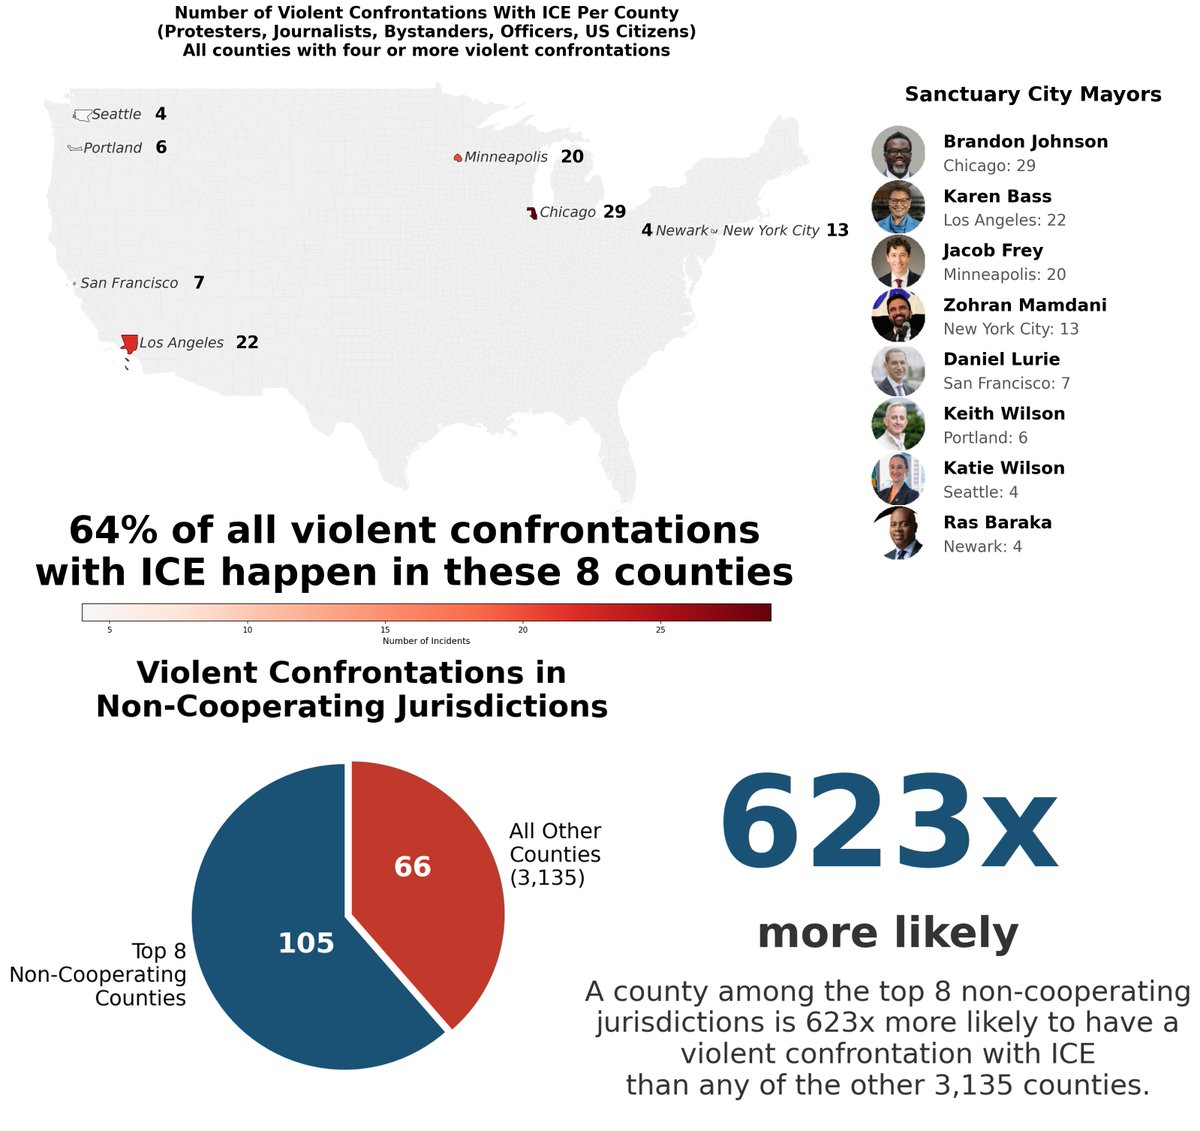
In the process of fixing the data, Denver was dropped from the top 9, fewer than 4 incidents. The others changed slightly.
8 counties now account for 64% of violent confrontations, with 623x higher rate among the top 8.
The story got stronger. Thanks to the critic.
8 counties now account for 64% of violent confrontations, with 623x higher rate among the top 8.
The story got stronger. Thanks to the critic.
• • •
Missing some Tweet in this thread? You can try to
force a refresh