Peter - Cracking Markets Profile picture
Feb 3 7 tweets 3 min read Read on X
Terrified of buying the top in Gold, Bitcoin, or the Nasdaq? But afraid of missing the next leg up?

You aren't alone. This is the "Trader's Dilemma."

The solution isn't a crystal ball. It is a system.

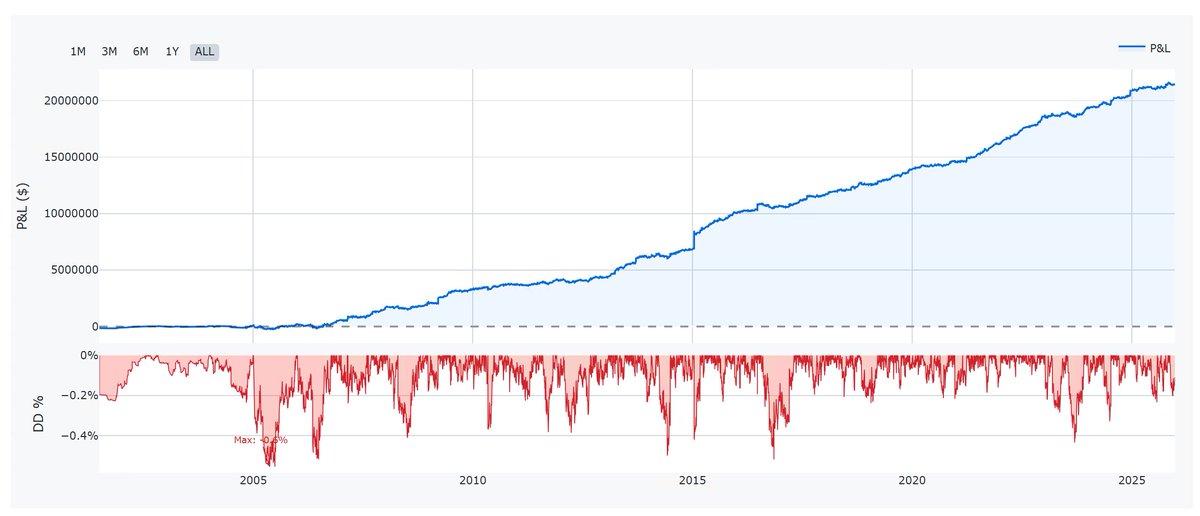
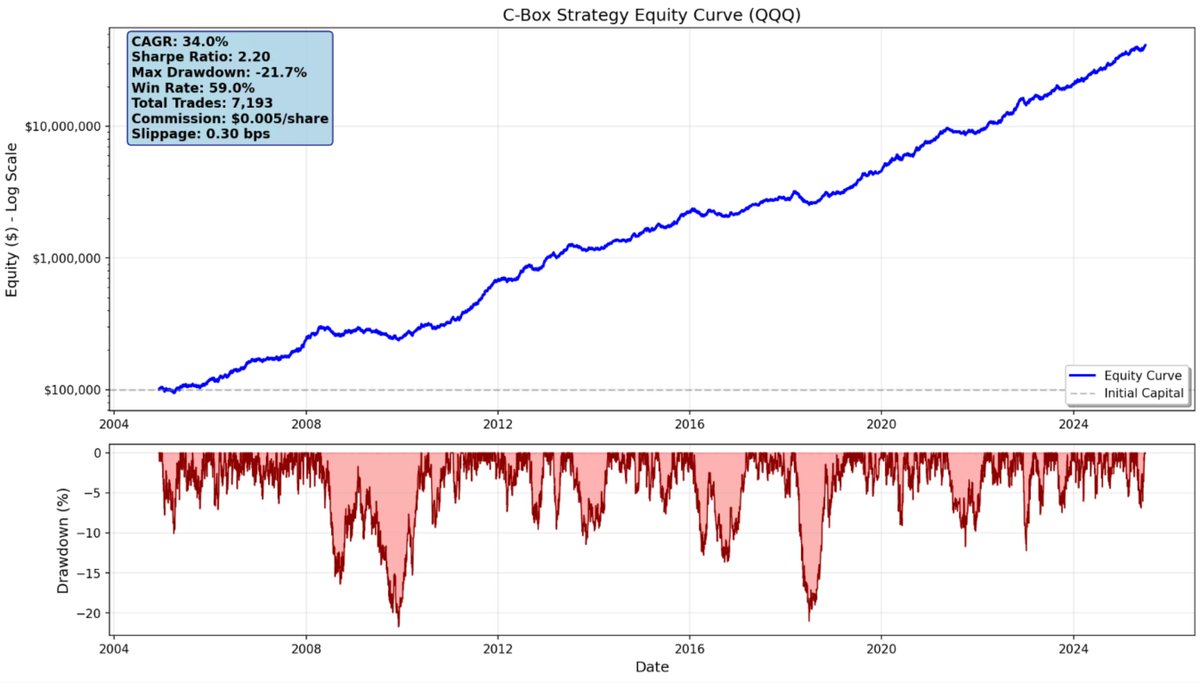
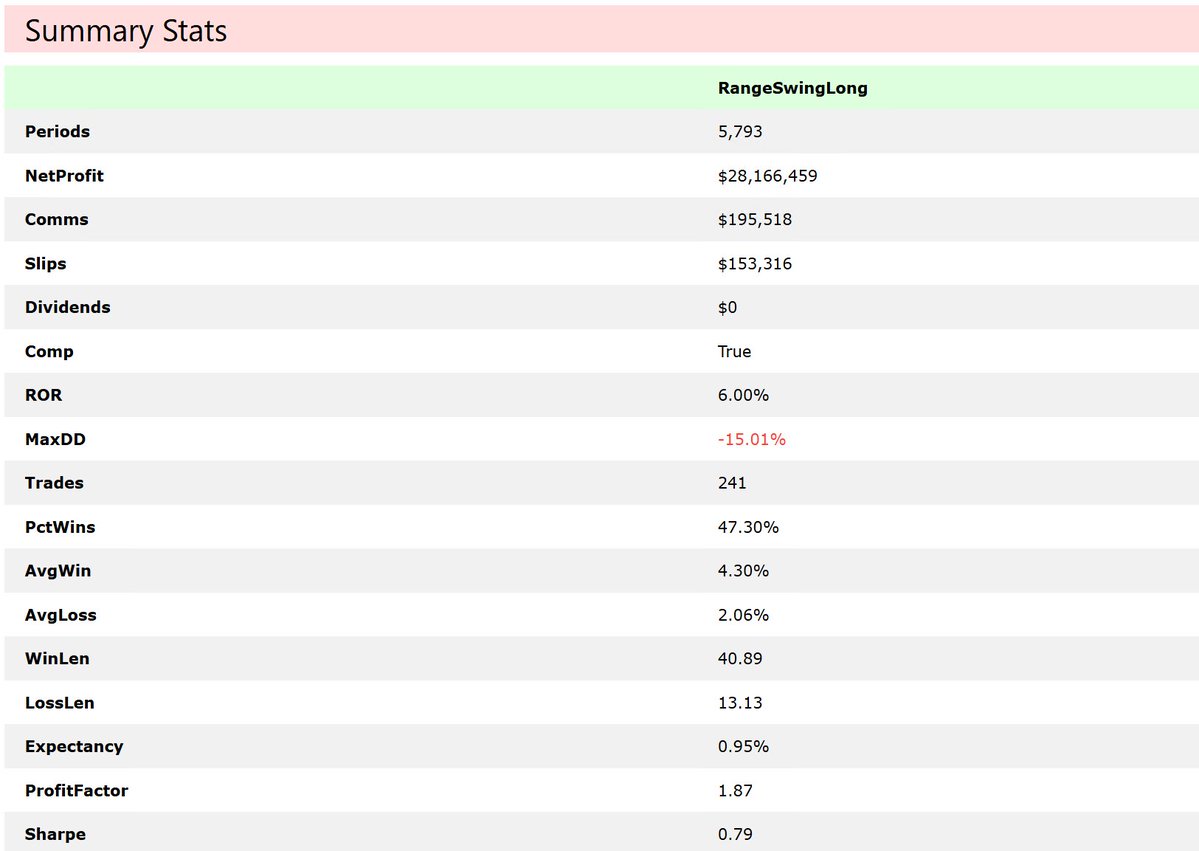
Here is a robust framework catching "fat tails" while keeping Max Drawdown to just -15%.

Full logic below 🧵Image
1/ The Philosophy

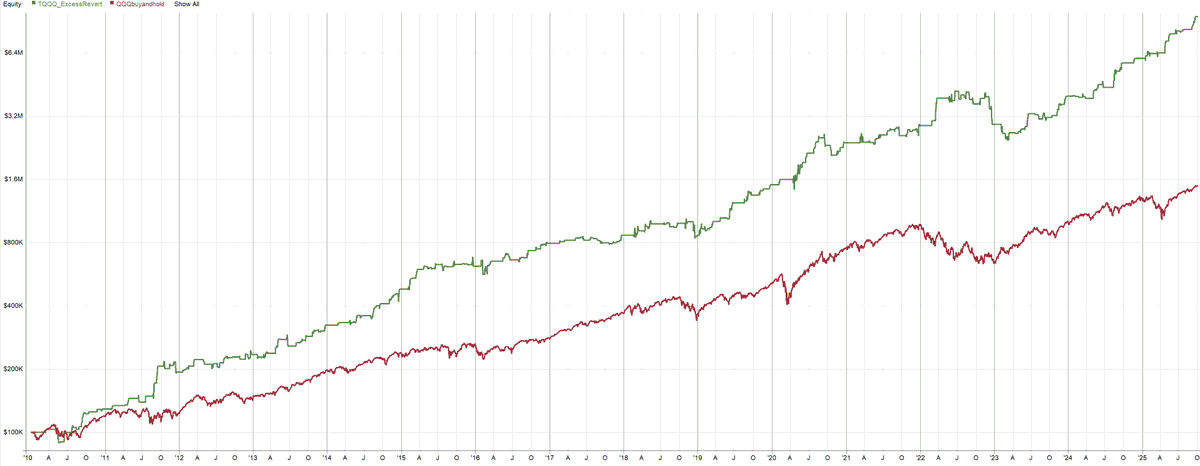
We are trading a classic Trend Following architecture. Assets: Gold ($GC), Nasdaq ($NQ), Micro Bitcoin ($MBT).

Why these three?
- High Volatility
- Hard Trends
- Low Correlation

We don't guess when they move. We set a trap and wait for price to trigger it.
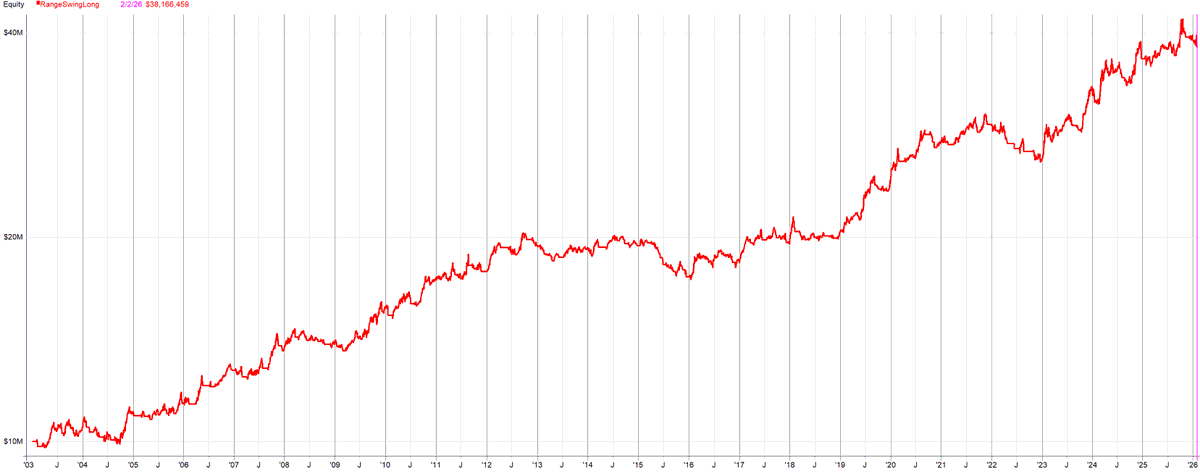
2/ The Setup

Simple systems are robust systems. This approach is time-tested.

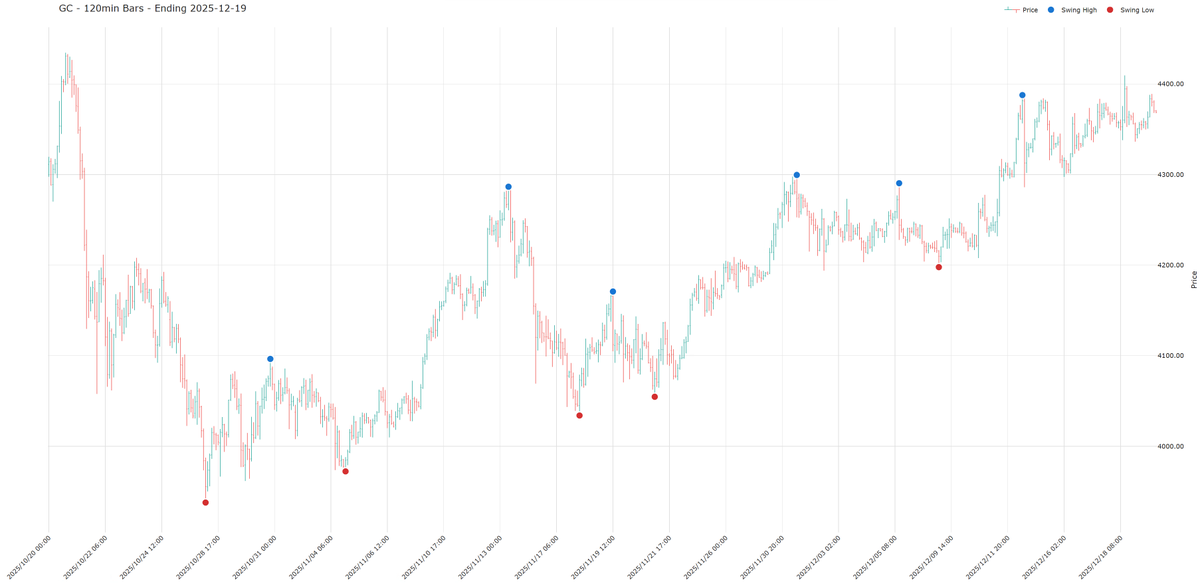
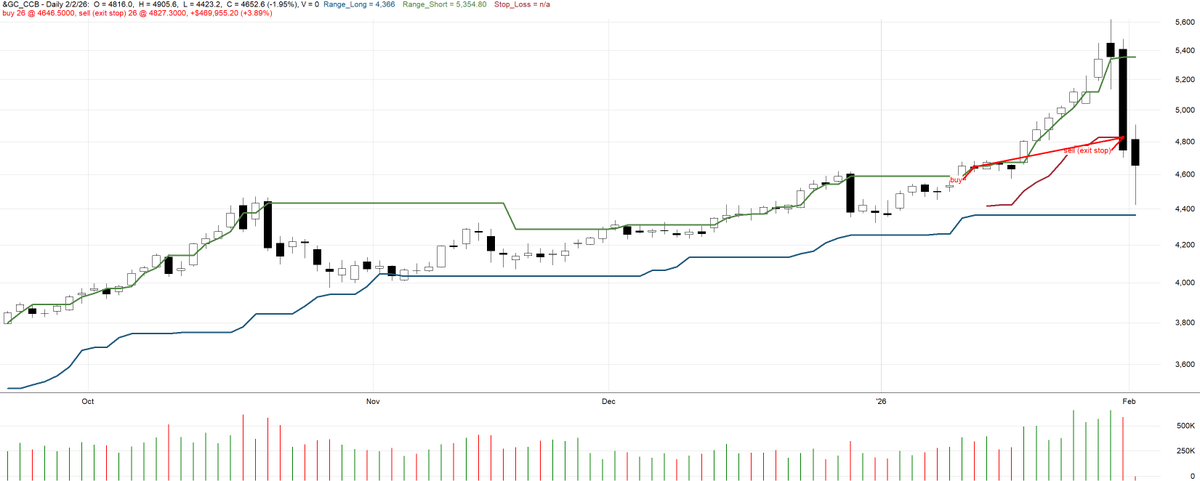
We combine a Donchian Channel (Trend) with a Chandelier Stop (Risk).

The Rules:
• Timeframe: Daily
• Trend Filter: 20-Day Donchian
• Volatility: 5-Day ATR

ENTRY (The Breakout): IF Close > Highest High (20 days) THEN Buy Long.Image
3/ Risk Management

This is where you survive.

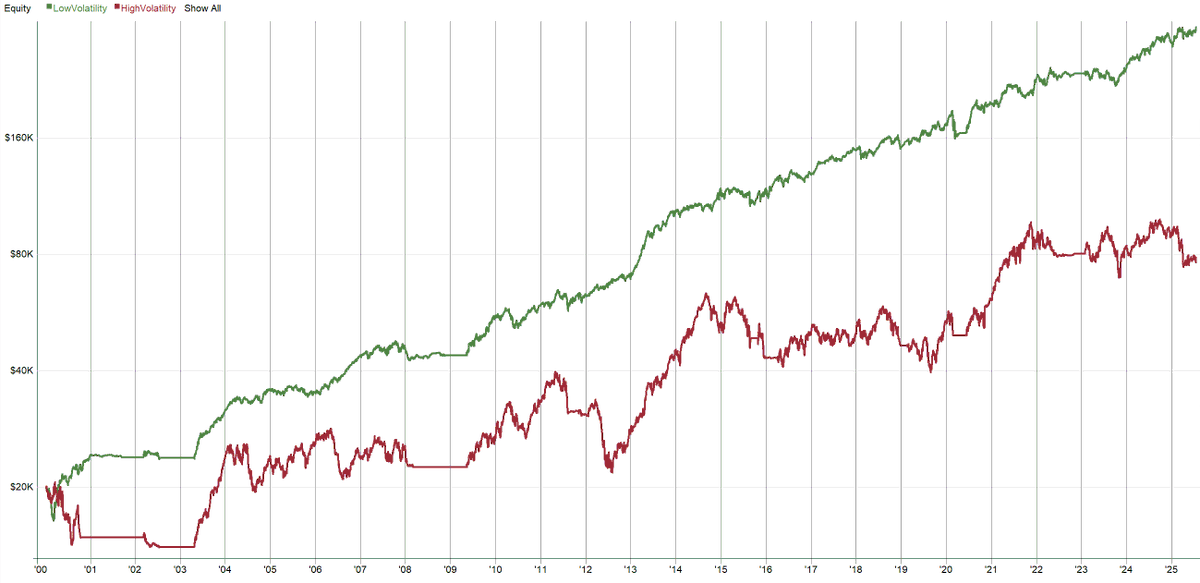
POSITION SIZING (Volatility Targeting): We risk 2% of equity per trade.
• Stop Distance = 3 * ATR(5)
• Size = (Account * 0.02) / Stop Distance

The Insight: If Volatility (ATR) goes UP, our Position Size goes DOWN. We equalise risk across Bitcoin and Gold.
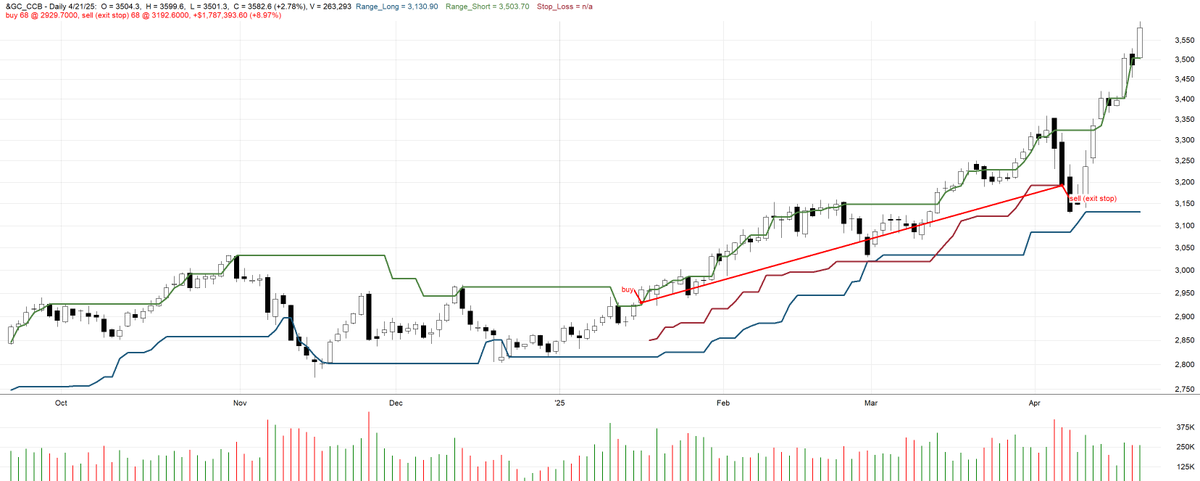
4/ The Exit (Two-Stage Mechanism)

We use two exits:

A. Protective Stop (The Shield): Trail a stop at Highest High - (3 * ATR). Saves us if a breakout fails instantly.

B. Technical Exit (The Signal): Sell if Close < Lowest Low (20 days). Confirms the trend is actually over. Image
5/ The Hardest Part: Psychology
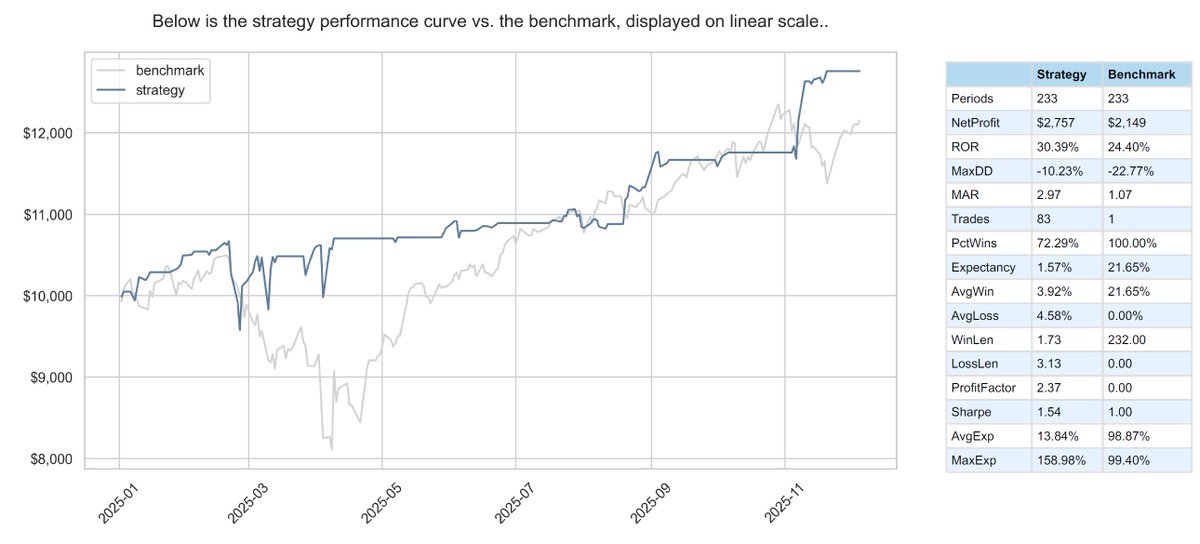
Look at the stats:
• Win Rate: 47.3%
• Avg Win: 4.30%
• Avg Loss: 2.06%

We are wrong more often than right.

But trading a system is psychologically easier than guessing tops and bottoms. You stop fighting the market and start executing the plan.Image
6/ Next Steps

Stop trying to time the exact bottom. You will miss. Start measuring the breakout.

Systematic execution > Emotional guessing.

Note: This is a foundational framework, not a "black box" solution. But it beats discretionary guessing every time.

Tools used: RealTest & Norgate Data.

If you found value in this breakdown:
- Retweet the first tweet to share the alpha.
- Follow me for more systematic trading deep dives.

• • •

Missing some Tweet in this thread? You can try to force a refresh
 

Keep Current with Peter - Cracking Markets

Peter - Cracking Markets Profile picture

Stay in touch and get notified when new unrolls are available from this author!

Read all threads

This Thread may be Removed Anytime!

PDF

Twitter may remove this content at anytime! Save it as PDF for later use!

Try unrolling a thread yourself!

how to unroll video
  1. Follow @ThreadReaderApp to mention us!

  2. From a Twitter thread mention us with a keyword "unroll"
@threadreaderapp unroll

Practice here first or read more on our help page!

More from @SystematicPeter

Jan 5
Most traders fade resistance. They bet on the reversal.

I ran a raw probability test across 40 futures markets over 25 years - 40,000+ breakout events.

The data is clear: fading strong swings is usually the wrong bet.

Here is the truth about Swing Breakouts. 🧵 The chart displays the theoretical potential (gross profit) of the breakout principle itself without applying costs and risk management.
1/ What is a "Swing"?

A swing is a prior pivot high/low that held for a while - a level the market respected.

In this test:
- Swing = the most recent significant daily pivot high/low
- “Significant” = at least ~1x ATR separation vs the prior pivot (to avoid noise)

It is not just a line. It is a liquidity pocket.Gold futures 120-min candlestick chart showing rising trend with marked swing highs (blue) and swing lows (red) around 4000–4400 price levels.
2/ The Experiment

Goal: isolate the signal BEFORE filters and optimization.

- Markets: 40 futures (indices, commodities, bonds)
- Entry: first break of the prior significant daily swing
- Exit: time-based, hold 1 hour
- Optimization: none (same rules across markets)
- Costs: none (raw probability test)

Question: after the break, does price continue or snap back?
Read 8 tweets
Dec 8, 2025
In January 2025, I published a mean reversion strategy with a free backtester.

11 months later, here are the out of sample results:

- +30.4% return (vs +24.4% Nasdaq)
- -10.2% max drawdown (vs -22.8% Nasdaq)
- 72% win rate
- 83 trades

Here's the exact system: Image
The idea is simple:

Buy stocks that drop sharply - but only if they're still in an uptrend.

Short-term panic creates opportunity.
Long-term trend provides the safety net.

This is mean reversion 101.
Entry rules:

1. Stock is above its 200-day MA (uptrend filter)
2. Stock drops more than 3% in one day (panic signal)
3. Next day: place limit buy at 0.9 × ATR(5) below close

You're buying the dip - then waiting for an even cheaper price. Image
Read 10 tweets
Oct 2, 2025
Leveraged ETFs can be a great source of alpha — if you treat them as mean-reverting wrappers 📉📈 rather than long-term investments.

Here’s a simple $TQQQ / $QQQ swing strategy that beat buy & hold with only 24% average capital use 👇 Image
Leveraged ETFs (like $TQQQ, 3× $QQQ) don’t perfectly track their target.

⚡ Daily compounding
⚡ Volatility drag
⚡ Rebalancing frictions

Result: “Excess decay” appears when TQQQ underperforms its ideal 3× of QQQ over short horizons. That excess tends to mean revert.
We quantify the excess:

ExcessN = log-return(TQQQ,N) – 3 × log-return(QQQ,N)

Then normalize with a Z-score → ExcessZ.

📥 Entry: on close when ExcessZ ≤ –1.0 (TQQQ too cheap vs 3× QQQ)
📤 Exit: on close when ExcessZ ≥ 0, after 5 bars, or if ExcessZ ≤ –3.0 (fail-fast).
Read 6 tweets
Jul 24, 2025
1/6 The Power of "Boring": How Low Volatility Supercharges Mean Reversion

Mean reversion is a popular concept, but it doesn't work the same on all stocks.

I backtested the exact same system on two different baskets of stocks. The difference in performance is stunning. Here's the one factor that changes everything. 🧵👇Image
2/6
The system is the same - a long-only, mean-reversion strategy on S&P 500 stocks:

🟩 Green Line = Prioritizes LOW-volatility stocks
🟥 Red Line = Prioritizes HIGH-volatility stocks

The chart speaks for itself. Low volatility is smoother, safer, and vastly more profitable.
3/6 So, why does "boring" win?

Mean reversion needs a reliable "mean" to revert to.

Low-volatility stocks are stable. Price drops are often overreactions, making a snap-back likely.

High-volatility stocks are unpredictable. A sharp drop might be a "falling knife," not a bargain.
Read 6 tweets
Jul 2, 2025
Getting more and more tradable systems designed by LLMs.
This is what I’ve learned actually works for me.
👇 Step-by-step breakdown of the process that turns AI ideas into real systems I can paper trade. Image
1/
I start in ChatGPT (o3 model).
I use a custom bio where I describe myself as an experienced trader—this primes it into “expert mode.”
Then I share a picture from a real trading session and describe the context.

In this case: intraday breakout from a volatility “squeeze.”
I explain the type of data I have + what kind of realistic performance I expect (after slippage & fees).
Then I ask GPT to brainstorm and rank strategies by:
- difficulty to implement
- likelihood of working live
2/
That prompt usually delivers surprisingly good ideas.
I pick the one that makes the most sense intuitively.

Then I ask GPT to:
- write a full, detailed trading plan
- create step-by-step implementation instructions for a programmer to code it into a backtester
Read 11 tweets
May 5, 2025
1/5 Let's talk about something crucial but often overlooked in deep research, especially in systematic trading: Note-Taking. 📝
When you're diving into years of complex research, building strategies, and testing hypotheses, how you organize your knowledge is paramount. Without structure, you'll inevitably find yourself going in circles, re-discovering old insights, or losing valuable connections.
It's a huge, hidden productivity drain. You need more than just scattered files; you need a second brain.Image
2/5 My personal game-changer?
The Zettelkasten Method, implemented using Obsidian (@obsdmd). 🧠 Obsidian is free and works directly with plain Markdown (.md) files stored locally on your computer. This means:
✅ You truly OWN your data.
✅ No internet required – full offline access.
✅ Notes are simple text files, readable by anything, forever.
This isn't just storage; it's about connecting notes into a powerful knowledge network – a 'second brain'. Optional sync keeps it available across devices if needed.
3/5 The real power boost within Obsidian comes from the Dataview plugin. Think of it as a dynamic query engine layered on top of your notes. 🚀 By adding simple metadata (like status: backtesting, asset_class: equities, strategy_type: mean_reversion, priority: high) I can create live dashboards and lists. Imagine instantly querying:

- All trading systems currently being researched.
- Ideas that haven't been tested yet.
- Notes related to a specific paper or dataset that have backtest etc.

It transforms static notes into an interactive research database.
Read 5 tweets

Did Thread Reader help you today?

Support us! We are indie developers!


This site is made by just two indie developers on a laptop doing marketing, support and development! Read more about the story.

Become a Premium Member ($3/month or $30/year) and get exclusive features!

Become Premium

Don't want to be a Premium member but still want to support us?

Make a small donation by buying us coffee ($5) or help with server cost ($10)

Donate via Paypal

Or Donate anonymously using crypto!

Ethereum

0xfe58350B80634f60Fa6Dc149a72b4DFbc17D341E copy

Bitcoin

3ATGMxNzCUFzxpMCHL5sWSt4DVtS8UqXpi copy

Thank you for your support!

Follow Us!

:(