Basic Trend Following: Primer
We’re going to have a more substantive note from @prometheusmacro on how we construct our basic trend program with the empirics.
1/ This thread will focus on the concepts and exact steps to constructing our Basic Trend Program
We’re going to have a more substantive note from @prometheusmacro on how we construct our basic trend program with the empirics.
1/ This thread will focus on the concepts and exact steps to constructing our Basic Trend Program

2/ Motivations
If you don’t care why we’re giving away a systematic strategy that beats beta, for free— skip to the next.
I believe that a basic trend program stacked on beta is one of *the most* defensible things you can do as an investor. It’s intuitive, empirically backed, and largely suits most investor psychology.
BUT I think there are a huge number of people— both in mid-tier institutional and retail strategist settings that are effectively using trend to “move money from the clients pocket into their pocket”. The playbook is simple— you trend follow, but then shroud you trend following in all kinds of marketing and fancy analysis. “Long term fundamental views, with technical execution” is a phrase used and it an often (not always) a tell. This means there are two parts to the return stream offered by the strategist/manager: the long term view part and the trend following part. For most— the trend will dominate the execution, views and performance. The long-term part rarely has edge. Our objective with making this portfolio free is to share the trend following part with total transparency— so you can judge.
Additionally, we think the barriers to entry to trend following are near zero. As such, we think the price to replicate it in a DIY way should also be zero.
The hope here is that people get a good benchmark to measure market strategy, while also providing a Portoflio solutions that’s accessible and easy to follow for anyone with a brokerage account.
Philosophy section completed. Congratulations (to me)
3/ Lets start with an overview. The steps are straightforward:
1. Beta/Benchmark Selection
2. Two-Speed, Binary Trend
3. Risk Parity
4. Dynamic Leverage + Max Vol Cap
For the aficionados— this will all be very vanilla. Step 4 may be of interest though….
1. Beta/Benchmark Selection
2. Two-Speed, Binary Trend
3. Risk Parity
4. Dynamic Leverage + Max Vol Cap
For the aficionados— this will all be very vanilla. Step 4 may be of interest though….
4/ Benchmark Selection
We start with a benchmark of 60% stocks, 15% bonds, 15% gold, 10% bitcoin.
Why? The stocks, gold and bitcoin portfolio, as advocated for by Paul Tudor Jones— has become quite popular recently. We add bonds in because we think skipping them as….
We start with a benchmark of 60% stocks, 15% bonds, 15% gold, 10% bitcoin.
Why? The stocks, gold and bitcoin portfolio, as advocated for by Paul Tudor Jones— has become quite popular recently. We add bonds in because we think skipping them as….
5/……a defensive asset is a mistake. The weights (60/15/15/10) are far from optimal. But they are just a bit of re-organisation of the classic 60/40 of stocks/bonds, splitting up bond allocation.
This seems reflective of the popular zeitgeist, but doesn’t go overboard….
This seems reflective of the popular zeitgeist, but doesn’t go overboard….
6/ ……. by dropping bonds entirely.
Is it perfect? No.
But it covers all the popular assets and somewhat accounts for their volatility. So we’ll take it since it’s what’s most appealing to people.
Is it perfect? No.
But it covers all the popular assets and somewhat accounts for their volatility. So we’ll take it since it’s what’s most appealing to people.
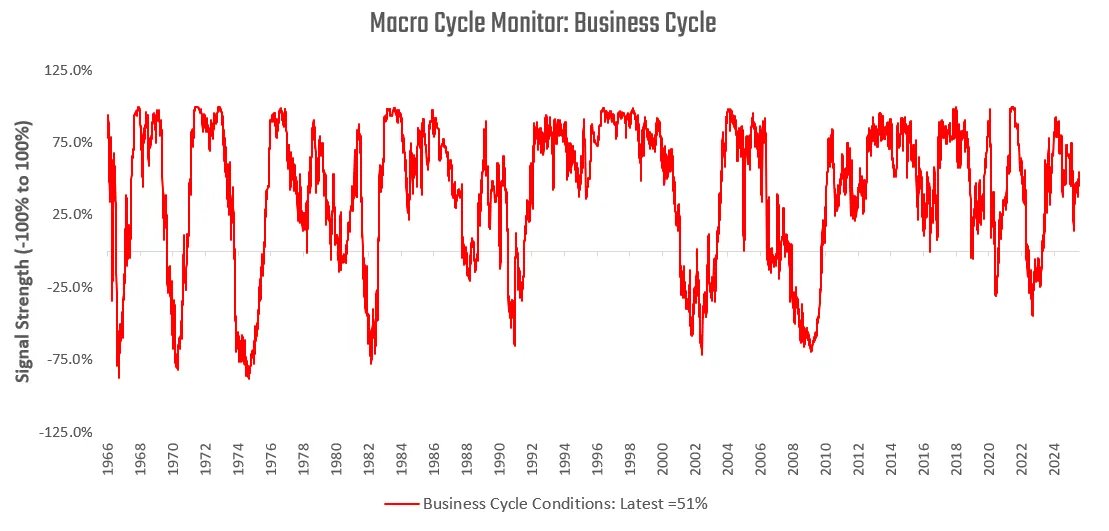
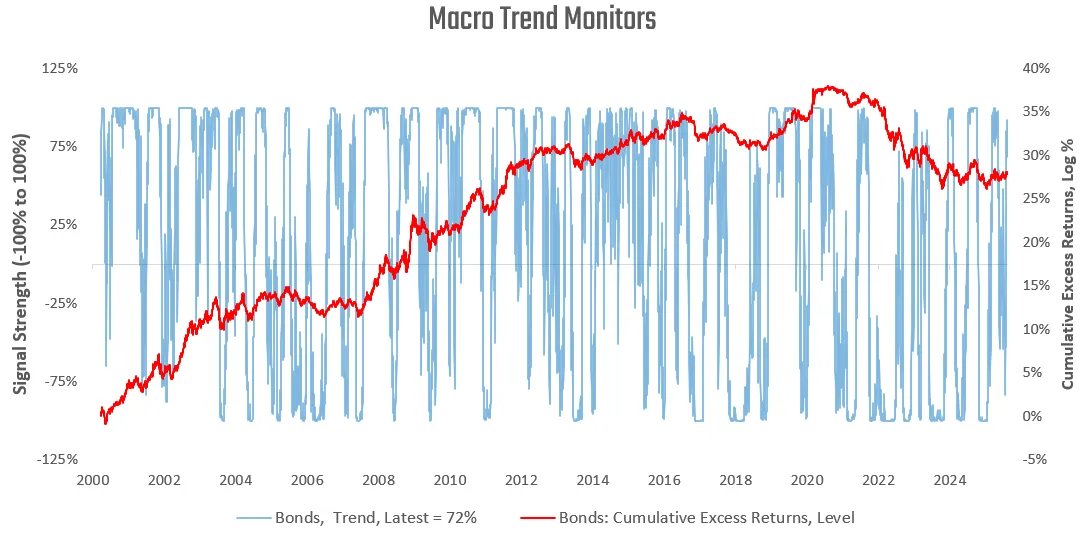
7/ Two-Speed, Binary Trend
Trend following is a very established way of investing. Economies move in trends, and asset markets move to reflect those trends. When you trend follow the big, liquid markets, which have opposing economic biases…..
Trend following is a very established way of investing. Economies move in trends, and asset markets move to reflect those trends. When you trend follow the big, liquid markets, which have opposing economic biases…..
8/ ……. you get a portfolio which adapting to the macroeconomic environment.
There is way more information in following a trend in stocks, bonds and commodities, than there is in the top 10 stocks. So our benchmark is a good base to trend follow…
There is way more information in following a trend in stocks, bonds and commodities, than there is in the top 10 stocks. So our benchmark is a good base to trend follow…
9/ So how do we practically follow the trends here?
- We take two look-back windows— 1 month and 6 months.
- If price are rising over both periods, we take a full position
- I the trends are opposed, we take a half position
- if both are negative we go flat
- We take two look-back windows— 1 month and 6 months.
- If price are rising over both periods, we take a full position
- I the trends are opposed, we take a half position
- if both are negative we go flat
10/ We don’t apply shorts here. Why?
One reason is it’s more expensive and introduces more management.
The other reason is that the assets in the basket tend to have an upwards drift over time, and successfully shorting them requires a more tactical approach
One reason is it’s more expensive and introduces more management.
The other reason is that the assets in the basket tend to have an upwards drift over time, and successfully shorting them requires a more tactical approach
11/ Why those look-backs?
Those look-backs aren’t “optimal” in any way. They simple confer to common behavioural tendencies for most investors we’ve encountered. You can change the look backs to whatever you like. We’ve just found this to be the goldilocks for addressing people’s fears and doubts
“Oh no markets are crashing”— 1 month trend gets you sized down
“On no markets are rallying from the lows”— 6 month trend helped your participate
By all means, pick your look-back based on what you like it’s not a religion
12/ Risk Parity
So we have a Portoflio that sizes down a 60/15/15/10 portfolio based on 2 trend speeds. That portfolio is good and you could stop there, but there’s more easy gains to be had via risk parity.
Risk parity is just the idea that every asset must have equal….
So we have a Portoflio that sizes down a 60/15/15/10 portfolio based on 2 trend speeds. That portfolio is good and you could stop there, but there’s more easy gains to be had via risk parity.
Risk parity is just the idea that every asset must have equal….
13/…….contribution to the portfolios overall risk. The most popular way to measure risk is via volatility. I like it.
So instead of the random 60/15/15/10 weighting— you could weight each asset *inverse* to their volatility. The implicit assumption is that all of them have….
So instead of the random 60/15/15/10 weighting— you could weight each asset *inverse* to their volatility. The implicit assumption is that all of them have….
14/…..the same expected returns. If you don’t like them— you can always plug your personal preference of expected return.
So asset weight = expected/vol relative to rest of universe
For this strategy, we have chosen to just assume they all have the same expected returns…..
So asset weight = expected/vol relative to rest of universe
For this strategy, we have chosen to just assume they all have the same expected returns…..
15/ This makes sure all asset are equally represented in the portfolio. We can add our binary trend signal to this risk parity weighting.
1. If binary trend say all clear— full risk parity allocation
2. If mixed trend— half risk parity allocation
3. If both trends negative— 0%
1. If binary trend say all clear— full risk parity allocation
2. If mixed trend— half risk parity allocation
3. If both trends negative— 0%
16/ Vol Target/Dynamic Leverage
Now we have a package of assets that has a an expected volatility conditional upon its holdings. But we’d like this profile to be less “random”. After all, we want to take risk when it’s warranted.
Now we have a package of assets that has a an expected volatility conditional upon its holdings. But we’d like this profile to be less “random”. After all, we want to take risk when it’s warranted.
17/ When is it warranted to take more risk?
We want to take more risk when 1) the portoflio is diversified and 2) when we have a good amount of confidence
We can achieve both by scaling our volatility. We start by picking out maximum volatility— that is the risk level….
We want to take more risk when 1) the portoflio is diversified and 2) when we have a good amount of confidence
We can achieve both by scaling our volatility. We start by picking out maximum volatility— that is the risk level….
18/……we are unwilling to go beyond. In this case, we picked 15%.
Why?
It’s generally the mid point between most assets long-term vol. But you can pick any number.
So we’d like 15% when 2 conditions are met— the portoflio is well diversified, and we have conviction….
Why?
It’s generally the mid point between most assets long-term vol. But you can pick any number.
So we’d like 15% when 2 conditions are met— the portoflio is well diversified, and we have conviction….
19/ Fortunately, this can be elegantly solved by our binary trend signals. Since our trend signals direct translate into positions, which in turn feed breadth— we can scale our target volatility by the number of positive trend signals we get.
20/ Since we have 8 trend signals (2 per asset), we have 8 different levels of volatility we can apply.
- When all 8 signals are positive, 15% vol
- When 4 signals are positive, 7.5% vol
- When 0 signals are positive, 0% vol
And everything in between…..
- When all 8 signals are positive, 15% vol
- When 4 signals are positive, 7.5% vol
- When 0 signals are positive, 0% vol
And everything in between…..
21/ This gives us a nice profile where we take the most risk when we have the post diversifying in the portfolio, and less as it decreases.
You can ofc set the max risk as high or low as you like. But the principle stands— more diversification = more sharpe = more risk friendly
You can ofc set the max risk as high or low as you like. But the principle stands— more diversification = more sharpe = more risk friendly
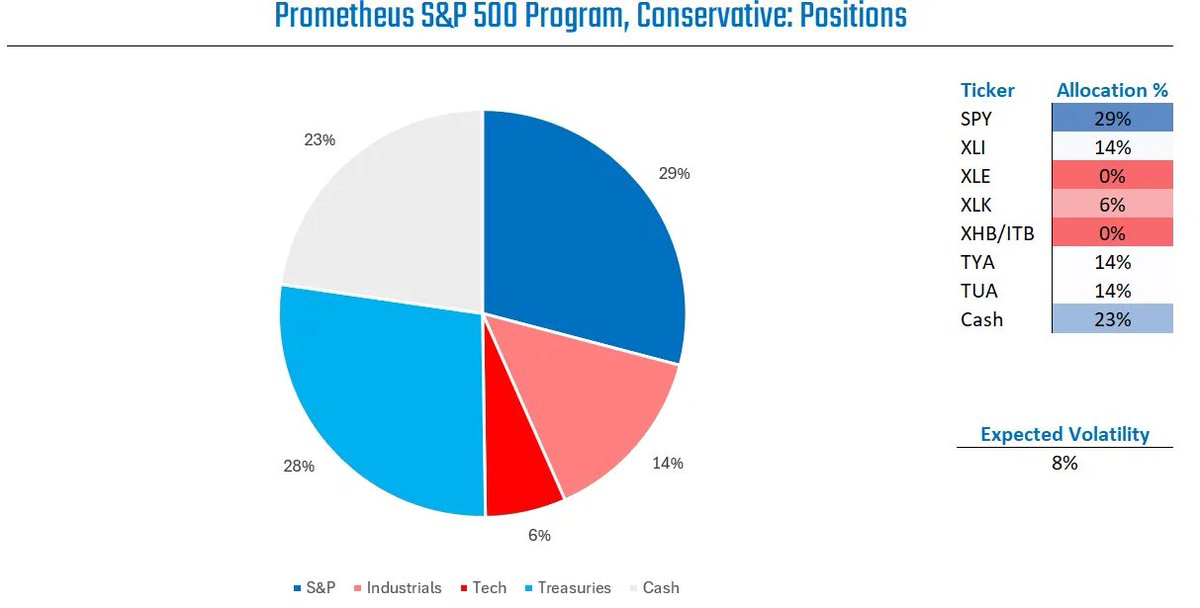
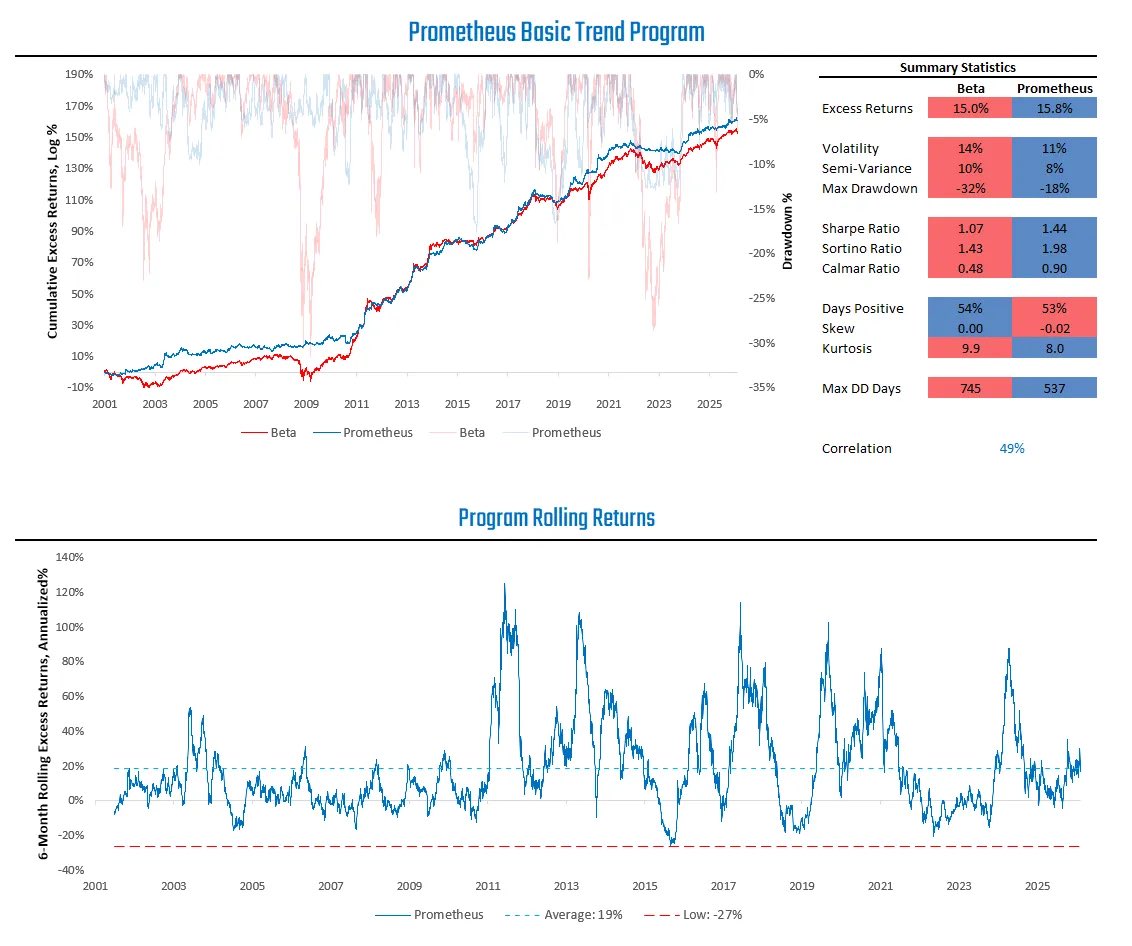
22/ After we’ve added all these layers, we get our Basic Trend Program.
It performs pretty well.
Outpaces beta
And cuts the drawdowns quite a bit
All for relatively simple things
It performs pretty well.
Outpaces beta
And cuts the drawdowns quite a bit
All for relatively simple things
23/ If you like this approach, you can now follow it for free on Prometheus.
If you don’t want to follow Prometheus, you can just use it as a template to make your own trend model.
Thanks for reading
If you don’t want to follow Prometheus, you can just use it as a template to make your own trend model.
Thanks for reading
• • •
Missing some Tweet in this thread? You can try to
force a refresh