🧵What does paleoclimatology tell us about Earth's present climate?
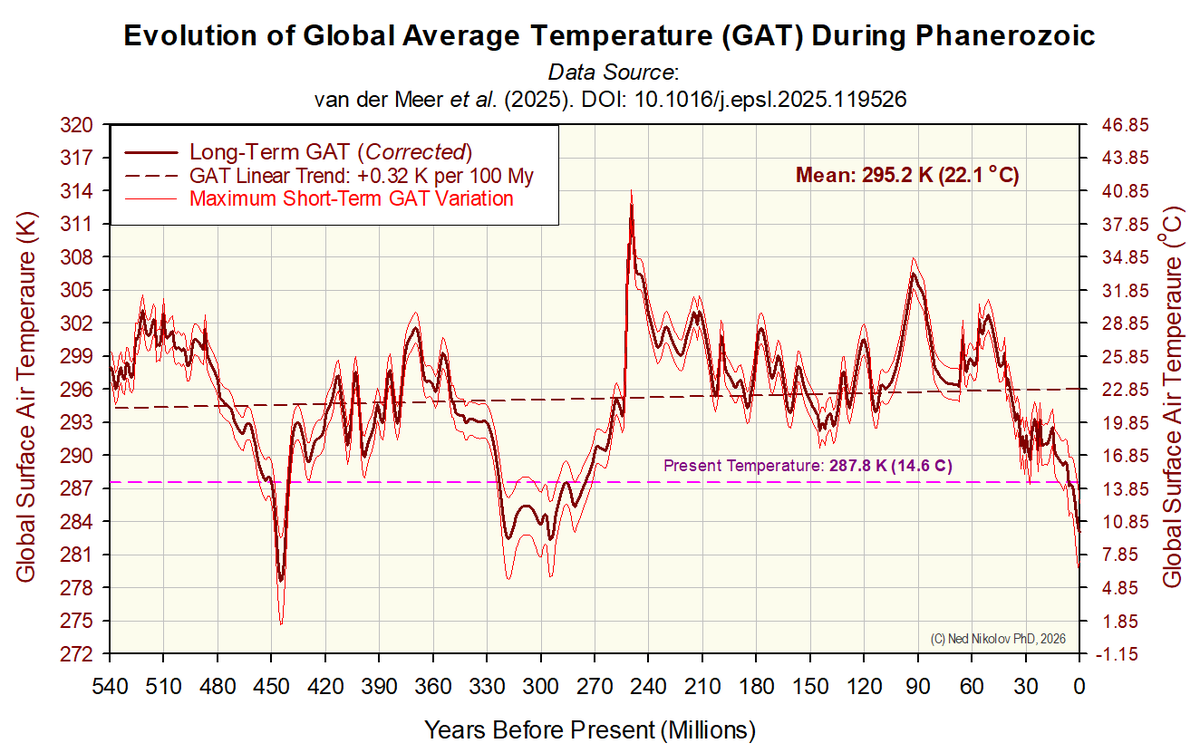
1. We live in one of 3 brief ice-age periods that have occurred since higher life forms appeared on this planet some 540 My ago. Despite large climatic variations during the Phanerozoic, the overall trend of global temperature in this Eon has been close to zero, and the Earth is currently 7.5 °C cooler than the long-term Phanerozoic average of 22.1 °C as shown on the attached graph.
Our present cold period marked by permanent Polar icecaps and mountain glaciers called the Pleistocene-Holocene Ice Age, which began 2.6 My ago, is climatologically similar to only two other periods in the last 540 My: the Hirnantian glaciation of the Late Ordovician some 445 My ago, and the Pennsylvanian glaciation of the Late Carboniferous about 320 My ago... Thus, from a geological standpoint, we inhabit an unusual "cold snap" in time.
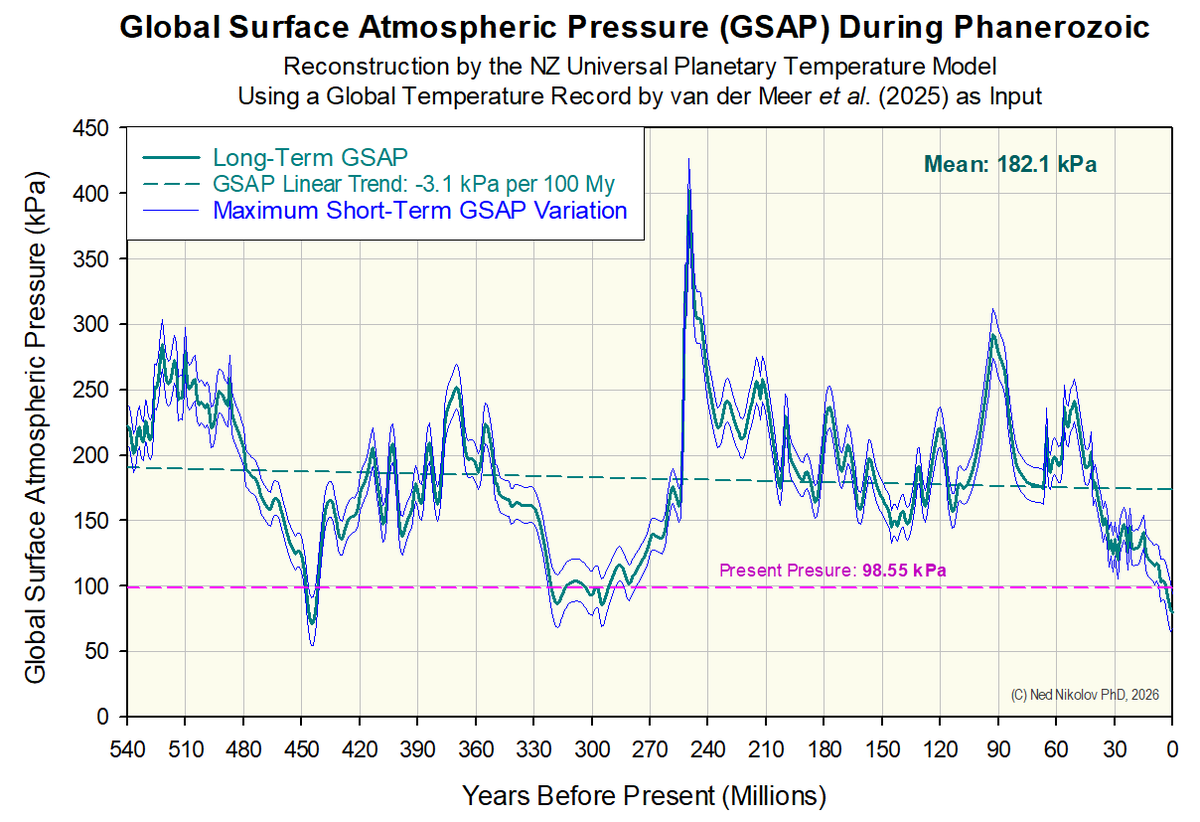
2. We live in an unusually decompressed atmospheric environment. Our present mean surface air pressure (98.55 kPa) is 46% lower than the average atmospheric pressure of 182.1 kPa estimated for the Phanerozoic Eon, i.e. the last 540 My.
The attached graph shows the reconstructed dynamics of total surface atmospheric pressure produced by the NZ Universal Planetary Temperature Model using the above global temperature record as input.
There are two main reasons for concluding that changes in atmospheric mass and total pressure were the driver of Earth's paleoclimate:
a) Our analysis of NASA planetary data showed that the long-term (baseline) global surface temperature of a rocky planet only depends on two factors: the planet's orbital distance from the Sun (diabatic forcing) and the mean atmospheric pressure at the surface (adiabatic forcing). Since current orbital models indicate no significant change in the mean annual Earth-Sun distance for 100s of millions of years, the adiabatic forcing delivered by air pressure remains as the sole possible driver;
b) The extended NZ Model, which accurately describes baseline surface temperatures at several key latitudes on any rocky planet as a function of incoming solar radiation and total air pressure, can correctly predict the Polar Amplifications observed in the geological record of Earth only by assuming a variable pressure through time. Polar Amplification refers to the fact that, in the deep past, polar temperatures have always varied more (wider) than equatorial temperatures. In other words, warmer periods have always had smaller meridional (equator-to-pole) temperature gradients than colder periods. The observed Polar Amplifications cannot be reproduced at all by assuming a variable TSI (Total Solar Irradiance)! Hence, solar luminosity was not the driver of Earth's large paleoclimatic fluctuations.
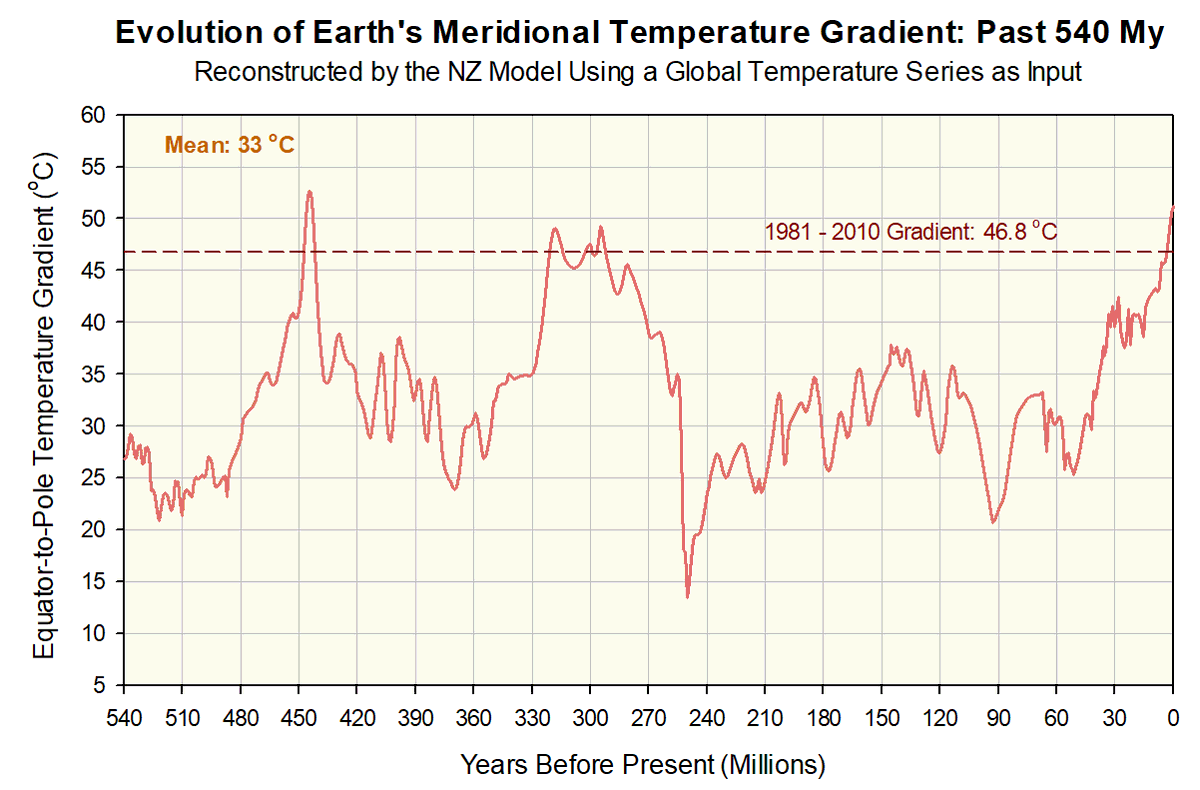
3. We live in one of the least equable climates during the Phanerozoic Eon (past 540 My). Equable climates are characterized by small latitudinal temperature gradients and more uniform climate conditions throughout the Globe. The attached graph shows a reconstructed dynamics of the Meridional (equator-to-pole) Temperature Gradient (MTG) produced by the NZ Model upon assuming a variable atmospheric pressure through time.
Periods of smaller (less steep) MTGs are associated with higher atmospheric pressures and warmer global climates. Smaller MTGs also imply warmer Poles and the occurrence of fewer, less severe storms such as hurricanes and tornadoes throughout the Globe.
The Earth's present MTG (46.8 °C) is much larger than the estimated mean MTG during the Phanerozoic Eon (33 °C).
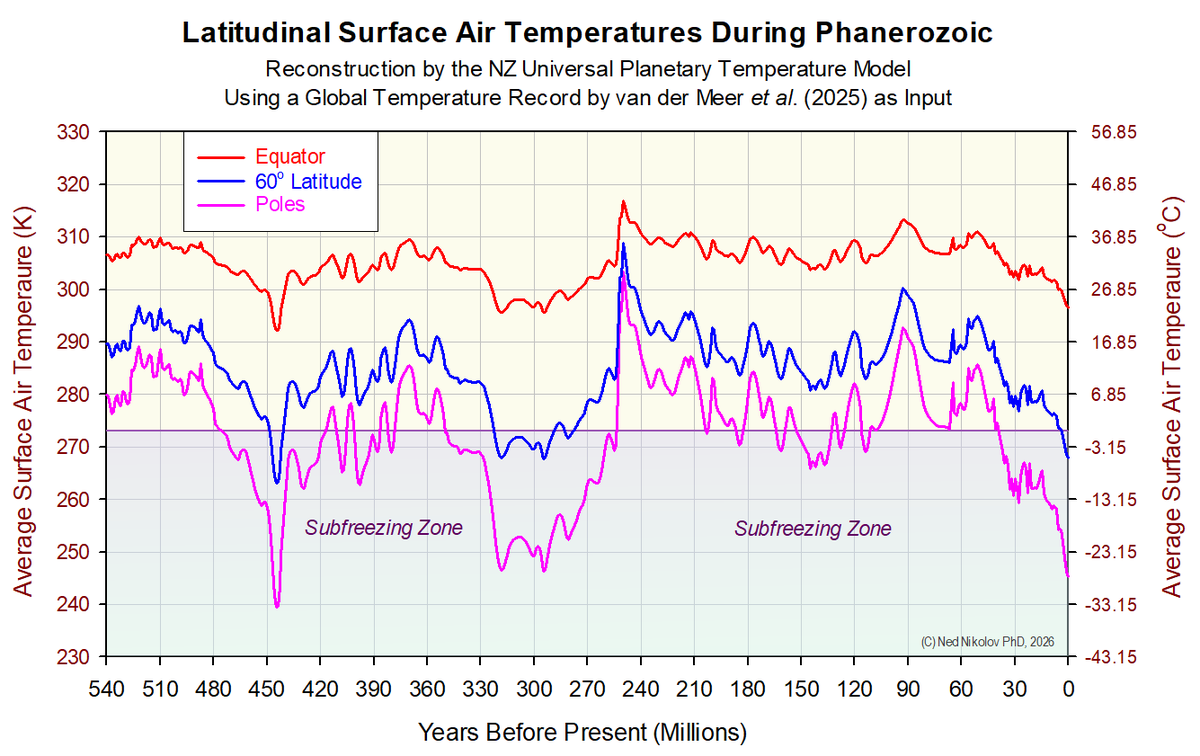
4. We currently live on a planet with permanent Polar Icecaps, where the mean annual temperature at sea level is about -20 °C. However, this was not the case in the past!
Our analysis showed that, throughout the last 540 My, the annual Polar temperatures were above freezing (0.1 °C) during 52.3% of the time, meaning that the Poles were ice-free during most of the Phanerozoic Eon. The attached graph illustrates the reconstructed dynamics of mean annual temperatures at the Equator, the Poles, and 60° latitude.
These estimates are corroborated by the available geological evidence.
Conclusion:
Earth is currently going through an exceptionally cold period (on a geological time scale) due to weak adiabatic heating caused by a low atmospheric mass and low surface air pressure.
The current global climate is not at all typical of the conditions, which have favored the evolution of higher life forms on this Planet. Hence, we should not be afraid of "global warming", because warmth mostly nurtures growth and biodiversity, while cold suppresses them!
• • •
Missing some Tweet in this thread? You can try to
force a refresh