Ned Nikolov, Ph.D. Profile picture
Ph.D. Physical Scientist with a broad range of interests in various fields of science, i.e. climate, cosmology, astrophysics, nutrition, archaeology etc.
Feb 9 5 tweets 4 min read
🧵What does paleoclimatology tell us about Earth's present climate?

1. We live in one of 3 brief ice-age periods that have occurred since higher life forms appeared on this planet some 540 My ago. Despite large climatic variations during the Phanerozoic, the overall trend of global temperature in this Eon has been close to zero, and the Earth is currently 7.5 °C cooler than the long-term Phanerozoic average of 22.1 °C as shown on the attached graph.

Our present cold period marked by permanent Polar icecaps and mountain glaciers called the Pleistocene-Holocene Ice Age, which began 2.6 My ago, is climatologically similar to only two other periods in the last 540 My: the Hirnantian glaciation of the Late Ordovician some 445 My ago, and the Pennsylvanian glaciation of the Late Carboniferous about 320 My ago... Thus, from a geological standpoint, we inhabit an unusual "cold snap" in time.Image 2. We live in an unusually decompressed atmospheric environment. Our present mean surface air pressure (98.55 kPa) is 46% lower than the average atmospheric pressure of 182.1 kPa estimated for the Phanerozoic Eon, i.e. the last 540 My.

The attached graph shows the reconstructed dynamics of total surface atmospheric pressure produced by the NZ Universal Planetary Temperature Model using the above global temperature record as input.

There are two main reasons for concluding that changes in atmospheric mass and total pressure were the driver of Earth's paleoclimate:

a) Our analysis of NASA planetary data showed that the long-term (baseline) global surface temperature of a rocky planet only depends on two factors: the planet's orbital distance from the Sun (diabatic forcing) and the mean atmospheric pressure at the surface (adiabatic forcing). Since current orbital models indicate no significant change in the mean annual Earth-Sun distance for 100s of millions of years, the adiabatic forcing delivered by air pressure remains as the sole possible driver;

b) The extended NZ Model, which accurately describes baseline surface temperatures at several key latitudes on any rocky planet as a function of incoming solar radiation and total air pressure, can correctly predict the Polar Amplifications observed in the geological record of Earth only by assuming a variable pressure through time. Polar Amplification refers to the fact that, in the deep past, polar temperatures have always varied more (wider) than equatorial temperatures. In other words, warmer periods have always had smaller meridional (equator-to-pole) temperature gradients than colder periods. The observed Polar Amplifications cannot be reproduced at all by assuming a variable TSI (Total Solar Irradiance)! Hence, solar luminosity was not the driver of Earth's large paleoclimatic fluctuations.Image
Mar 9, 2025 4 tweets 2 min read
Earth's albedo has decreased by about 1% since early 1980s. This is the real driver of the Global Warming for the past 45 years, not CO2!

The proof is in the fact that our model relating global temperature to albedo variations published last year (see Eq. 16 in: mdpi.com/2673-7418/4/3/…) accurately reproduced the decline of Earth's albedo measured by the NASA CERES Project since 2000:Image 
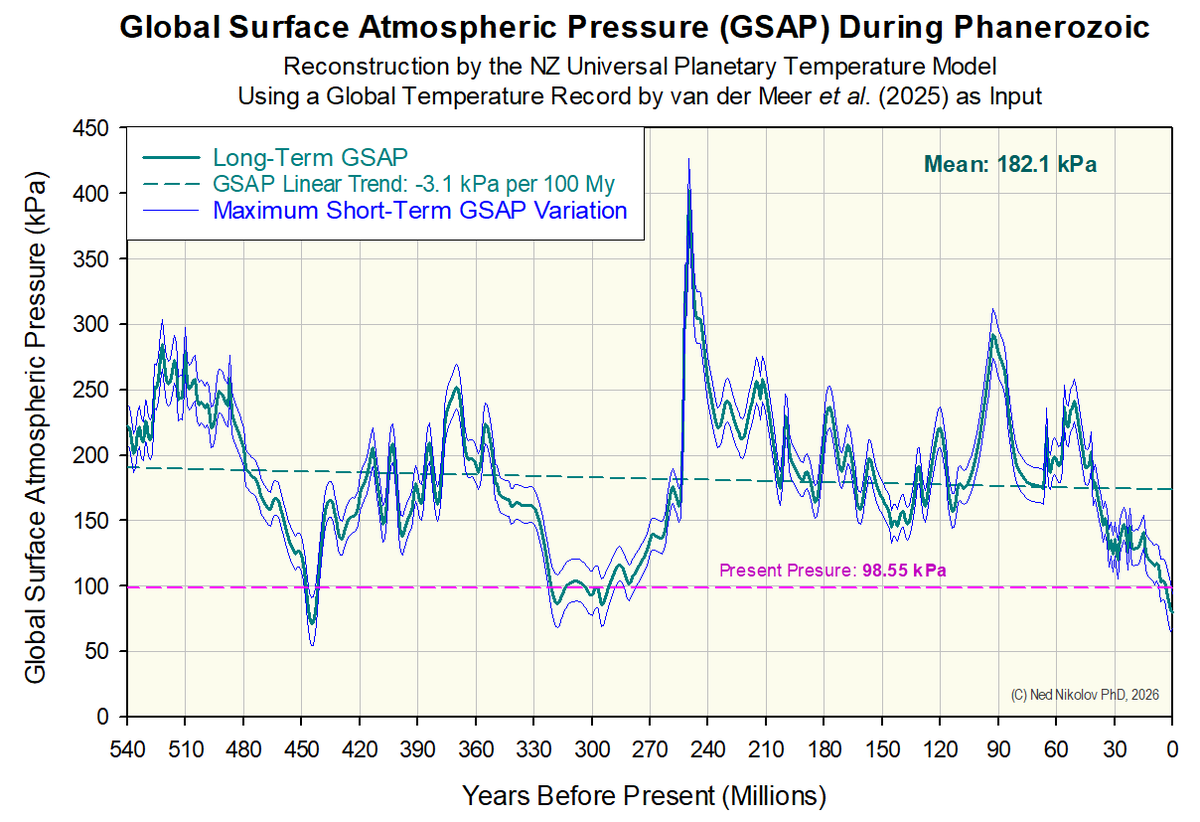
The observed albedo drop since 2000 is NOT a feedback to an initial CO2 warming as claimed by the IPCC because:

1. The global temperature follows changes of albedo with a lag of 5-6 months;
2. The albedo decrease since 2000 explains 100% of the observed warming leaving no room for any GHG "radiative forcing";
3. The CERES data do not indicate the presence of any positive (amplifying) feedbacks.Image
Jun 21, 2024 9 tweets 5 min read
While working on a paper using CERES satellite data, I discovered that the latest IPCC Report grossly misrepresented CERES observations of reflected solar and outgoing LW radiation.
In Chapter 7 of WG1 Contribution, Fig. 7.3 shows INVERTED trends of reflected solar & LW fluxes!
Image
Image
Here is a screenshot of the entire Fig. 7.3 on p. 936 of the WG1 Contribution to the IPCC AR6: ipcc.ch/report/ar6/wg1/
Image
Apr 16, 2024 8 tweets 3 min read
🚨BREAKING: New published study by an international team of researchers confirms what some medical experts have been suspecting for 18 months:
The COVID mRNA shots containing N1-methyl-pseudouridine SUPPRESS the immune system and STIMULATE cancer growth!
sciencedirect.com/science/articl…
Image This finding explains the alarming rise of CANCER cases and cancer-caused deaths among young people (15 - 45 yo) observed since 2021... Princess Catherine is likely one of these vaccine-induced cancer victims:
washingtontimes.com/news/2024/mar/…
Mar 27, 2024 4 tweets 2 min read
This is a final result from our analysis of CERES satellite data:
Using observed changes in Total Solar Irradiance (TSI) and Earth's albedo by CERES, an independent model derived from NASA planetary data & rules of calculus accurately predicted the WARMING of the past 24 years. Image 
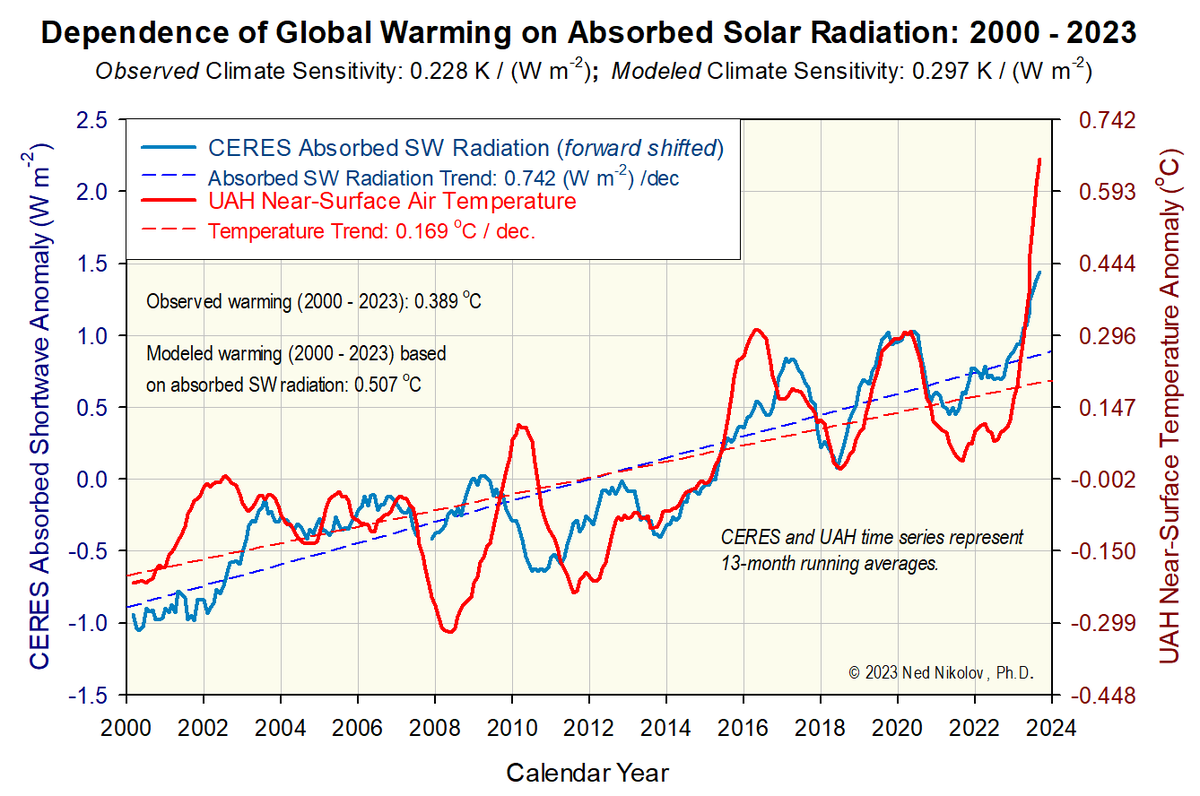
The implication of the above results is that CERES data show NO effect of rising atmos. CO2 on global temperature since year 2000!
The entire warming is due to an increased absorption of sunlight by the Planet resulting from a decrease of cloud albedo. Hence, it's all natural!
Mar 25, 2024 5 tweets 3 min read
In a recent Nature article, Gavin Schmidt (Director of NASA GISS) stated that "the 2023 temperature anomaly has come out of the blue", and could not be explained by any known climate forcing:


However, CERES satellite data provide a full explanation: nature.com/articles/d4158…
Image The CERES observations clearly show that changes in absorbed sunlight by Earth due to variations in cloud albedo fully account for the reported global surface-temp. changes.
The 2023 heat spike was caused by a sharp increase in absorbed solar radiation supported by a rise in TSI. Image
Dec 11, 2023 5 tweets 3 min read
CERES satellite observations of solar fluxes at the top of the atmosphere continuously made since year 2000 reveal that the warming observed for past 23 years by both satellite sensors and surface thermometers has been the result of decreasing cloud albedo, not increasing CO2!
Image
Image
These vetted data from official, reputable sources suggest that humanity has been wasting time & money to fight a phenomenon, i.e. the ANTHROPOGENIC Global Warming (AGW), which does NOT exit!
The observed warming is a NATURAL phenomenon NOT related to any human carbon emissions!
Image
Image
Nov 14, 2023 4 tweets 1 min read
Could the core of a healthy & disease-curing diet be as simple as this: MEAT, SALT and WATER?

Some call it the "lion diet" and report enormous health benefits:

Share your thoughts...doctorkiltz.com/lion-diet/ I started experimenting with an eating regimen very close to the "lion diet" 5 weeks ago. I felt a noticeable positive impact on the heart: my rest heart rate is now around 60 beats per min. (about 52 when I wake up). I feel unusual heart strength, chest calmness & happiness.