1/13
Long overdue annual update on Midstream returns on capital deployed.
Period covered: 2018 to 2025
Companies Covered: $KMI, $OKE, $LNG, $WMB, $TRGP, $EPD, $ET, $MPLX, $PAA
Last year's Analysis/Thread below for reference:
Long overdue annual update on Midstream returns on capital deployed.
Period covered: 2018 to 2025
Companies Covered: $KMI, $OKE, $LNG, $WMB, $TRGP, $EPD, $ET, $MPLX, $PAA
Last year's Analysis/Thread below for reference:
https://x.com/Suicide95518428/status/1856094278809788684?s=20
2/13
Methodology:
a) Compute ∆ EBITDA b/w Q3'25 & Q3'18
b) Annualize change in (a) = cumulative EBITDA growth
c) Calculate Total Capital Deployed b/w 2018 and 2024 = CAPEX + Acquisitions (incl. stock-for-stock) - Divestitures
Return = ∆ Annualized EBITDA ÷ Capital Deployed
Methodology:
a) Compute ∆ EBITDA b/w Q3'25 & Q3'18
b) Annualize change in (a) = cumulative EBITDA growth
c) Calculate Total Capital Deployed b/w 2018 and 2024 = CAPEX + Acquisitions (incl. stock-for-stock) - Divestitures
Return = ∆ Annualized EBITDA ÷ Capital Deployed
3/13
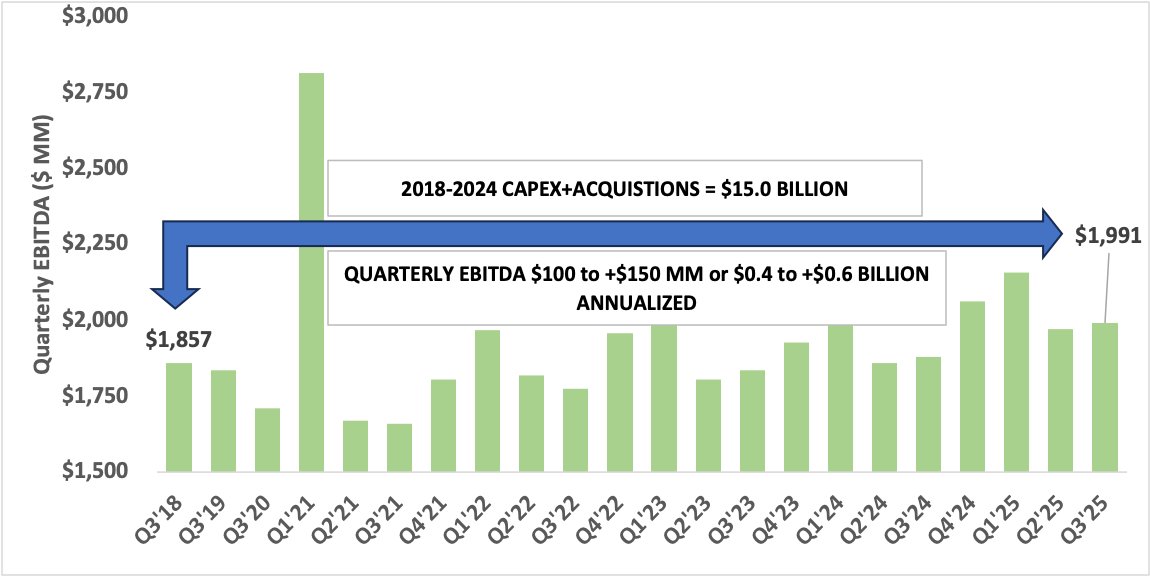
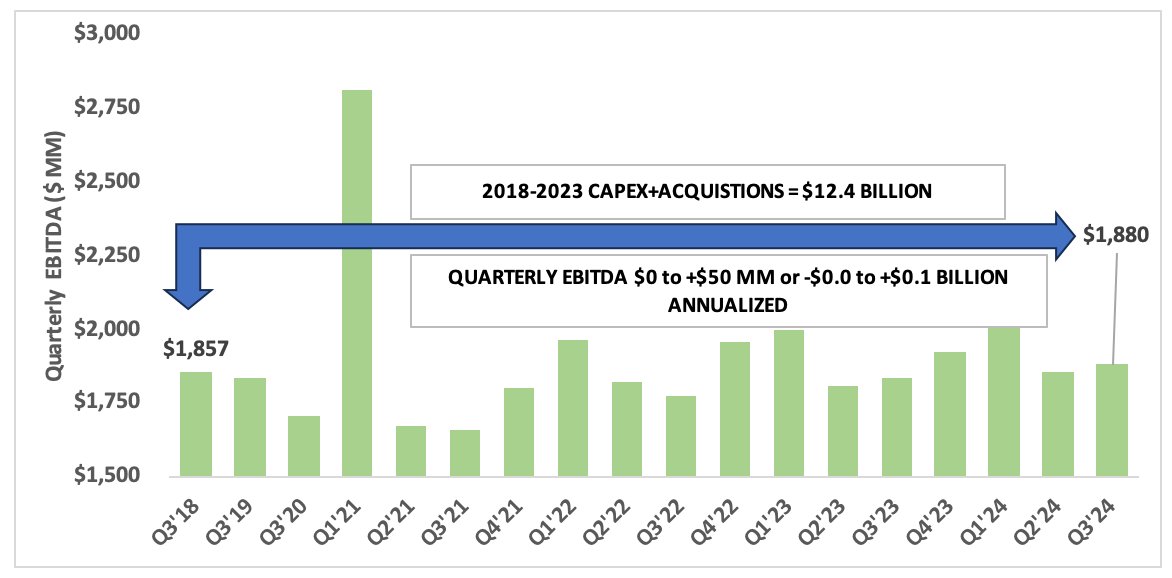
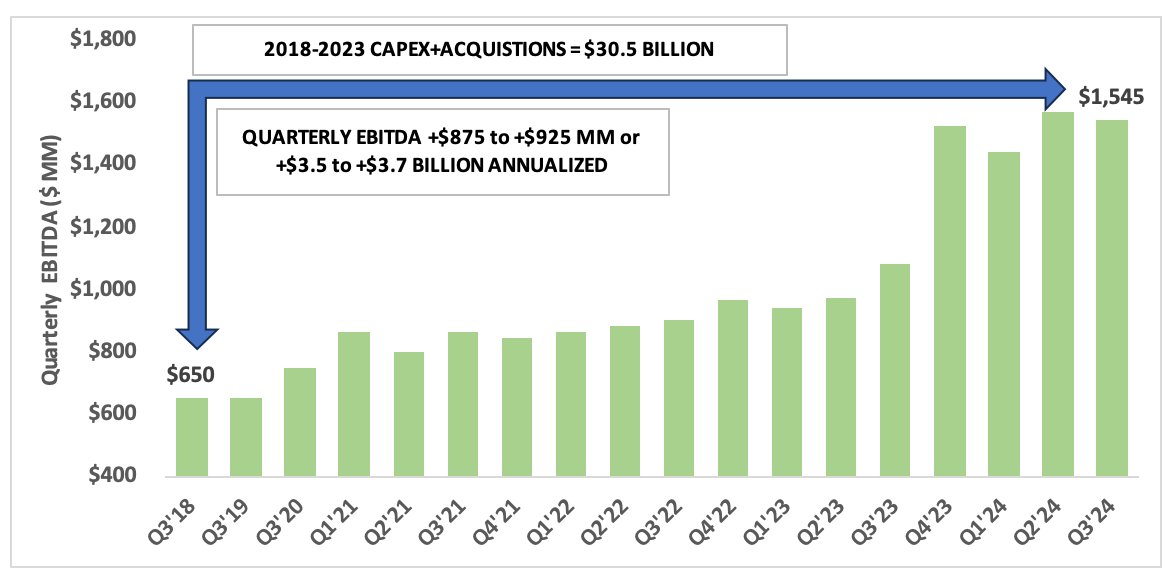
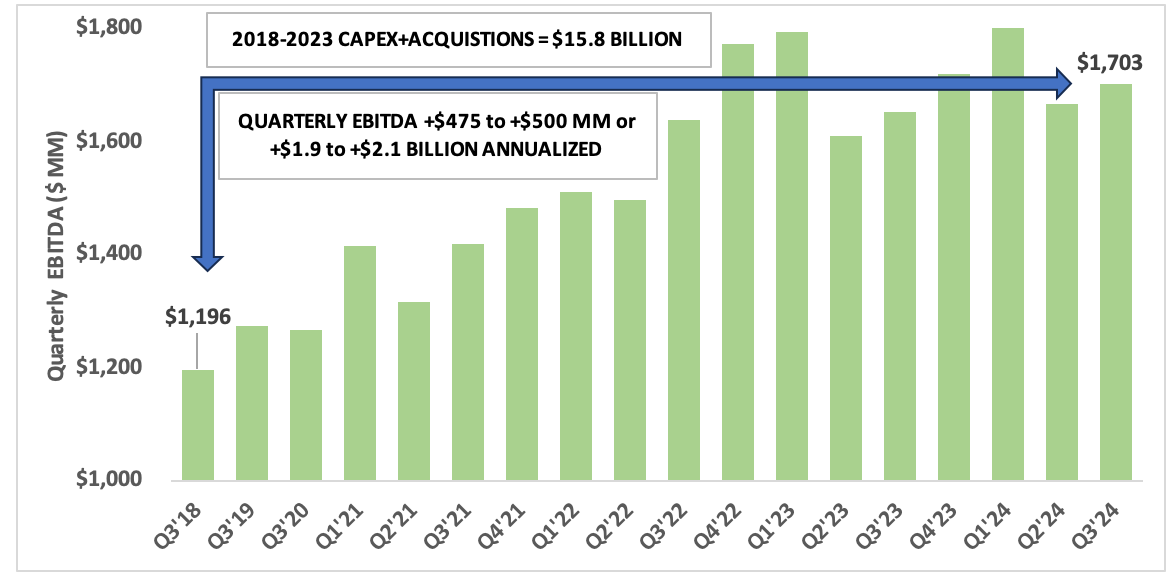
Starting with $KMI, between 2018 and 2024:
Capital Deployed = $15 billion
∆ EBITDA = $400 $600 million
Return = 2.7% to 4.0%
Return for the 2018 to 2023 period = 0% to 1.6%
Improving trajectory for sure...let's see if this can continue
Starting with $KMI, between 2018 and 2024:
Capital Deployed = $15 billion
∆ EBITDA = $400 $600 million
Return = 2.7% to 4.0%
Return for the 2018 to 2023 period = 0% to 1.6%
Improving trajectory for sure...let's see if this can continue
4/13
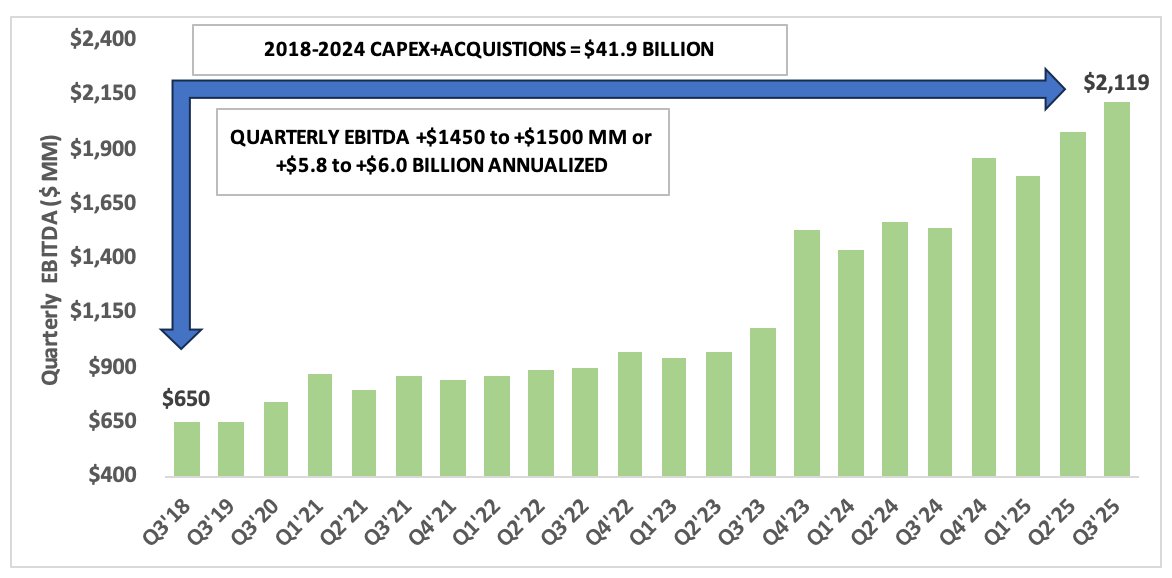
Looking at $OKE next, b/w 2018 & 2024:
Capital Deployed = $41.9 billion (includes $ENLC purchase which closed in Q1'25)
∆ EBITDA = $5.8 to $6.0 billion
Return = 13.8% to 14.3%
Return during 2018-2023 = 11.5% to 12.1%
Looks like $MMP synergies are coming through
Looking at $OKE next, b/w 2018 & 2024:
Capital Deployed = $41.9 billion (includes $ENLC purchase which closed in Q1'25)
∆ EBITDA = $5.8 to $6.0 billion
Return = 13.8% to 14.3%
Return during 2018-2023 = 11.5% to 12.1%
Looks like $MMP synergies are coming through
5/13
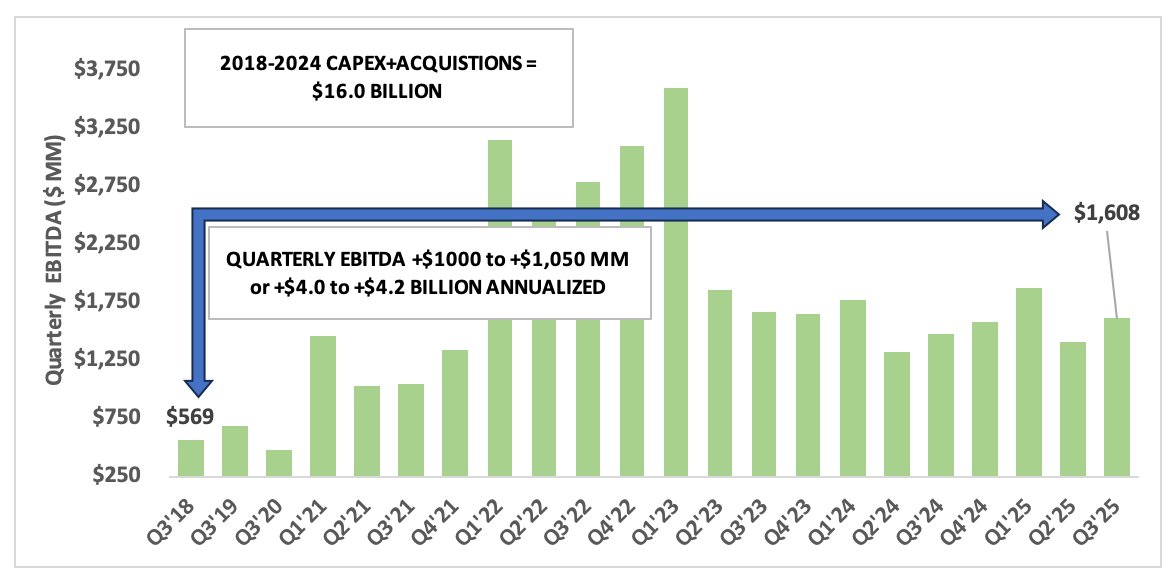
Next up $LNG. Between 2018 and 2024:
Capital Deployed = $16 billion
∆ EBITDA = $4.0 to $4.2 billion
Return = 25.0% to 26.3%
Return during 2018-2023 = 26.2% to 29.2%
Continued weakening of TTF & JKL pricing has reduced marketing margins
Next up $LNG. Between 2018 and 2024:
Capital Deployed = $16 billion
∆ EBITDA = $4.0 to $4.2 billion
Return = 25.0% to 26.3%
Return during 2018-2023 = 26.2% to 29.2%
Continued weakening of TTF & JKL pricing has reduced marketing margins
6/13
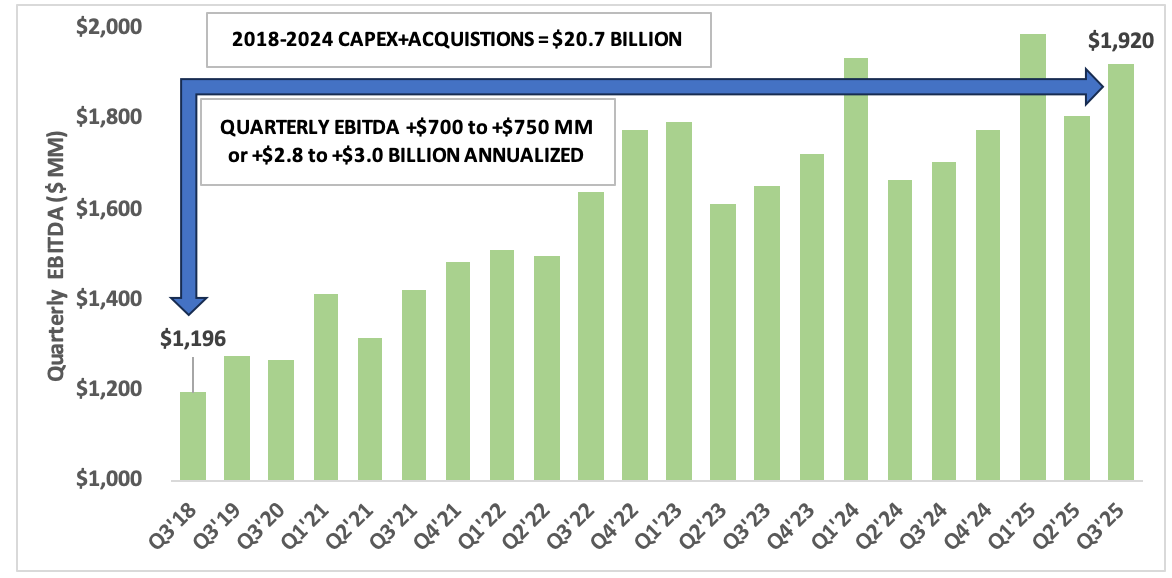
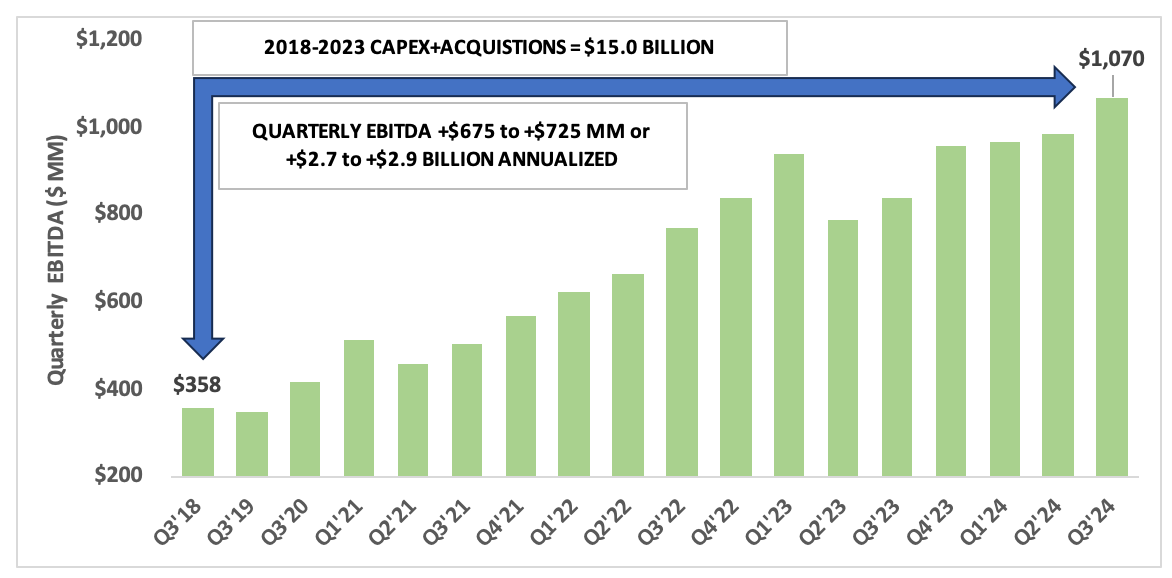
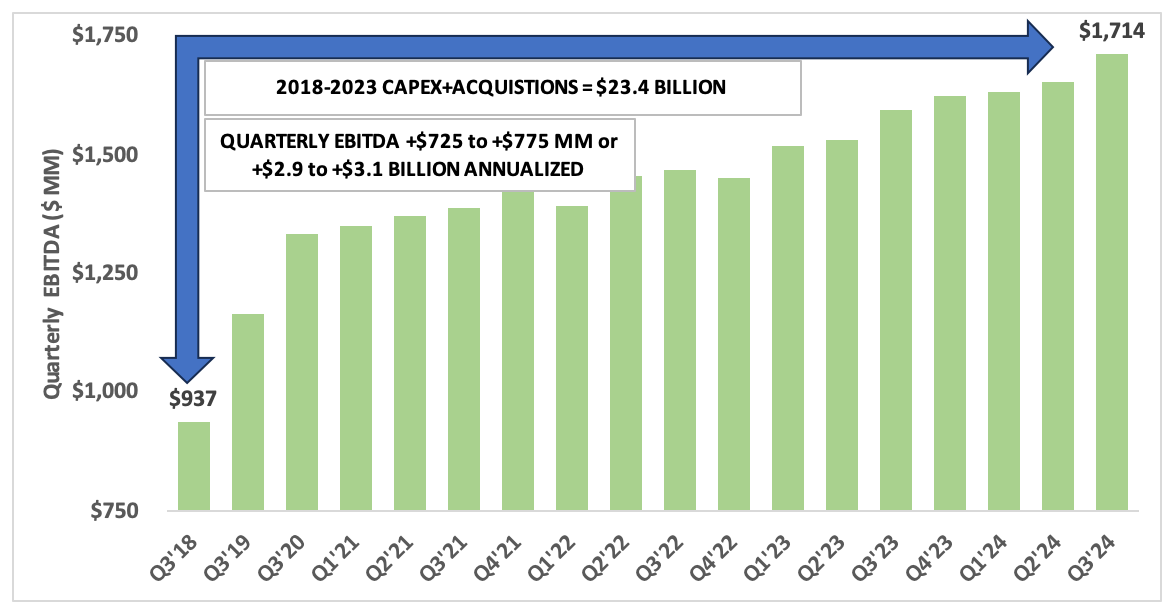
Let's check $WMB next. Between 2018 & 2024:
Capital Deployed = $20.7 billion
∆ EBITDA = $2.8 to $3.0 billion
Return = 13.5% to 14.5%
Return during 2018-2023 = 12.0% to 13.3%
Nice comeback in returns - driven by projects coming online especially Deepwater GoM
Let's check $WMB next. Between 2018 & 2024:
Capital Deployed = $20.7 billion
∆ EBITDA = $2.8 to $3.0 billion
Return = 13.5% to 14.5%
Return during 2018-2023 = 12.0% to 13.3%
Nice comeback in returns - driven by projects coming online especially Deepwater GoM
7/13
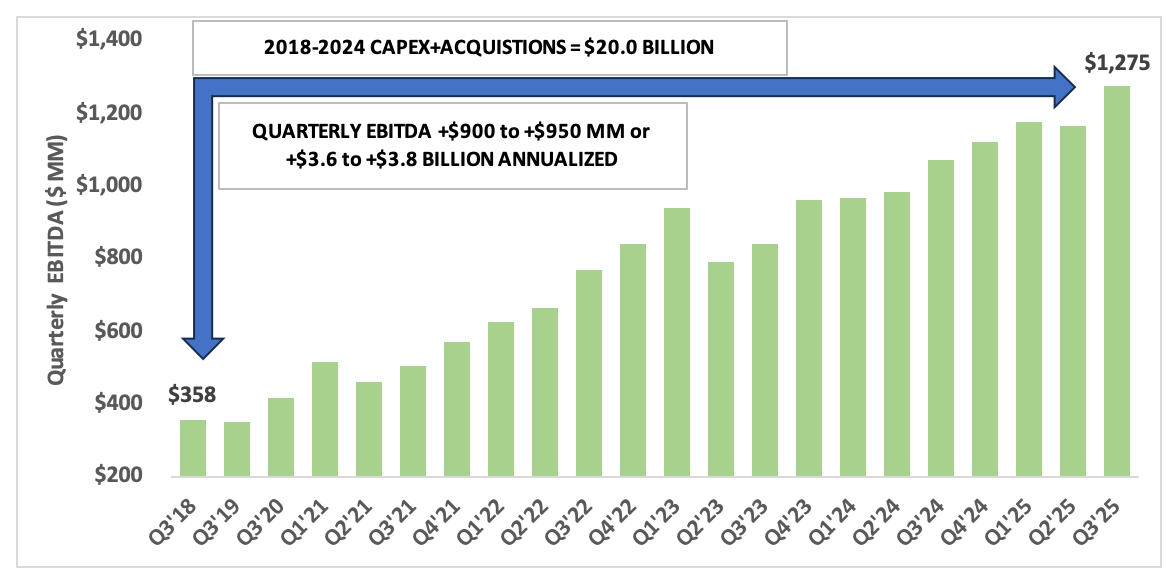
Let's finish the C-corps with $TRGP. Between 2018 & 2024:
Capital Deployed = $20 billion (incl. purchase of Badlands stake from Blackstone)
∆ EBITDA = $3.6 to $3.8 billion
Return = 18.0% to 19.0%
Return during 2018-2023 = 18.0% to 19.3%
Maintaining strong returns
Let's finish the C-corps with $TRGP. Between 2018 & 2024:
Capital Deployed = $20 billion (incl. purchase of Badlands stake from Blackstone)
∆ EBITDA = $3.6 to $3.8 billion
Return = 18.0% to 19.0%
Return during 2018-2023 = 18.0% to 19.3%
Maintaining strong returns
8/13
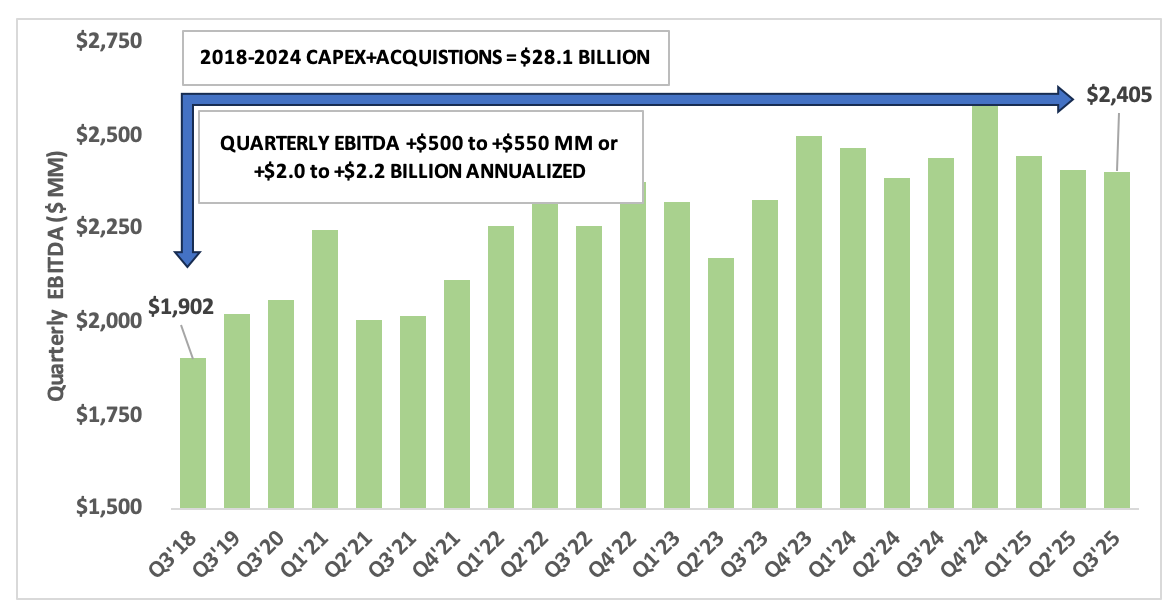
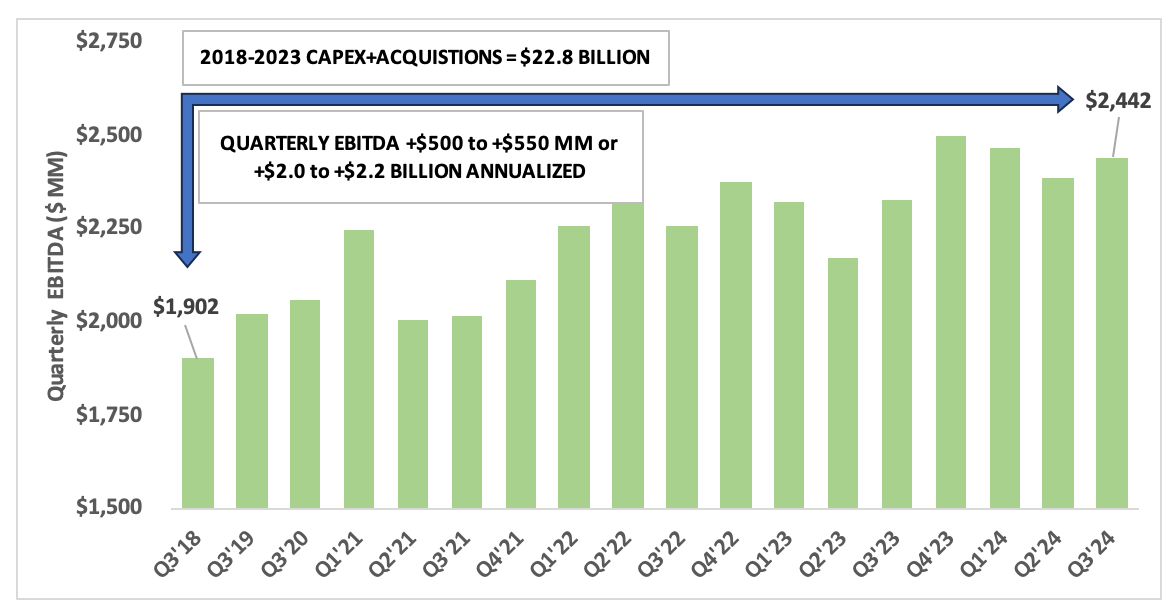
Turning to MLPs, first up $EPD. Between 2018 and 2024:
Capital Deployed = $28.1 billion
∆ EBITDA = $2.0 to $2.2 billion
Return = 7.1% to 7.8%
Return during 2018-2023 = 8.8% to 9.6%
All is not well in the base business - more competition in the Permian
Turning to MLPs, first up $EPD. Between 2018 and 2024:
Capital Deployed = $28.1 billion
∆ EBITDA = $2.0 to $2.2 billion
Return = 7.1% to 7.8%
Return during 2018-2023 = 8.8% to 9.6%
All is not well in the base business - more competition in the Permian
9/13
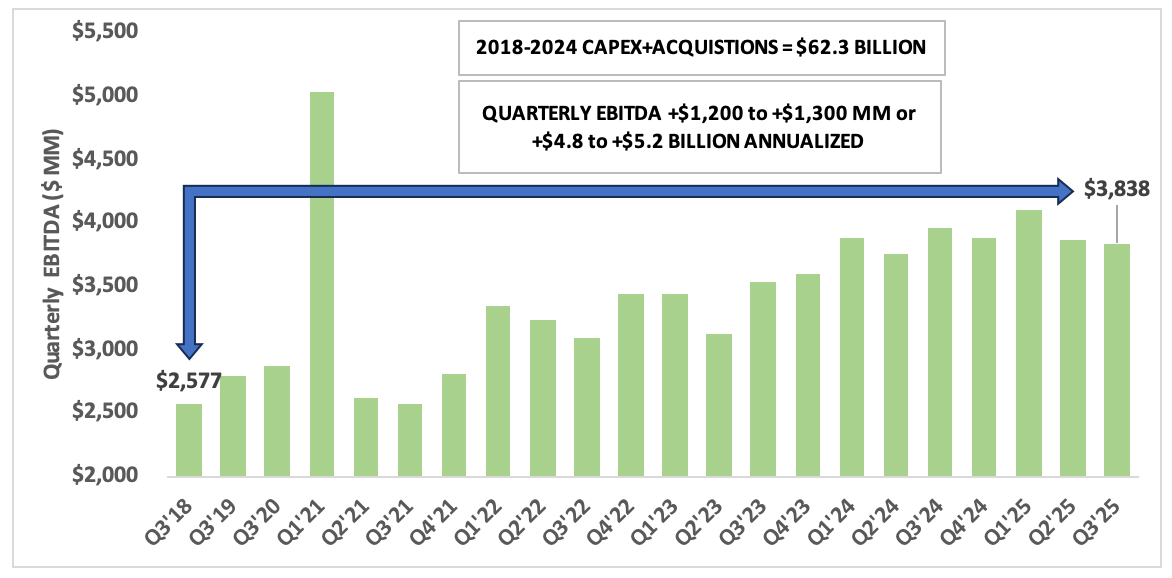
Now for $ET - the biggest of them all. Between 2018 & 2024:
Capital Deployed = $62.3 billion (incl. NuStar purchase by $SUN)
∆ EBITDA = $4.8 to $5.2 billion
Return = 7.7% to 8.3%
Return during 2018-2023 = 10.7% to 11.6%
Competition hurting base business esp. Permian
Now for $ET - the biggest of them all. Between 2018 & 2024:
Capital Deployed = $62.3 billion (incl. NuStar purchase by $SUN)
∆ EBITDA = $4.8 to $5.2 billion
Return = 7.7% to 8.3%
Return during 2018-2023 = 10.7% to 11.6%
Competition hurting base business esp. Permian
10/13
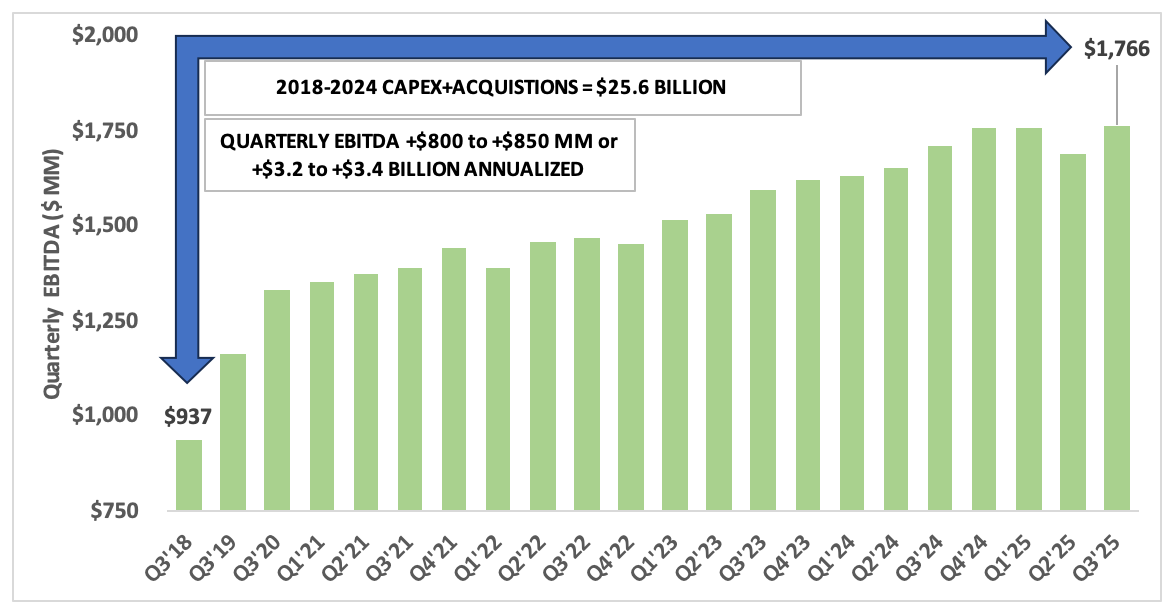
Next, let's look at $MPLX. Between 2018 & 2024:
Capital Deployed = $25.6 billion
∆ EBITDA = $3.2 to $3.4 billion
Return = 12.5% to 13.3%
Return during 2018-2023 = 12.4% to 13.2%
Returns holding steady but acquisitions jumped in 2025. So let's see...
Next, let's look at $MPLX. Between 2018 & 2024:
Capital Deployed = $25.6 billion
∆ EBITDA = $3.2 to $3.4 billion
Return = 12.5% to 13.3%
Return during 2018-2023 = 12.4% to 13.2%
Returns holding steady but acquisitions jumped in 2025. So let's see...
11/13
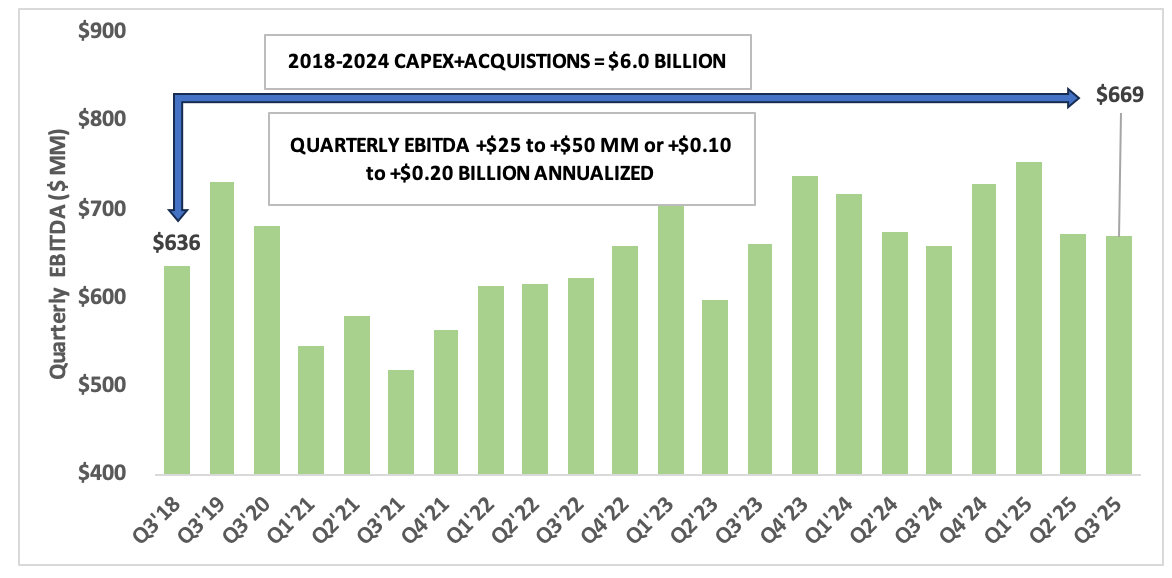
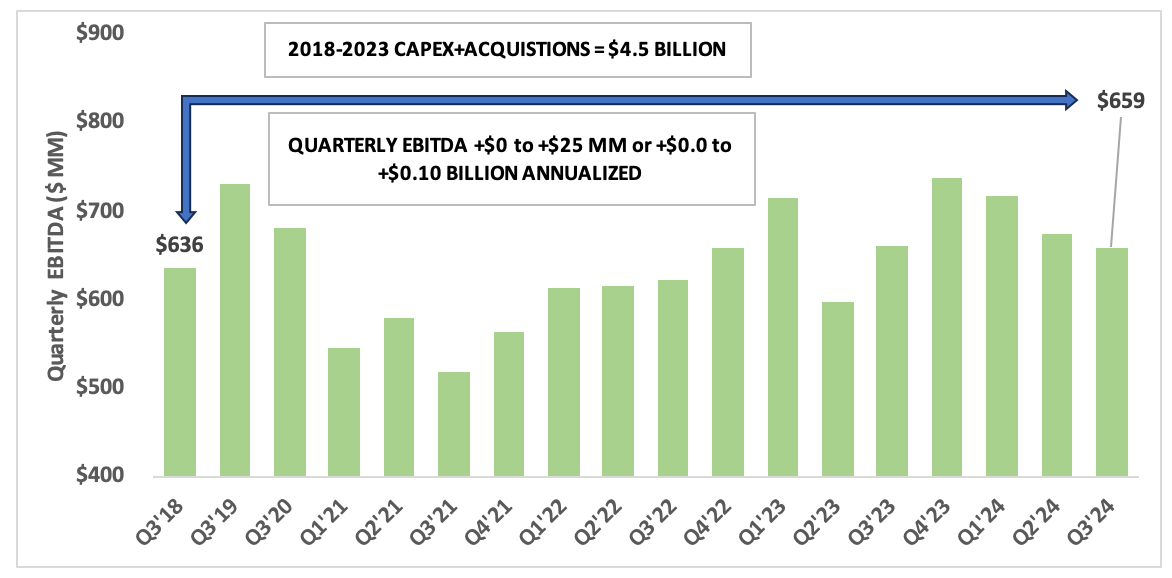
Finally, let's look at $PAA. Between 2018 & 2024:
Capital Deployed = $6 billion
∆ EBITDA = $100 mm to $200 mm
Return = 1.7% to 3.3%
Return during 2018-2023 = 0.0% to 2.2%
Slight improvement but a long way to go still...
Finally, let's look at $PAA. Between 2018 & 2024:
Capital Deployed = $6 billion
∆ EBITDA = $100 mm to $200 mm
Return = 1.7% to 3.3%
Return during 2018-2023 = 0.0% to 2.2%
Slight improvement but a long way to go still...
12/13
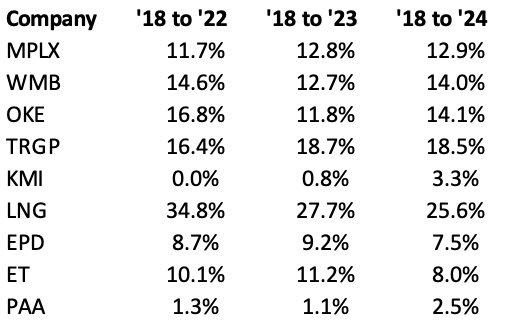
Evolution of returns shown in Table below.
Evolution of returns shown in Table below.
13/13
$TRGP and $LNG are tops
$WMB and $OKE - strong returns despite high M&A activity - indicates good synergy capture
$ET and $EPD - Disappointing drop in returns - perhaps undercutting each other
$MPLX - Solid but recent M&A bears watching
$KMI - Improving
$PAA - Weak
$TRGP and $LNG are tops
$WMB and $OKE - strong returns despite high M&A activity - indicates good synergy capture
$ET and $EPD - Disappointing drop in returns - perhaps undercutting each other
$MPLX - Solid but recent M&A bears watching
$KMI - Improving
$PAA - Weak
• • •
Missing some Tweet in this thread? You can try to
force a refresh