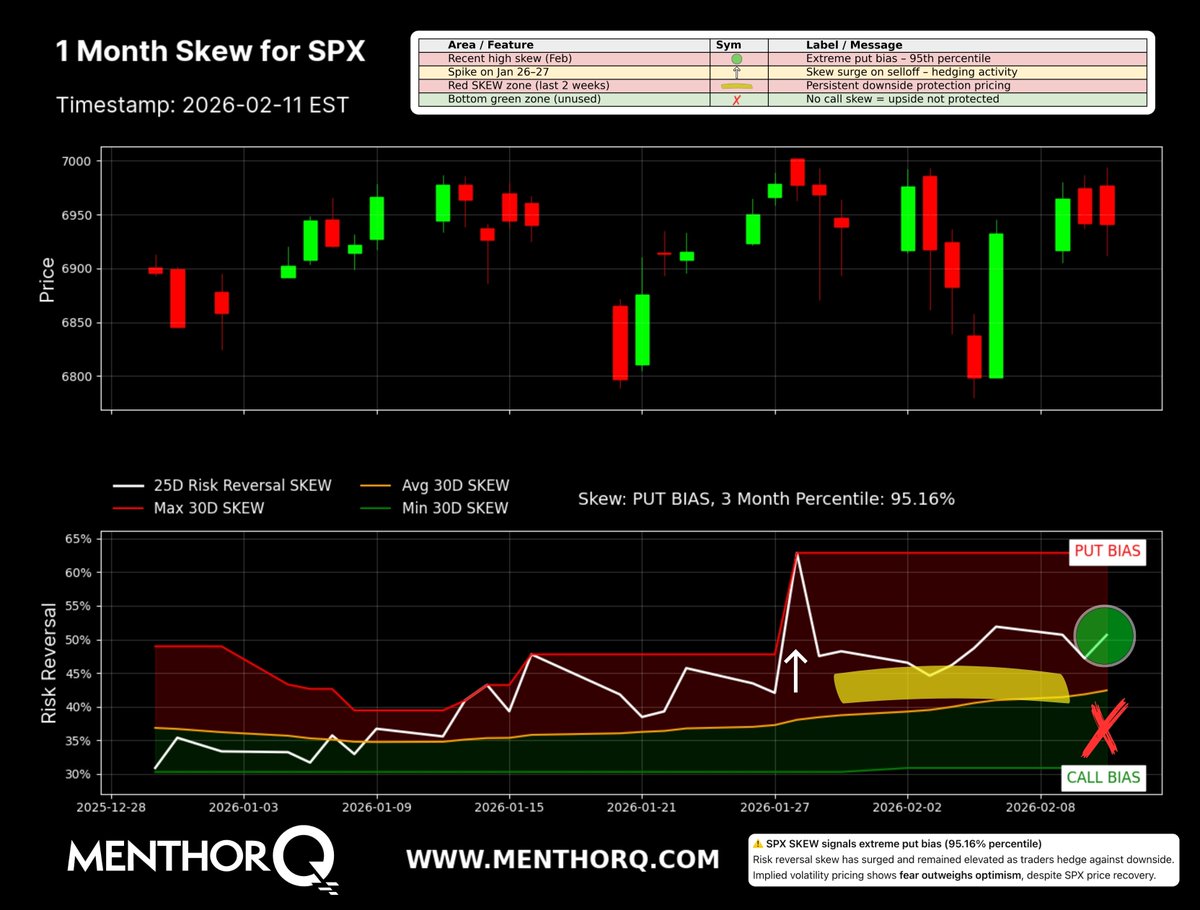
1/ This chart shows the 1-Month SKEW for $SPX — and it’s flashing a strong PUT BIAS.
Let’s break down what that means in simple terms. 🧵👇
Let’s break down what that means in simple terms. 🧵👇
2/ First: What is “skew”?
Skew measures the difference in demand between:
• Downside protection (puts)
• Upside speculation (calls)
When skew rises → traders are paying more for downside protection.
Skew measures the difference in demand between:
• Downside protection (puts)
• Upside speculation (calls)
When skew rises → traders are paying more for downside protection.
3/ Right now, skew is in the 95th percentile over the last 3 months.
That means:
• Put demand is higher than 95% of recent readings.
• Traders are aggressively hedging downside risk.
That’s elevated fear / caution in the options market.
That means:
• Put demand is higher than 95% of recent readings.
• Traders are aggressively hedging downside risk.
That’s elevated fear / caution in the options market.
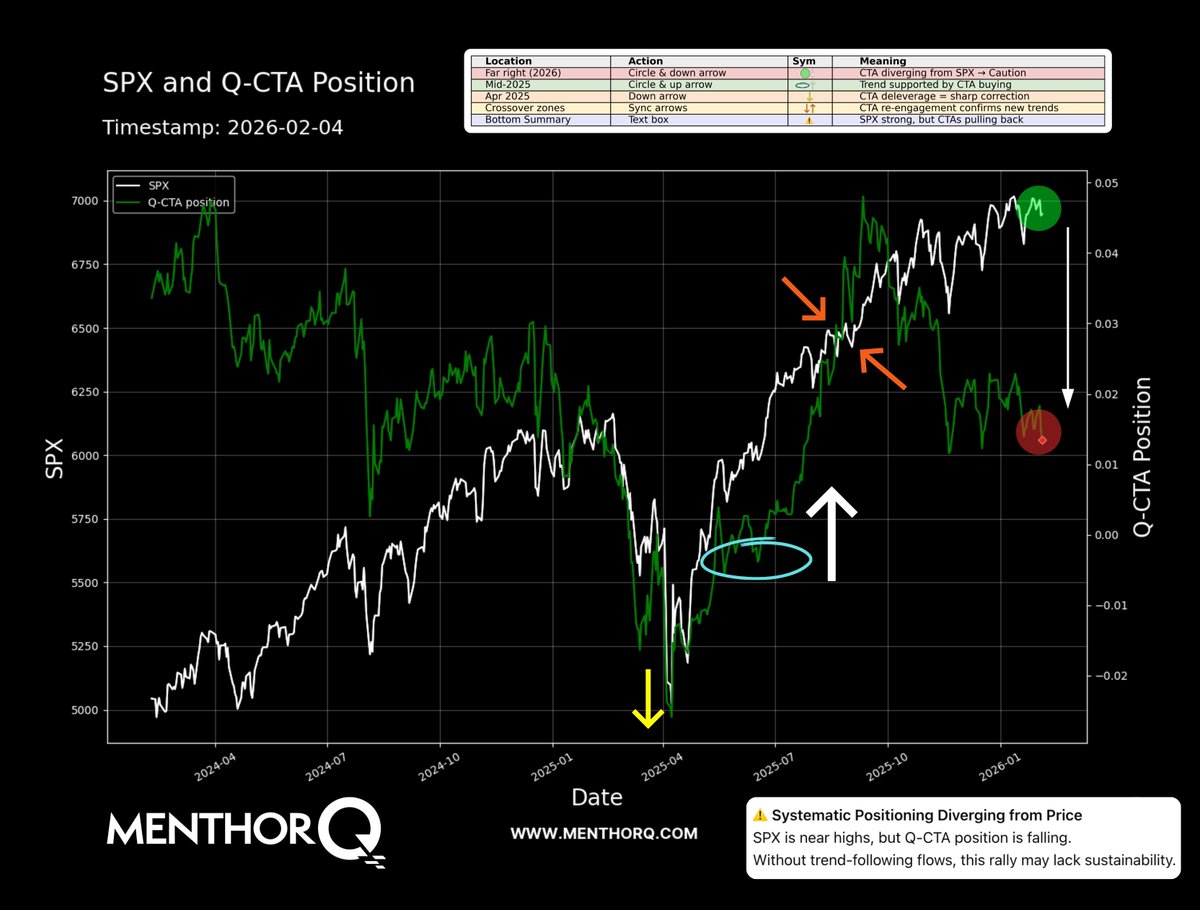
4/ Notice how price (top chart) has been holding near highs. But below, skew has surged into deep PUT BIAS territory.
This is interesting because:
Price = relatively strong
Hedging demand = very strong
That’s a divergence.
This is interesting because:
Price = relatively strong
Hedging demand = very strong
That’s a divergence.
5/ When skew spikes like this, it usually means:
• Institutions are buying protection
• Tail risk hedging is increasing
• Market participants expect possible volatility ahead
It doesn’t mean a crash is coming.
It means traders are preparing for one.
• Institutions are buying protection
• Tail risk hedging is increasing
• Market participants expect possible volatility ahead
It doesn’t mean a crash is coming.
It means traders are preparing for one.
6/ Historically, extreme skew can lead to two different outcomes:
1. Market drops and hedges pay off
2. Market holds up, and excessive hedging unwinds (which can support price)
Both are possible.
1. Market drops and hedges pay off
2. Market holds up, and excessive hedging unwinds (which can support price)
Both are possible.
7/ The key takeaway:
Options positioning is defensive right now, even though SPX price is elevated.
That tells us sentiment underneath the surface is cautious, not euphoric.
Options positioning is defensive right now, even though SPX price is elevated.
That tells us sentiment underneath the surface is cautious, not euphoric.
8/ Big picture:
Skew doesn’t predict direction.
It shows positioning and insurance demand.
Right now:
• Hedging is expensive
• Downside protection is crowded
• Market participants are bracing for volatility
Always do your own research.
Skew doesn’t predict direction.
It shows positioning and insurance demand.
Right now:
• Hedging is expensive
• Downside protection is crowded
• Market participants are bracing for volatility
Always do your own research.
• • •
Missing some Tweet in this thread? You can try to
force a refresh