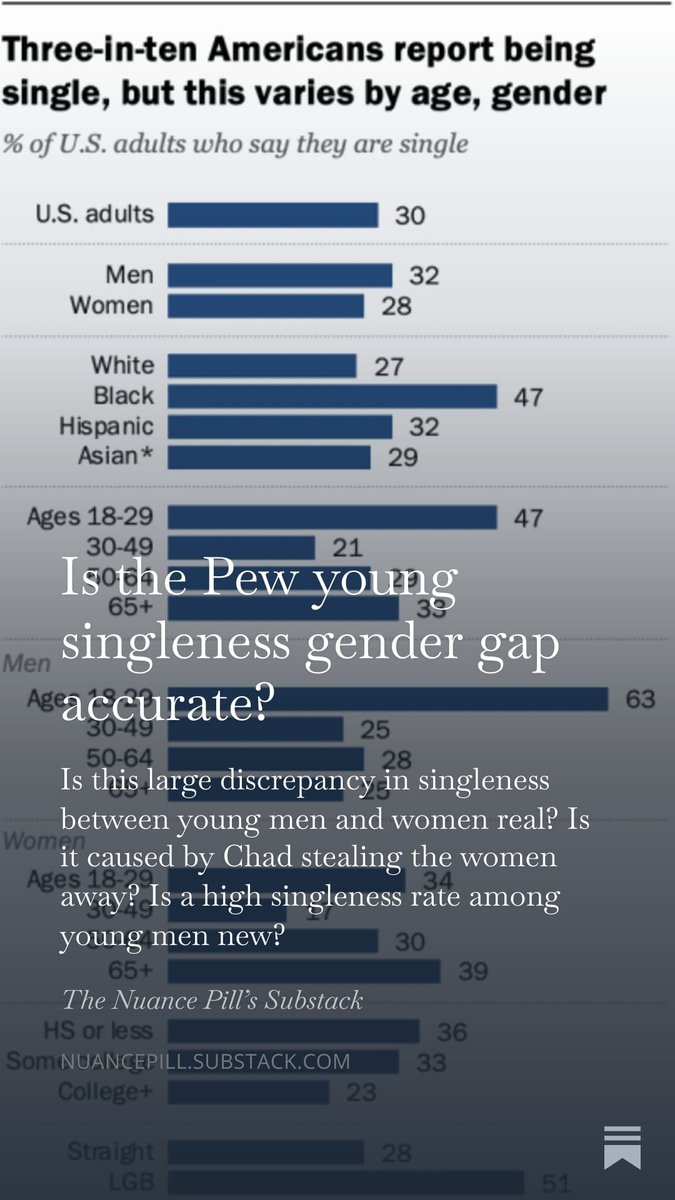
Not a single other source replicates this 29-point gap, but instead gaps of around 10-15%, which can reasonably be attributed to age gaps.
People should know by now that the stats that go viral are rarely the most accurate ones.
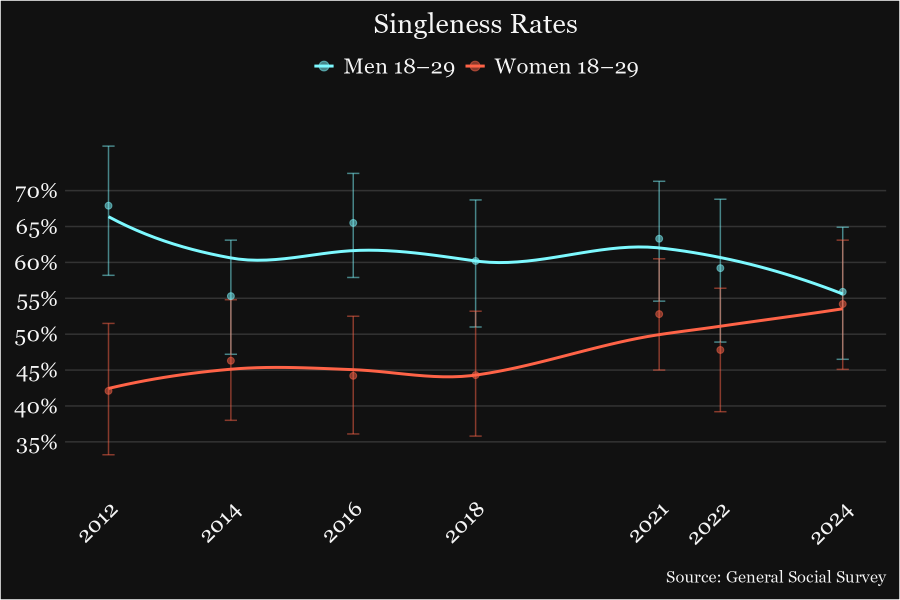
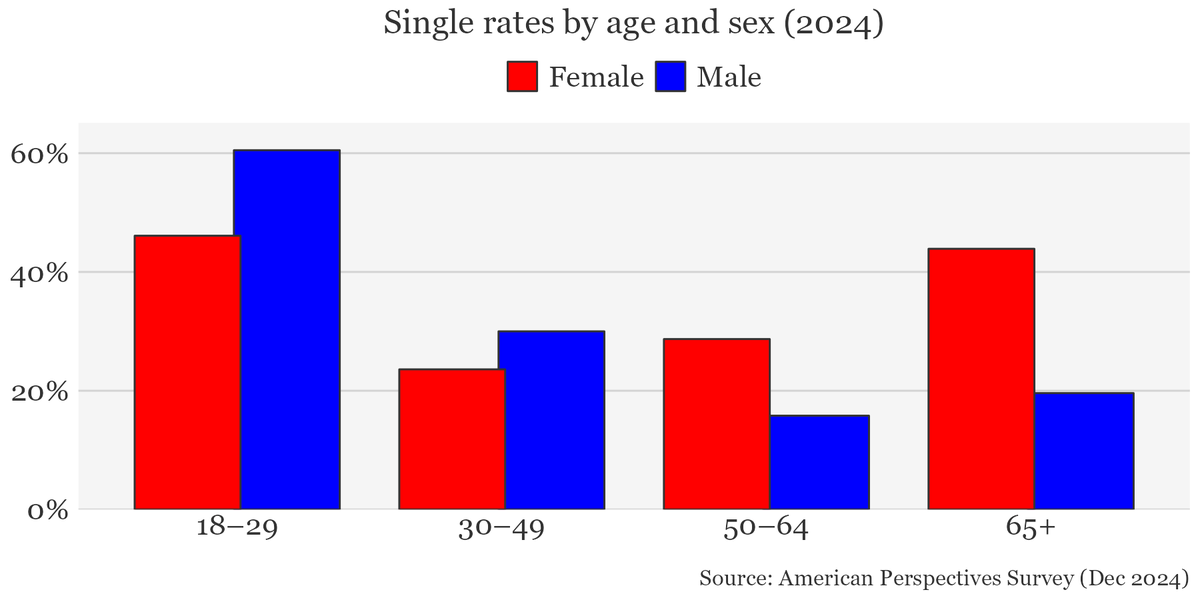
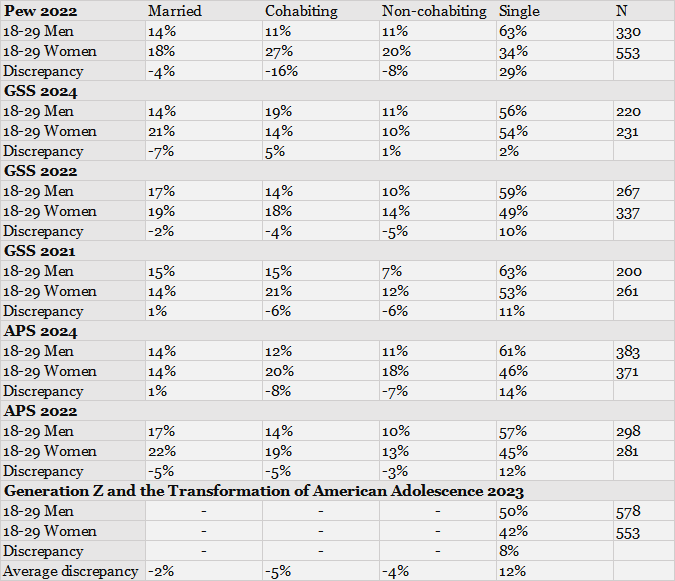
The sample sizes of these other surveys are roughly comparable to Pew's.
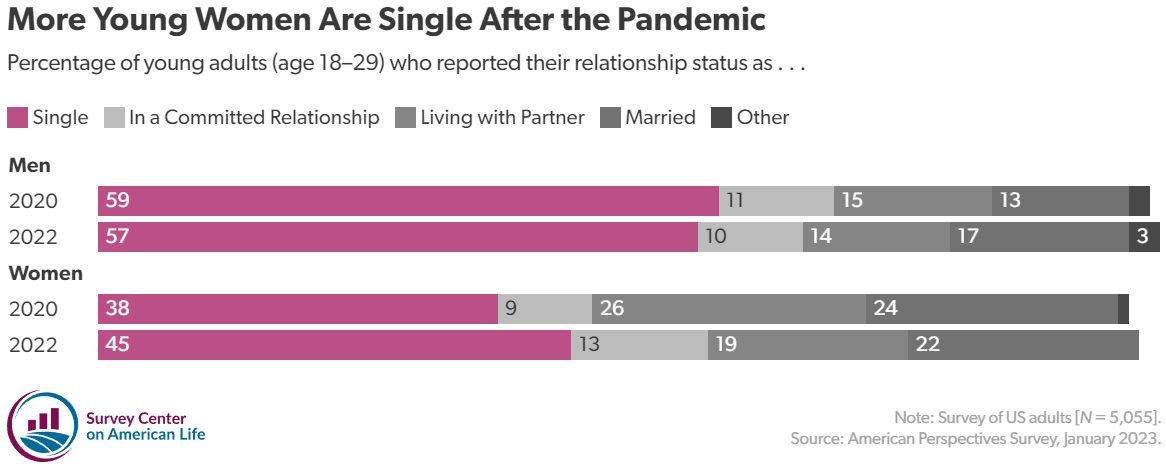
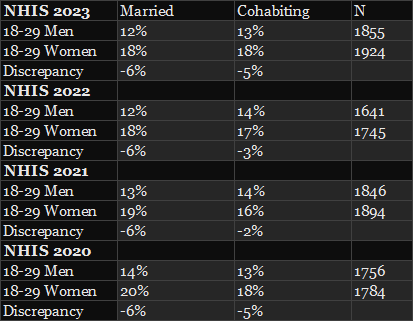
The NHIS has a far larger sample size but is limited by the fact that it doesn't capture non-cohabiting relationships. But it shows that cohabiting young women were overrepresented in the Pew survey.
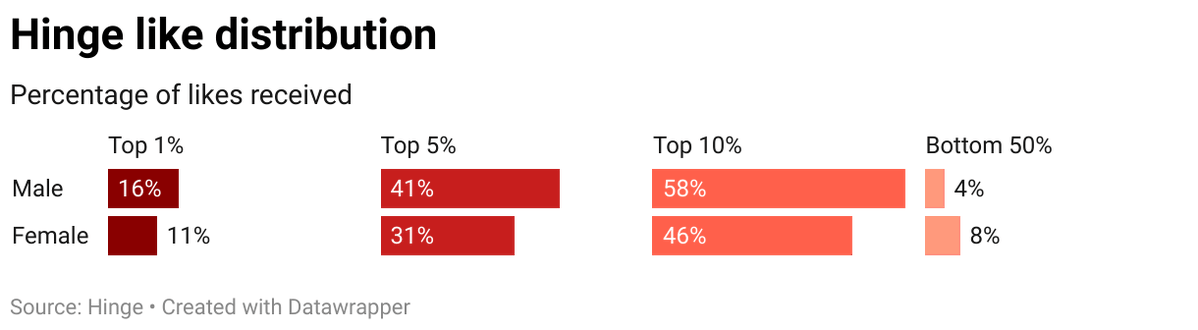
The most popular explanation for the gap is covert 'Chad harems': women *think* they're in an exclusive relationship with Chad, but *actually*...
The same Pew survey leaves little room for this explanation, as 3/4ths of the gap was driven by cohabitation and marriage.
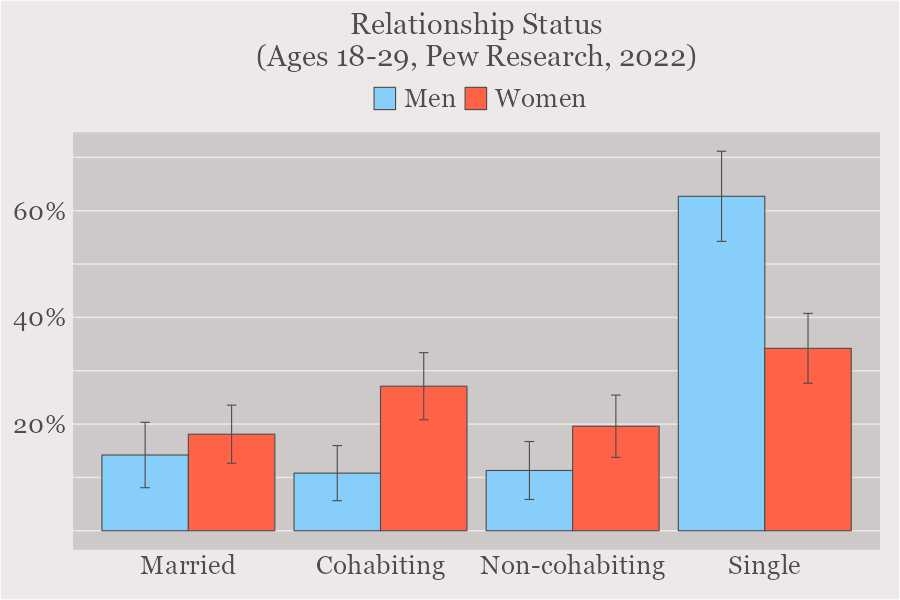
The only category where this theory could plausibly apply is the more ambiguous third category, where the average gap across all surveys is 4%.
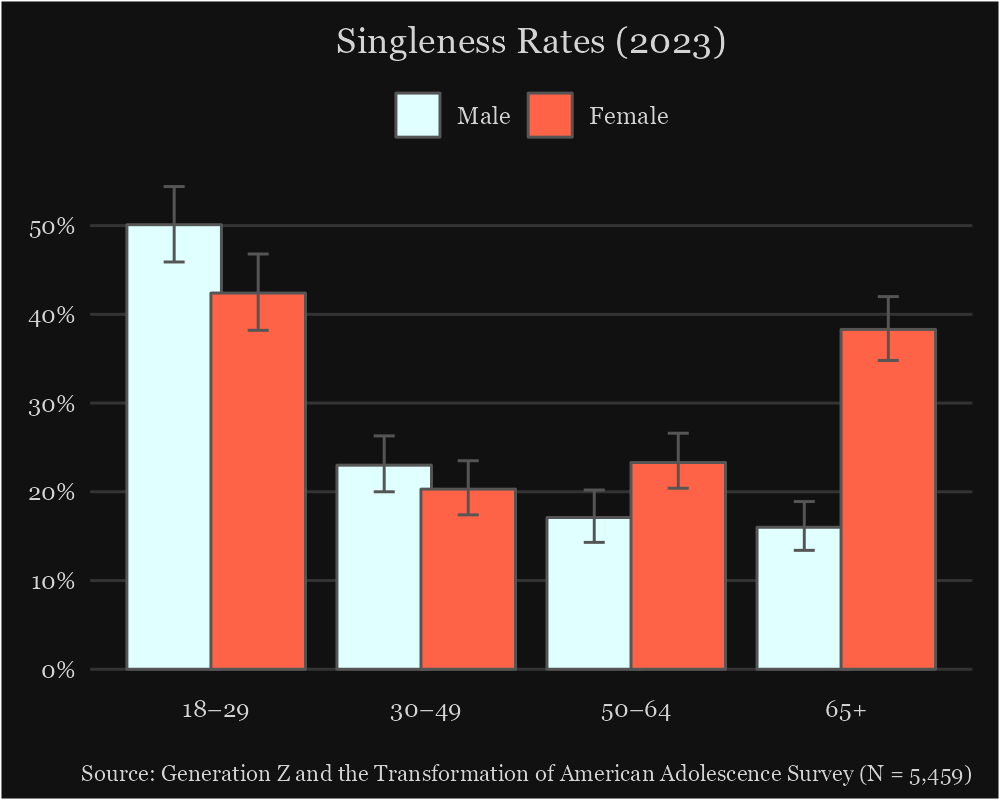
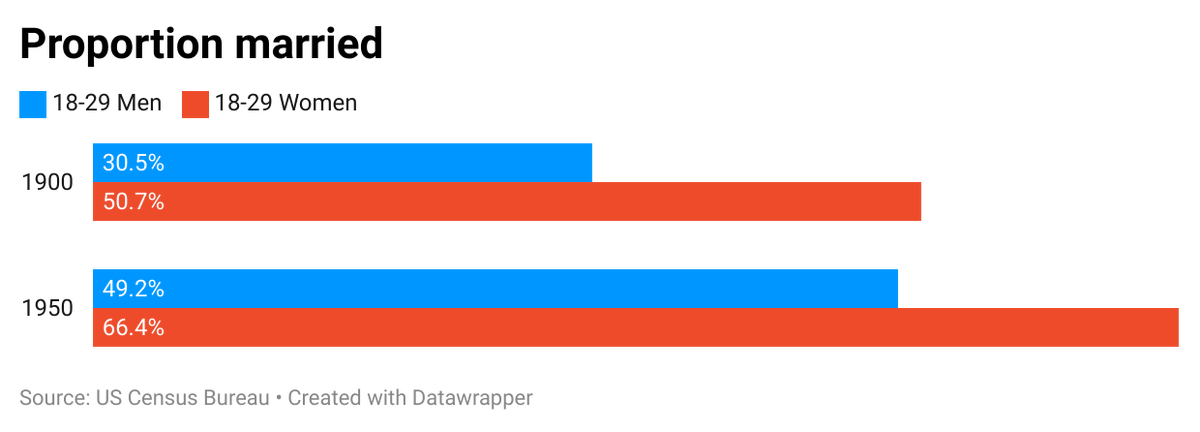
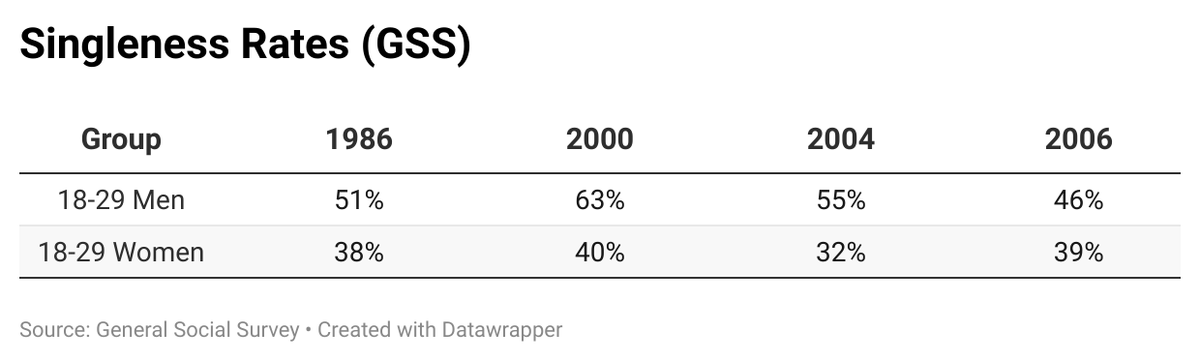
Finally, there's nothing new about most young men being single, nor about singleness gaps the size seen in the more realistic estimate.
• • •
Missing some Tweet in this thread? You can try to
force a refresh
1/ This doesn’t mean what people think it does, and does not validate the '80/20 rule' as commonly understood.
For those open to a different perspective, here's why the simple extrapolation from dating app swipes to 'Chad harems' is unjustified 🧵
/2 First, the graph is based on self-reported selectivity (% of likes given) from 27 women polled by essentially a 'Chadfish' Tinder profile, which served as the proxy for female 'attractiveness'. Likes received by men was the proxy for male attractiveness.
/3 One limitation of this data is that only one side of the equation is presented.
The male Hinge data is often brought up, showing a steep skew in likes received. What's typically left out is the female data showing a similar skew only slightly less steep.
It seems feminists are increasingly adopting talking points from the manosphere and reframing them as 'empowering'.
This idea that 5% of men hoarded all the women (during the neolithic era - a detail often omitted) sounds absurd on its face because it is. Let's see why exactly🧵
The theory underlying this tends to be that as social/wealth inequality rose following the advent of agriculture, so too did reproductive inequality among men, with women opting to share a higher status man than settle for one of low status.
Issues with this theory:
The effect of social status on men's reproductive success is of similar magnitude in hunter gatherer, agriculturalist, and pastoralist societies: researchgate.net/publication/30…
'Chad' has been officially debunked.
Here's why the 'growing Chadopolization' of the sexual marketplace is a myth:
🧵
There is a pervasive belief online that a minority of aesthetically gifted men—colloquially referred to as 'Chads'—are hoarding a growing share of the sexual pie, leaving the majority of men out in the cold and fighting over scraps: the so-called '80/20 rule'.
Before, this destructive sexual dynamic was suppressed by the enforcement of monogamy. Following the sexual revolution however, it has naturally re-emerged, and is having disastrous effects on society. This narrative has begun to be promoted by academics.
Here we go again. This 'app-driven chadopoly' theory is totally evidence-free. It's all based on overly simplistic extrapolations from imbalanced swipe rates and many men having low match rates. This says next to nothing about what actual behaviour these apps are facilitating 🧵
Swipe rates in a vacuum provide negligible insight. For one thing--at least partially owing to the skewed gender ratio--many men adopt a spray and pray approach to swiping, filtering out any undesired matches after the fact (which swiping data doesn't capture).
When we look at the median match rates, we see a ratio of about 1:2.75 M:F, which happens to mirror the gender ratio. This means that after adjusting for the gender imbalance, the average woman is actually matching at the same rate as the average man.
In a study by Scott & Ward (2018), observers rated the mental health, attractiveness, physical health, and masculinity of composite faces made from men who scored the highest or lowest in AQ (Autism), IDS (Depression), and SPQ (Schizotypy).
🧵
Easy to mistake the 'low' and 'high' as referring to scores on the traits listed on the right, but low 'actual mental health' implies they score higher on the traits and vice versa.
What we see is that despite the fact that the composite images with low actual mental health were accurately perceived as such, only men high in schizotypal traits were rated significantly lower in attractiveness.