Lauri Myllyvirta Profile picture
Feb 28 9 tweets 3 min read Read on X
China's official statistics report a 0.3% drop in CO2 emissions from energy&industry in 2025, the third time that annual emissions have fallen this century and the first fall predominantly driven by clean energy growth. Image
Coal consumption grew 0.1%, oil consumption 3.6% and gas consumption 2%, while non-fossil energy use grew 14%. Yet, after subtracting non-energy use, total fossil energy consumption fell 0.4%, showing how chemical industry demand drove fossil fuel use.
Power generation from carbon-free sources grew 14%, covering all of the 4.8% growth in total power generation and pushing thermal power (coal, gas and biomass) down 0.7%. Image
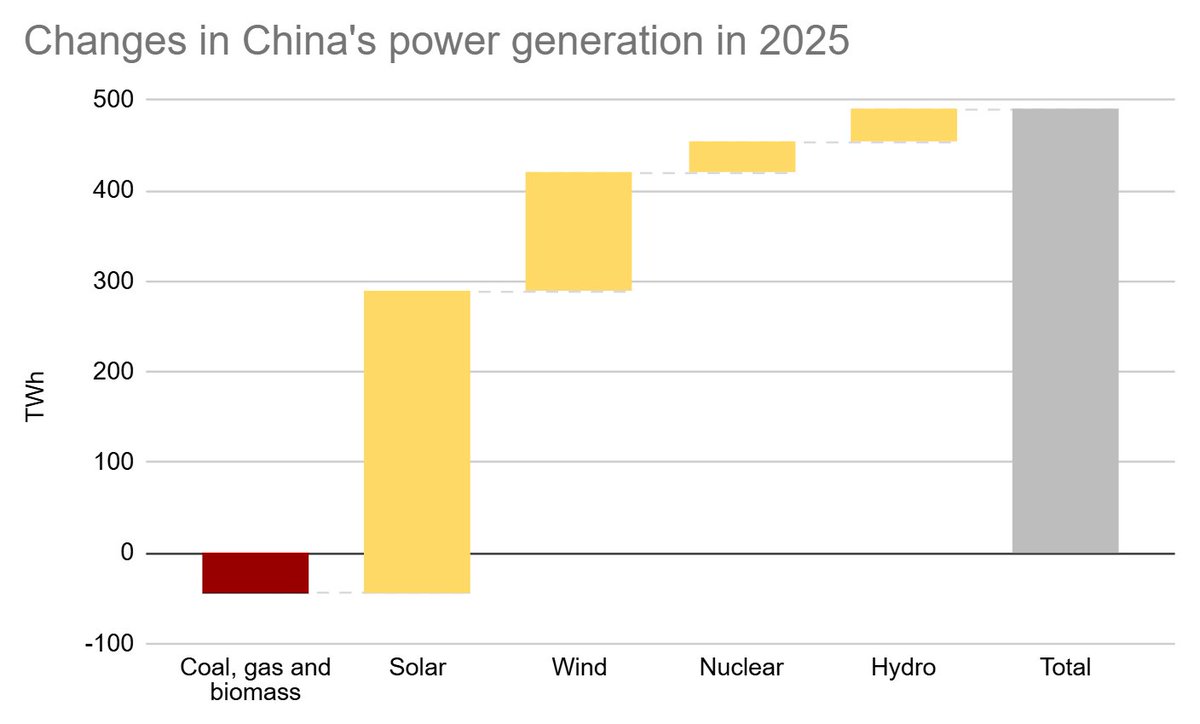
Solar power delivered 62% of the growth in clean power generation, wind power 24%, hydro 7% and nuclear 6%. Wind power generation grew 13% while capacity increased 23%, indicating issues with grid integration.
The share of clean power generation in China's power mix reached 40% up from 37% in 2024, with solar and wind making up 22%, up from 18%. In the total energy mix, the share of non-fossil energy rose to 21.7%, up from 19.8%.
China seems to have revised the definition of carbon intensity to include industrial process emissions. Which emissions are included has not been specified in the country's climate commitments, making these kinds of revisions possible. Image
Because of the fall in cement production, in particular, the revised definition of carbon intensity will give China space to emit a bit more CO2 while meeting the 2030 climate commitment.
My estimate for the fall in CO2 in 2025 was precisely the same 0.3%, but I can't claim that level of accuracy as the changes in coal, oil and gas consumption and process CO2 were not the same as in official data, with the differences canceling out.
carbonbrief.org/analysis-china…
Today's data release - Statistical Communique on Economic and Social Development
stats.gov.cn/sj/zxfb/202502…

• • •

Missing some Tweet in this thread? You can try to force a refresh
 

Keep Current with Lauri Myllyvirta

Lauri Myllyvirta Profile picture

Stay in touch and get notified when new unrolls are available from this author!

Read all threads

This Thread may be Removed Anytime!

PDF

Twitter may remove this content at anytime! Save it as PDF for later use!

Try unrolling a thread yourself!

how to unroll video
  1. Follow @ThreadReaderApp to mention us!

  2. From a Twitter thread mention us with a keyword "unroll"
@threadreaderapp unroll

Practice here first or read more on our help page!

More from @laurimyllyvirta

Oct 28, 2025
NEW from us: current clean energy targets and trends enable China, India, and Indonesia to peak power sector emissions by 2030. This would be a global breakthrough given that these nations have been the largest growth markets for coal in the decade since the Paris Agreement. Image
China, India and Indonesia used 73% of the world's coal in 2024. Without their emissions growth, global energy sector CO2 would have peaked before 2020. Coal use grew 15% in China, 42% in India, and 150% in Indonesia 2015-2024, while consumption in the rest of the world fell 23%. Image
China’s power sector emissions have been falling since early 2024 and will continue to decline if the country continues its current clean energy growth. Image
Read 14 tweets
Sep 22, 2025
A key point I always try to convey to policymakers and business folks in the west is that China's competitiveness in manufacturing is underpinned by unrivaled scale and ecosystem. The stereotype far too often is that it's all about subsidies and cheap labor, which...
...causes people to drastically underestimate the challenge of building alternative supply chains and the scale of the resources required to do it.
Or well, a lot of powerful people seem to be so out of touch with the physical production of things that they vastly *overestimate* the challenge in some areas (rare earths) and vastly underestimate it in others (solar and batteries).
Read 8 tweets
Aug 13, 2025
NEW from us: Last year, China started construction on an estimated 95 gigawatts (GW) of new coal power capacity, enough to power the entire UK twice over.

We explain why China's still building new coal power plants, and when and how it might stop and begin phasing out. Image
We address several persistent myths and misconceptions about coal power in China. These are the key points we make: Image
POINT 1: New coal is not needed for energy security
Making sure there is enough capacity to cover peak demand is what the government (mainly) means when they talk about “energy security” as the justification for new coal power.
Read 34 tweets
Jul 31, 2025
Important data drop that I've been waiting for on China's massive solar installations in H1:
🌞 solar power capacity additions doubled year-on-year to 212 gigawatts, with total capacity at the end of H1 increasing a whopping 54% year on year
Distributed solar accounted for 53% of new additions.
👉 This implies plenty of centralized solar projects are still on the way, many aiming to finish before the end of China's current 5-year plan in December.
Solar generation grew 43% while capacity grew 54%.
🔎 This suggests capacity utilization is slipping—likely due to higher curtailment—but the impact is still much smaller than the surge in capacity.
Read 8 tweets
Jul 4, 2025
Jaw-dropping: while most everyone has been projecting a slowdown in China's wind&solar deployment, the State Grid Energy Research Institute expects 380 GW solar and 140 GW wind added to the grid this year. Image
It's been clear that clean (and dirty) power capacity additions numbers would be buoyed by the end of the five-year plan period, when a lot of projects race to complete. But I have not seen anyone predict anything this big.
These clean capacity additions mean around 850 TWh/year of clean power generation added to the grid while the State Grid also projects demand to grow 400-640 TWh (4.0-6.5%).

So this clean energy growth should push power sector emissions down this year and well into next year. Image
Read 8 tweets
Jun 24, 2025
We knew China's rush to install solar and wind was going to be wild but WOW😮. The solar panels & wind turbines installed in May alone, in a single month, will generarate as much electricity as:
-Poland
-Sweden
-Norway
-the UAE
-North Carolina&Maryland or
-Washington&Wyoming Image
Image
In the first five months of the year, China added 198 GW of solar and 46 GW of wind. Those turbines and panels will generate as much electricity as:
-Indonesia
-Turkey
-Any U.S. state except for Texas or
-California, Arizona and New Mexico put together
-and much more than the UK
Chinese companies installed 93 GW of solar and 27 GW of wind in a single month in May. That's about 230 million solar panels and 5300 wind turbines. That's almost 100 solar panels every second, and a wind turbine every 10 minutes.
Read 12 tweets

Did Thread Reader help you today?

Support us! We are indie developers!


This site is made by just two indie developers on a laptop doing marketing, support and development! Read more about the story.

Become a Premium Member ($3/month or $30/year) and get exclusive features!

Become Premium

Don't want to be a Premium member but still want to support us?

Make a small donation by buying us coffee ($5) or help with server cost ($10)

Donate via Paypal

Or Donate anonymously using crypto!

Ethereum

0xfe58350B80634f60Fa6Dc149a72b4DFbc17D341E copy

Bitcoin

3ATGMxNzCUFzxpMCHL5sWSt4DVtS8UqXpi copy

Thank you for your support!

Follow Us!

:(