Interpreting an #ECG can seem overwhelming at first, but with a structured approach, it becomes far more manageable.
In this thread, I’ll walk you through how to analyze an ECG like a professional, step by step.
Let’s begin.🧵
In this thread, I’ll walk you through how to analyze an ECG like a professional, step by step.
Let’s begin.🧵
Step 0: Initial Checks
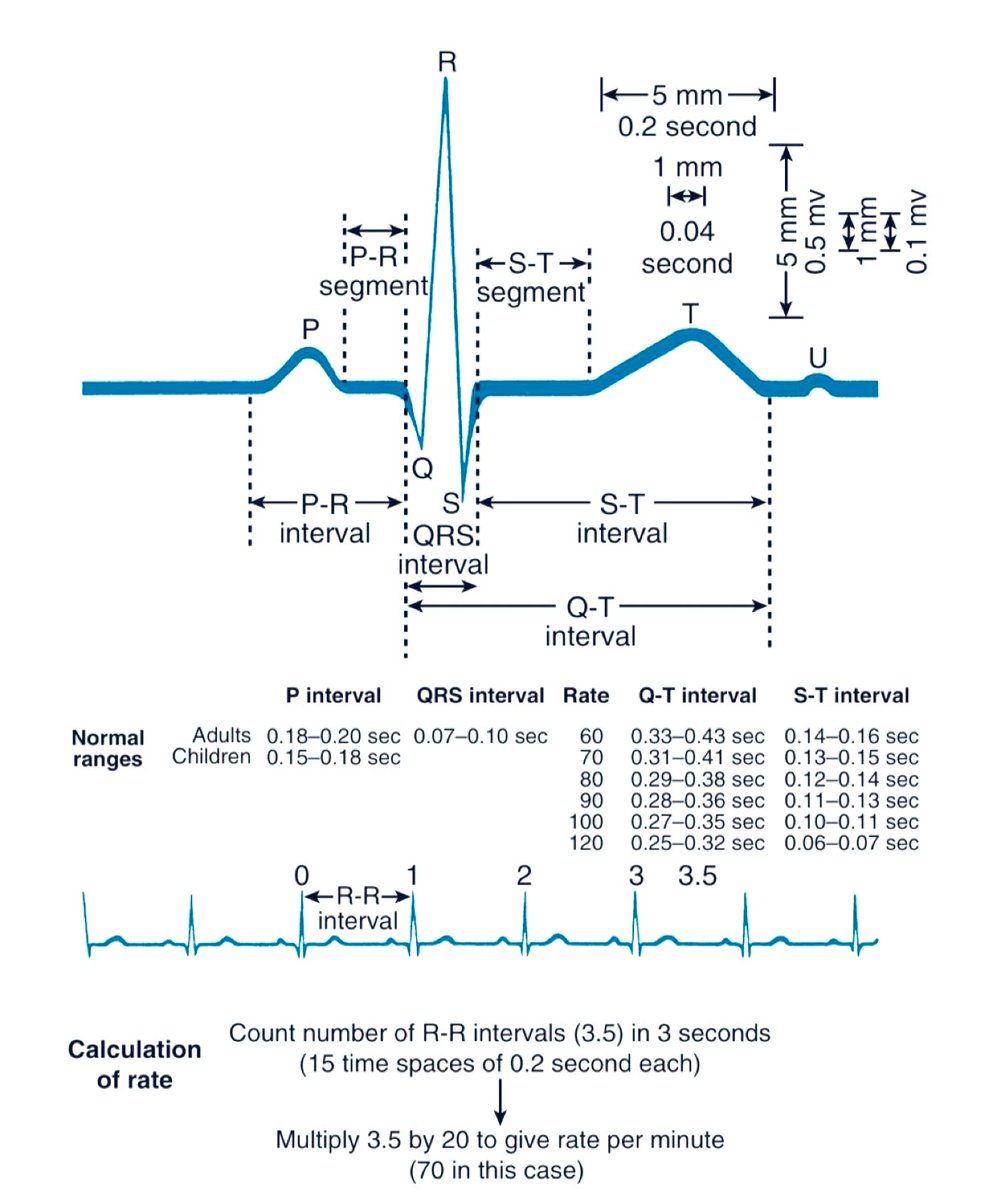
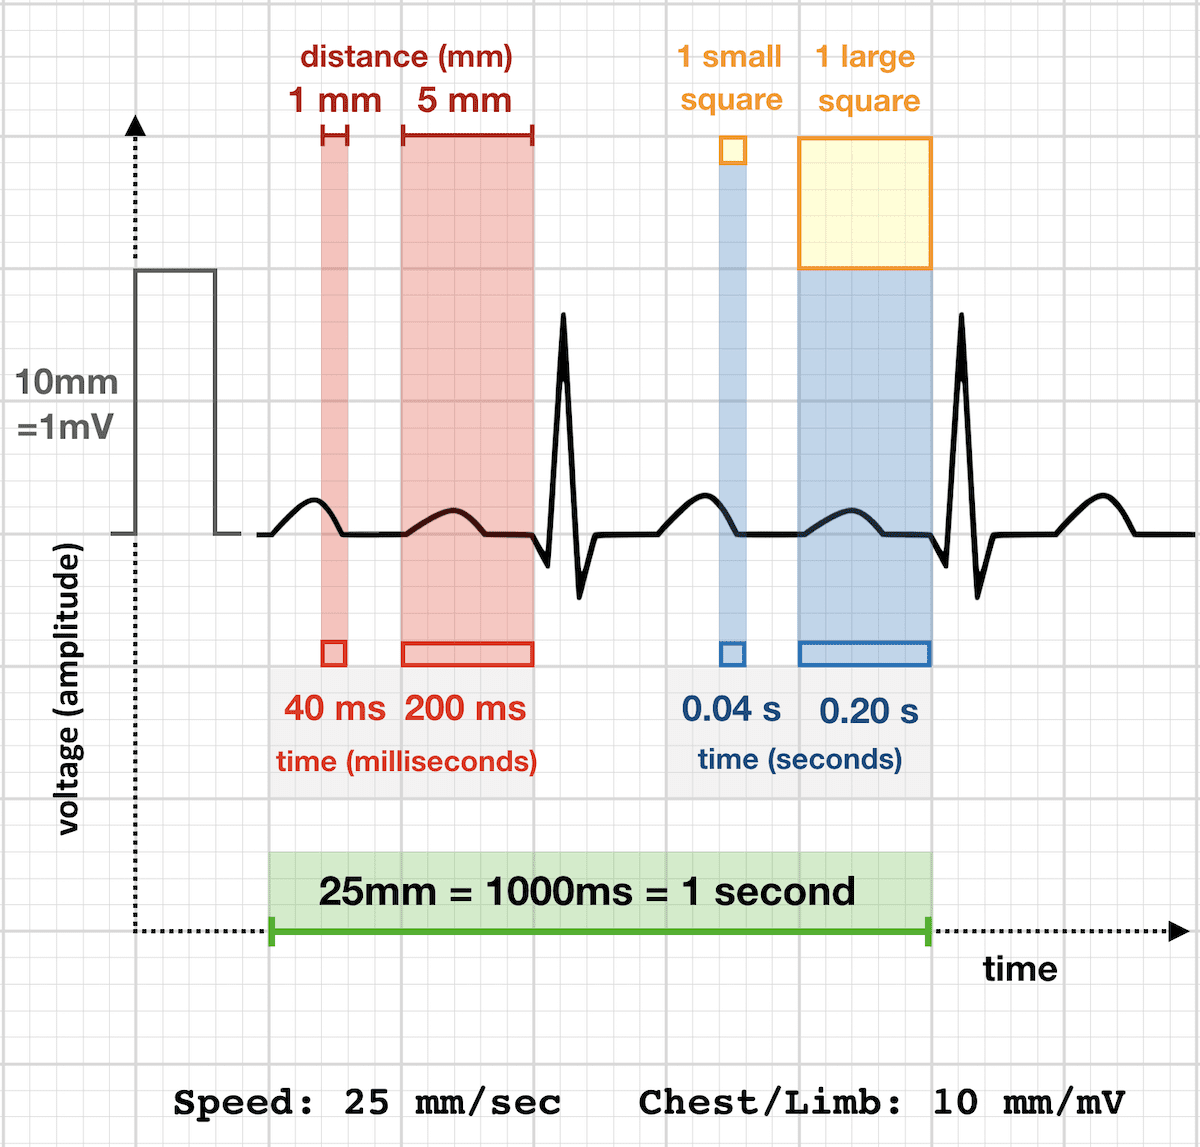
1. Paper Speed
The standard ECG paper speed is 25 mm/s, meaning:
◾1 small square = 0.04 s
◾1 large square = 0.20 s (5 small squares)
2. Calibration
This determines the amplitude of the waves:
⏺️ 1 mV = 10 mm (i.e., 2 large squares vertically
1. Paper Speed
The standard ECG paper speed is 25 mm/s, meaning:
◾1 small square = 0.04 s
◾1 large square = 0.20 s (5 small squares)
2. Calibration
This determines the amplitude of the waves:
⏺️ 1 mV = 10 mm (i.e., 2 large squares vertically
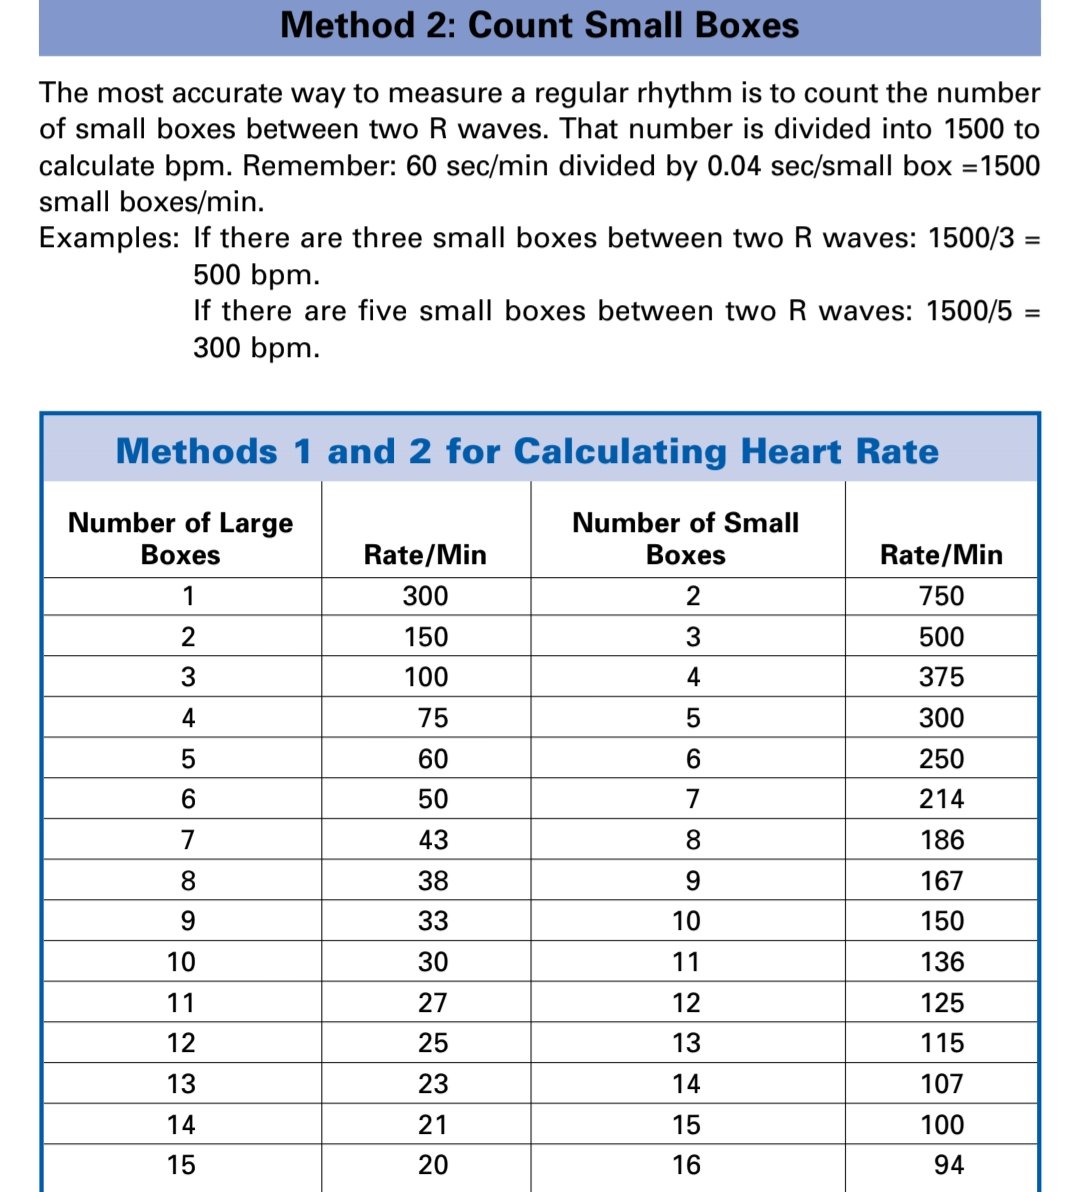
Step 1: Heart Rate (HR)
If rhythm is regular:
Use the formula
Heart Rate = 300 / number of large squares between R waves
Alternatively, memorize the sequence:
300 → 150 → 100 → 75 → 60 → 50
Estimate HR by seeing where the next R wave falls in this pattern.
If rhythm is regular:
Use the formula
Heart Rate = 300 / number of large squares between R waves
Alternatively, memorize the sequence:
300 → 150 → 100 → 75 → 60 → 50
Estimate HR by seeing where the next R wave falls in this pattern.
....If rhythm is irregular:
🔹Count 30 large squares (which equals 6 seconds)
🔹Count the number of QRS complexes in that span
🔹Multiply the count by 10 to estimate the HR (beats per minute
🔹Count 30 large squares (which equals 6 seconds)
🔹Count the number of QRS complexes in that span
🔹Multiply the count by 10 to estimate the HR (beats per minute
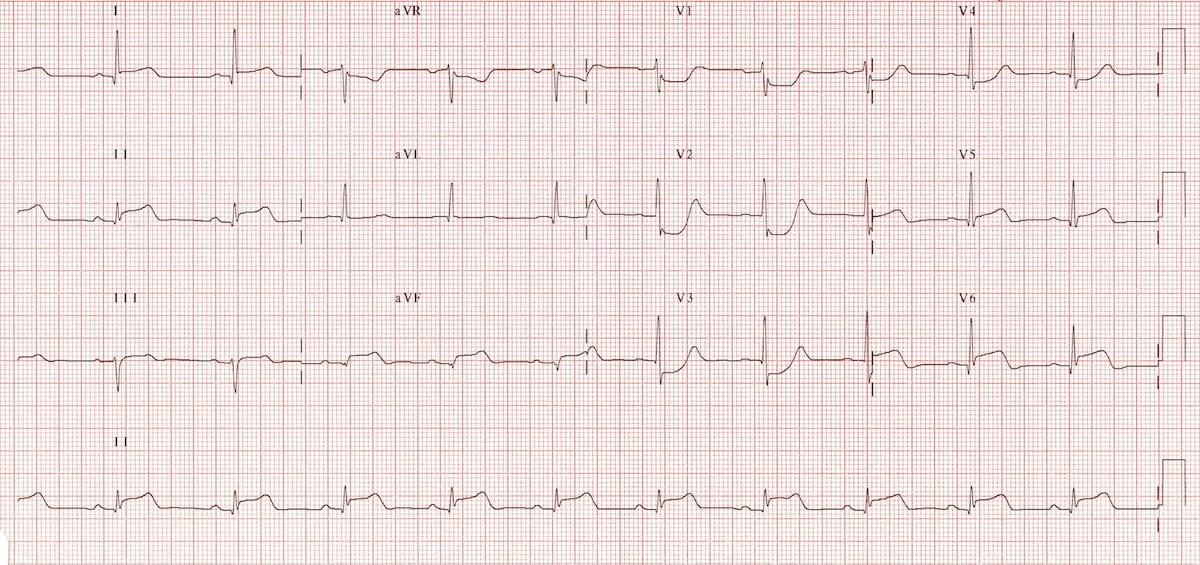
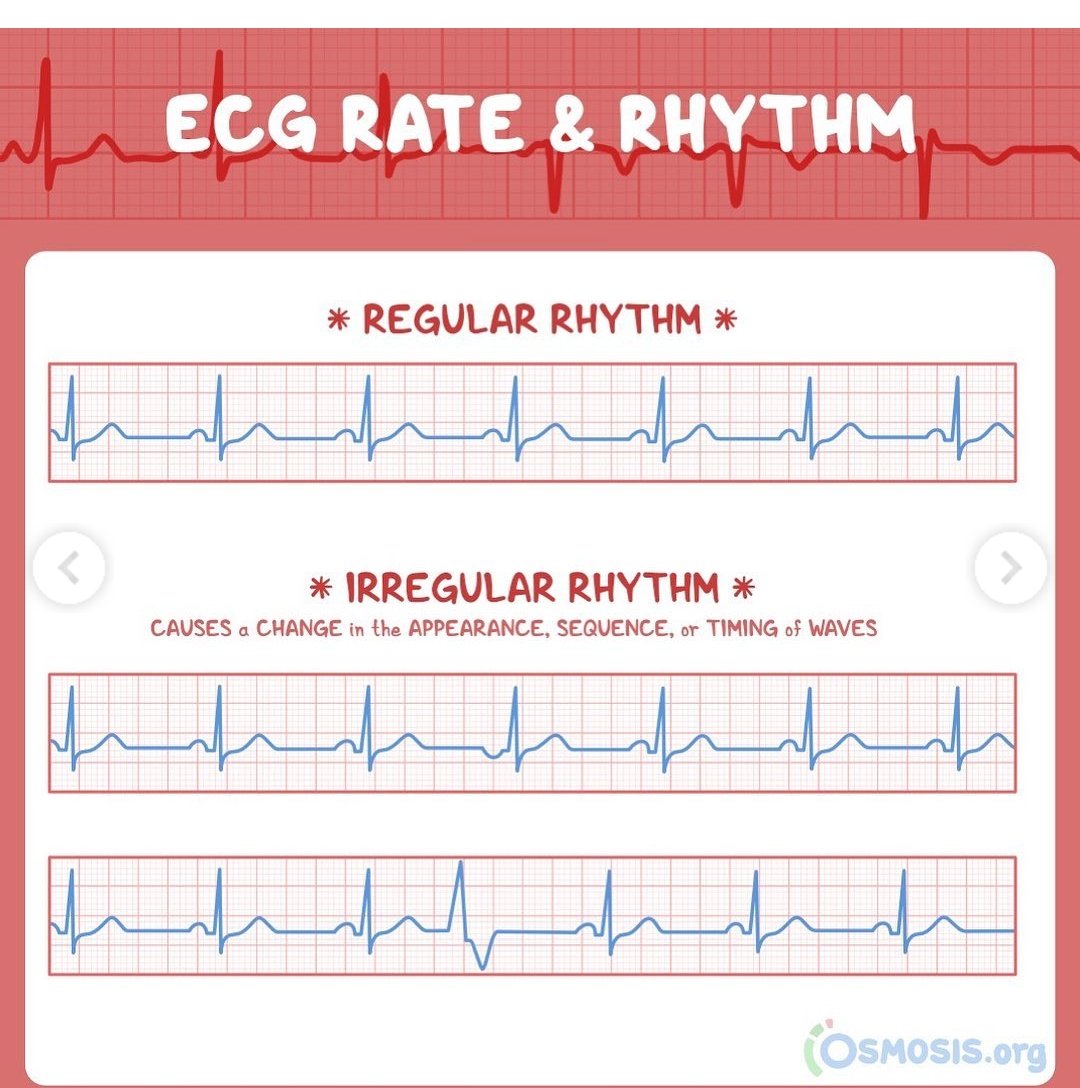
Step 2: Rhythm Assessment
Determine whether the rhythm is regular or irregular.
◾Regular rhythm: Fixed R–R intervals
Proceed to examine P waves and confirm if it's sinus rhythm
◽Irregular rhythm: Consider
🔸Atrial fibrillation
🔸Ectopic beats
🔸Heart blocks
Determine whether the rhythm is regular or irregular.
◾Regular rhythm: Fixed R–R intervals
Proceed to examine P waves and confirm if it's sinus rhythm
◽Irregular rhythm: Consider
🔸Atrial fibrillation
🔸Ectopic beats
🔸Heart blocks
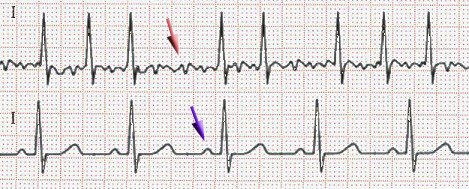
Step 3: P Waves
Evaluate the presence, morphology, and relationship to QRS.
✳️Present and upright in leads I, II, and aVF
→ Suggests sinus rhythm (if criteria below are met):
🔹Heart rate between 50–120 bpm
🔹Every P wave is followed by a QRS
🔹Consistent PR interval
Evaluate the presence, morphology, and relationship to QRS.
✳️Present and upright in leads I, II, and aVF
→ Suggests sinus rhythm (if criteria below are met):
🔹Heart rate between 50–120 bpm
🔹Every P wave is followed by a QRS
🔹Consistent PR interval
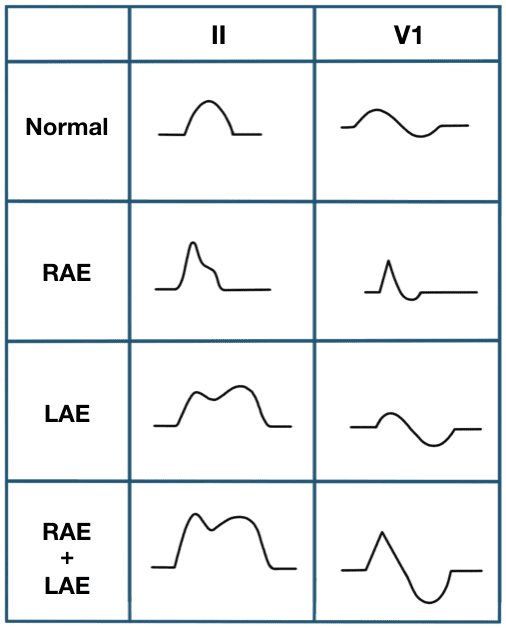
....Absent P waves: Think of atrial fibrillation
More P waves than QRS complexes: Suspect atrial flutter or atrial tachycardia
More P waves than QRS complexes: Suspect atrial flutter or atrial tachycardia
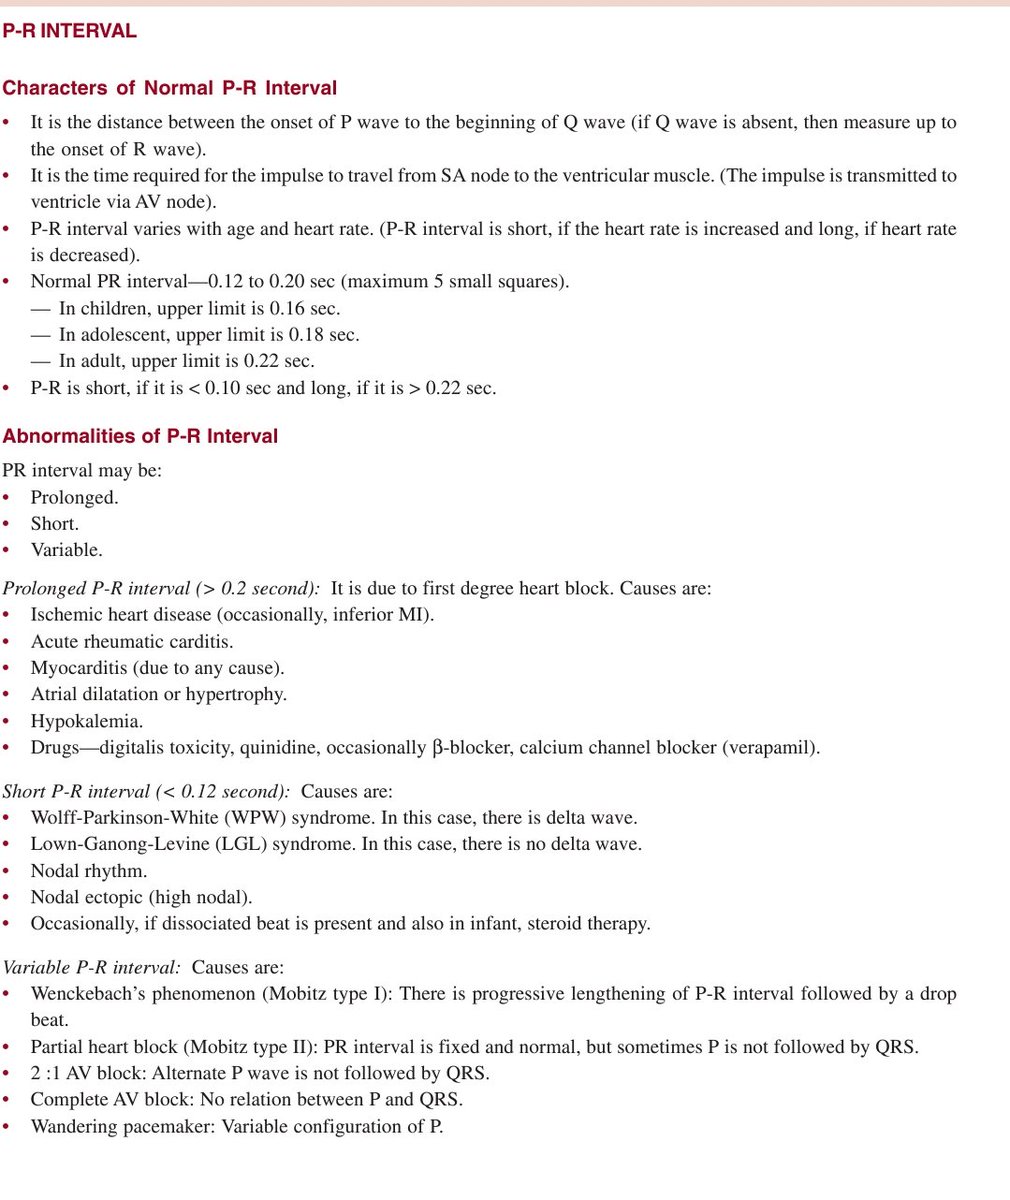
Step 4: PR Interval
Normal range: 120–200 ms (3–5 small squares)
◾Short PR interval (<120 ms): Suggests pre-excitation (e.g., Wolff–Parkinson–White syndrome)
◾Prolonged PR interval (>200 ms): Indicates 1st-degree AV block
Normal range: 120–200 ms (3–5 small squares)
◾Short PR interval (<120 ms): Suggests pre-excitation (e.g., Wolff–Parkinson–White syndrome)
◾Prolonged PR interval (>200 ms): Indicates 1st-degree AV block
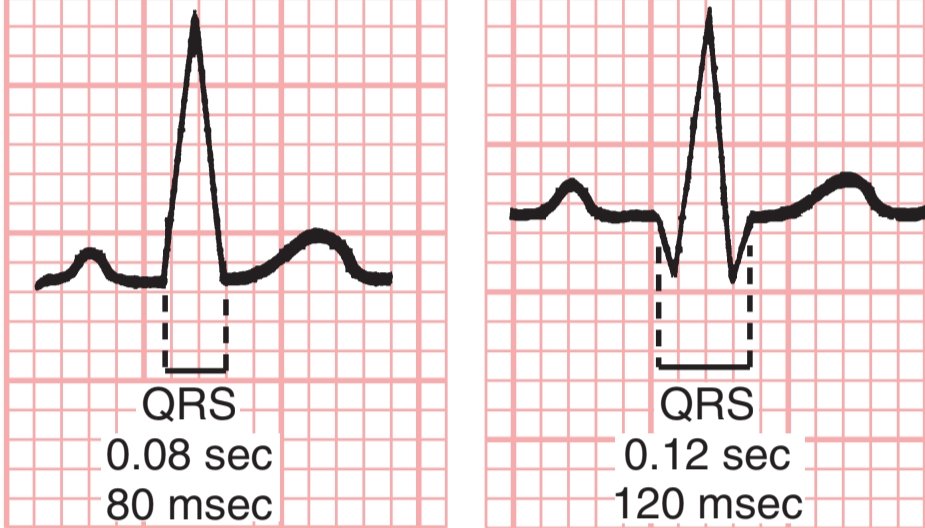
Step 5: QRS Complex
Normal duration: <120 ms (3 small squares)
- Narrow QRS (<110 ms): Suggests supraventricular origin
- Wide QRS (≥120 ms): Consider:
🔸Bundle branch block
🔸Ventricular rhythm
🔸Electrolyte disturbances
🔸Toxicity (e.g., hyperkalemia, tricyclic overdose)
Normal duration: <120 ms (3 small squares)
- Narrow QRS (<110 ms): Suggests supraventricular origin
- Wide QRS (≥120 ms): Consider:
🔸Bundle branch block
🔸Ventricular rhythm
🔸Electrolyte disturbances
🔸Toxicity (e.g., hyperkalemia, tricyclic overdose)
Step 6: Axis Determination
Electrical axis refers to the overall direction of ventricular depolarization in the frontal plane.
Quick method:
1. Look at Lead I and aVF:
✳️ Both positive → Normal axis (–30° to +90°)
👉I positive, aVF negative → Go to Step 2.... 👇
Electrical axis refers to the overall direction of ventricular depolarization in the frontal plane.
Quick method:
1. Look at Lead I and aVF:
✳️ Both positive → Normal axis (–30° to +90°)
👉I positive, aVF negative → Go to Step 2.... 👇
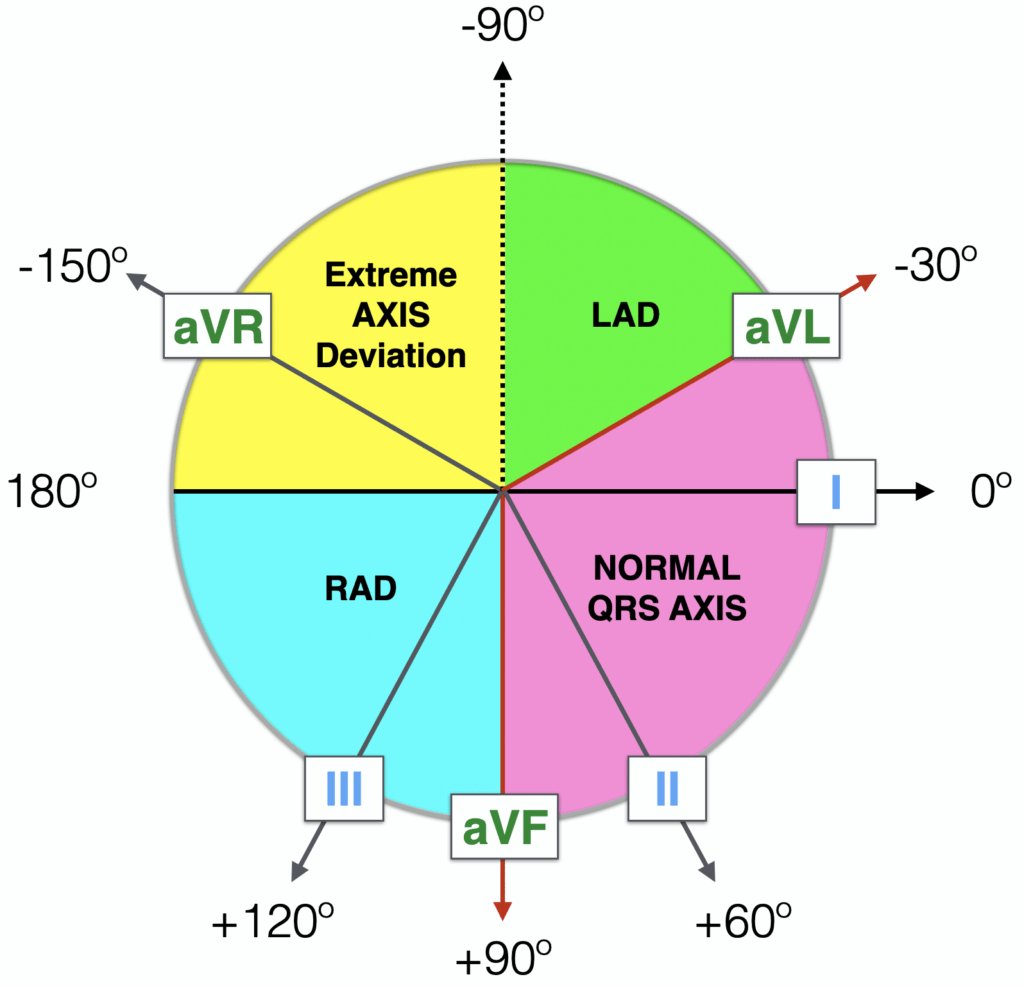
...2. Look at Lead II:
🔺Positive → Still normal
🔻Negative → Left axis deviation
Interpretation ranges:
- Normal axis: –30° to +90°
- Left axis deviation: –30° to –90° (e.g., LBBB, left anterior fascicular block)
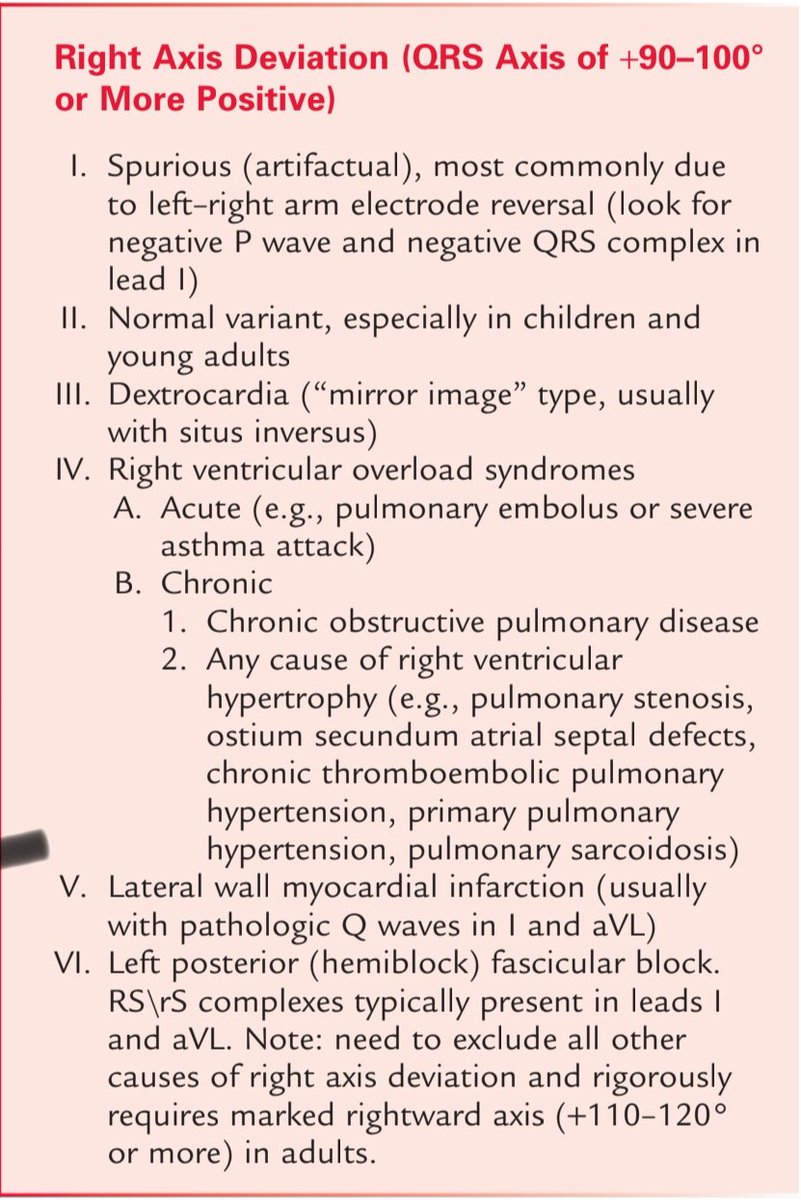
- Right axis deviation: +90° to +180° (e.g., RBBB, RVH, PE)
🔺Positive → Still normal
🔻Negative → Left axis deviation
Interpretation ranges:
- Normal axis: –30° to +90°
- Left axis deviation: –30° to –90° (e.g., LBBB, left anterior fascicular block)
- Right axis deviation: +90° to +180° (e.g., RBBB, RVH, PE)

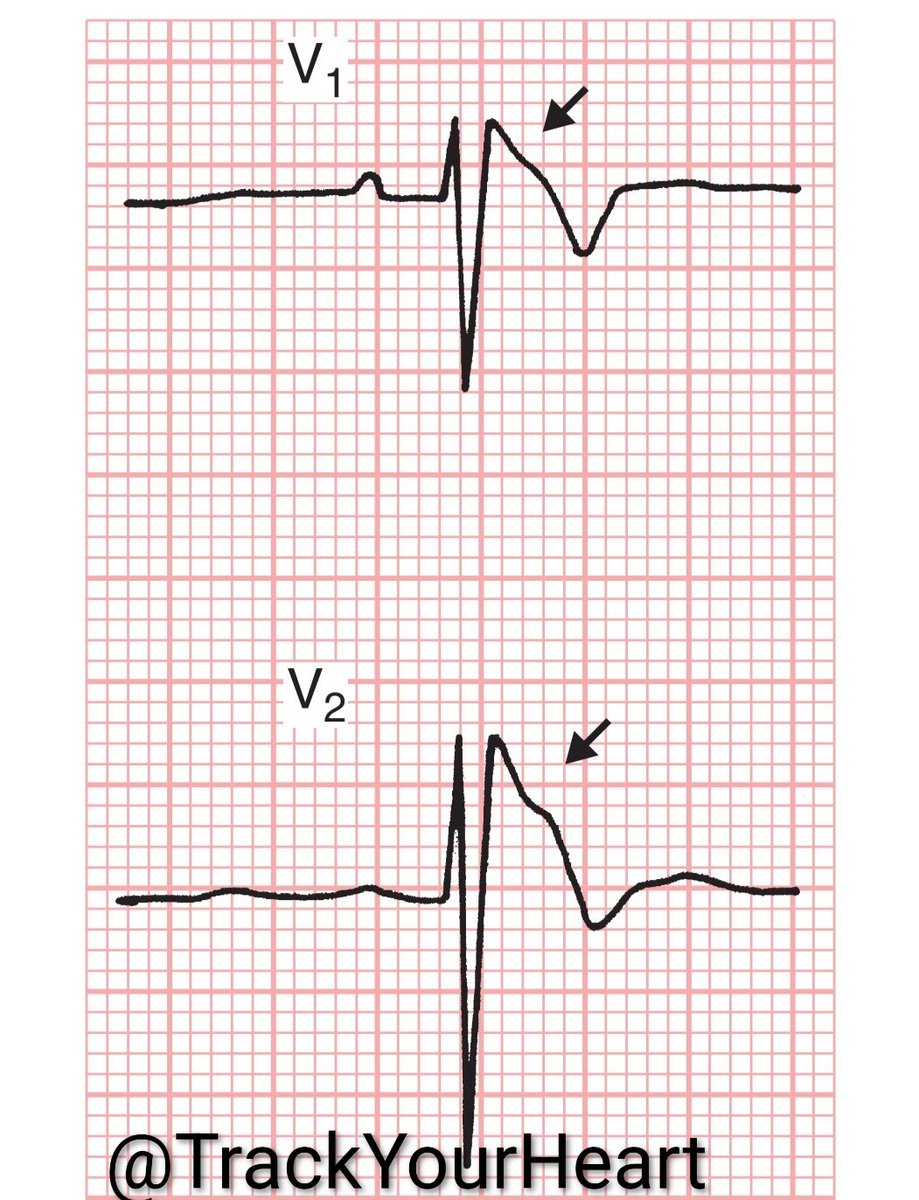
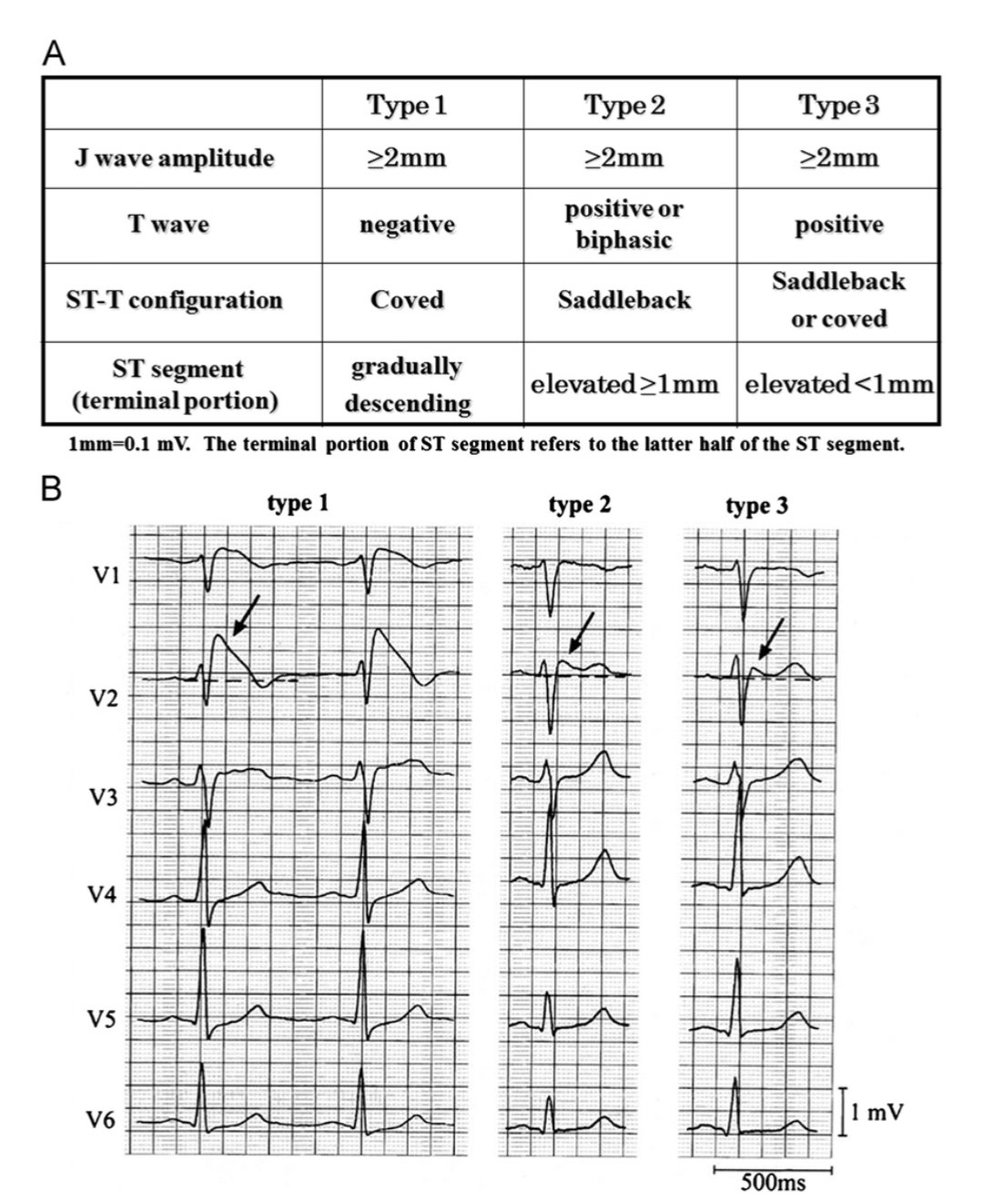
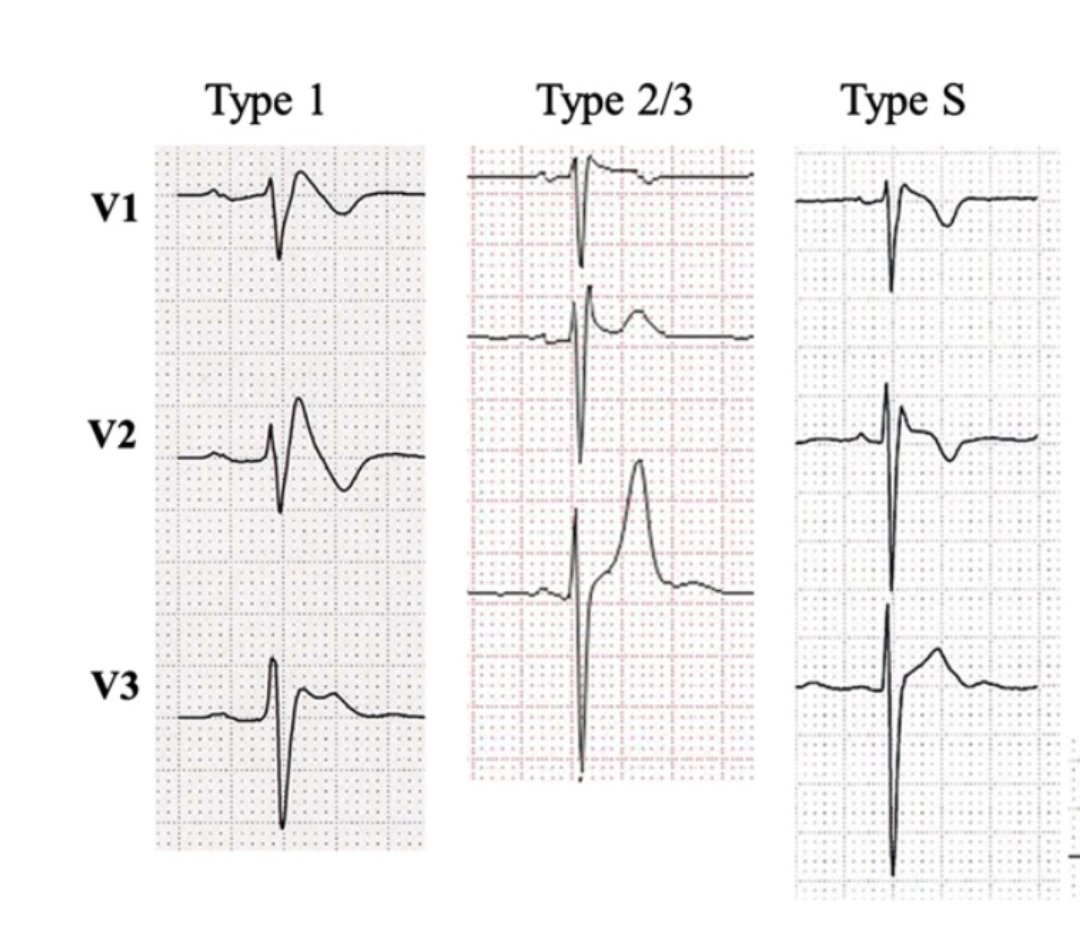
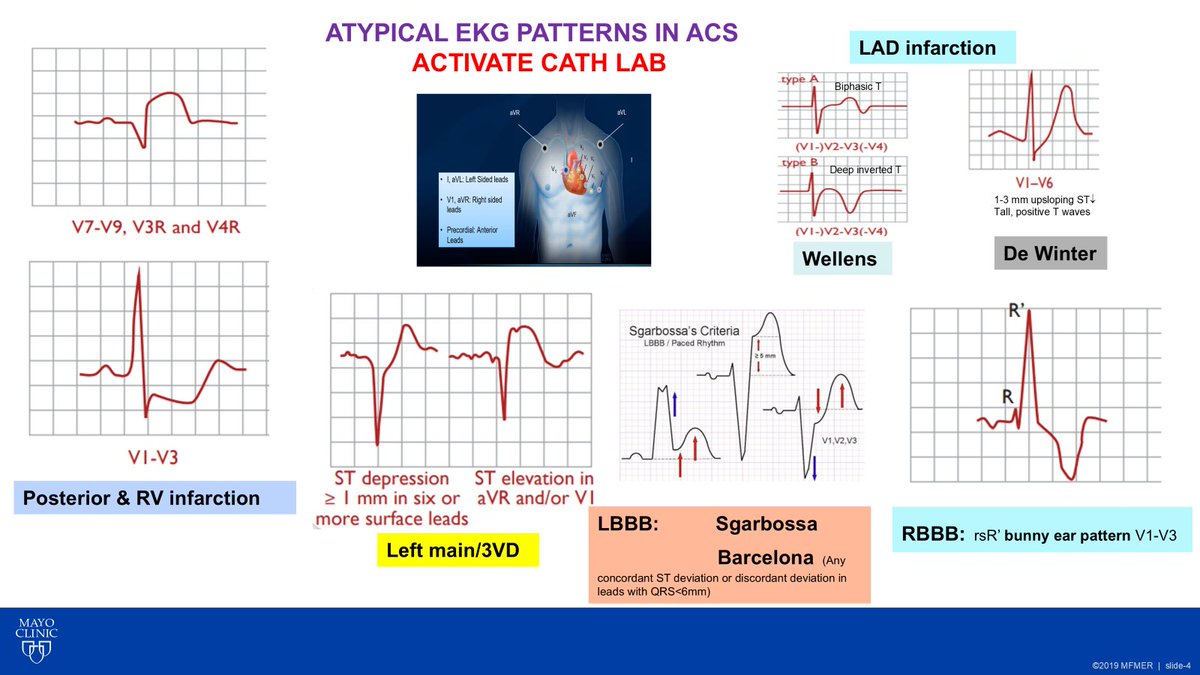
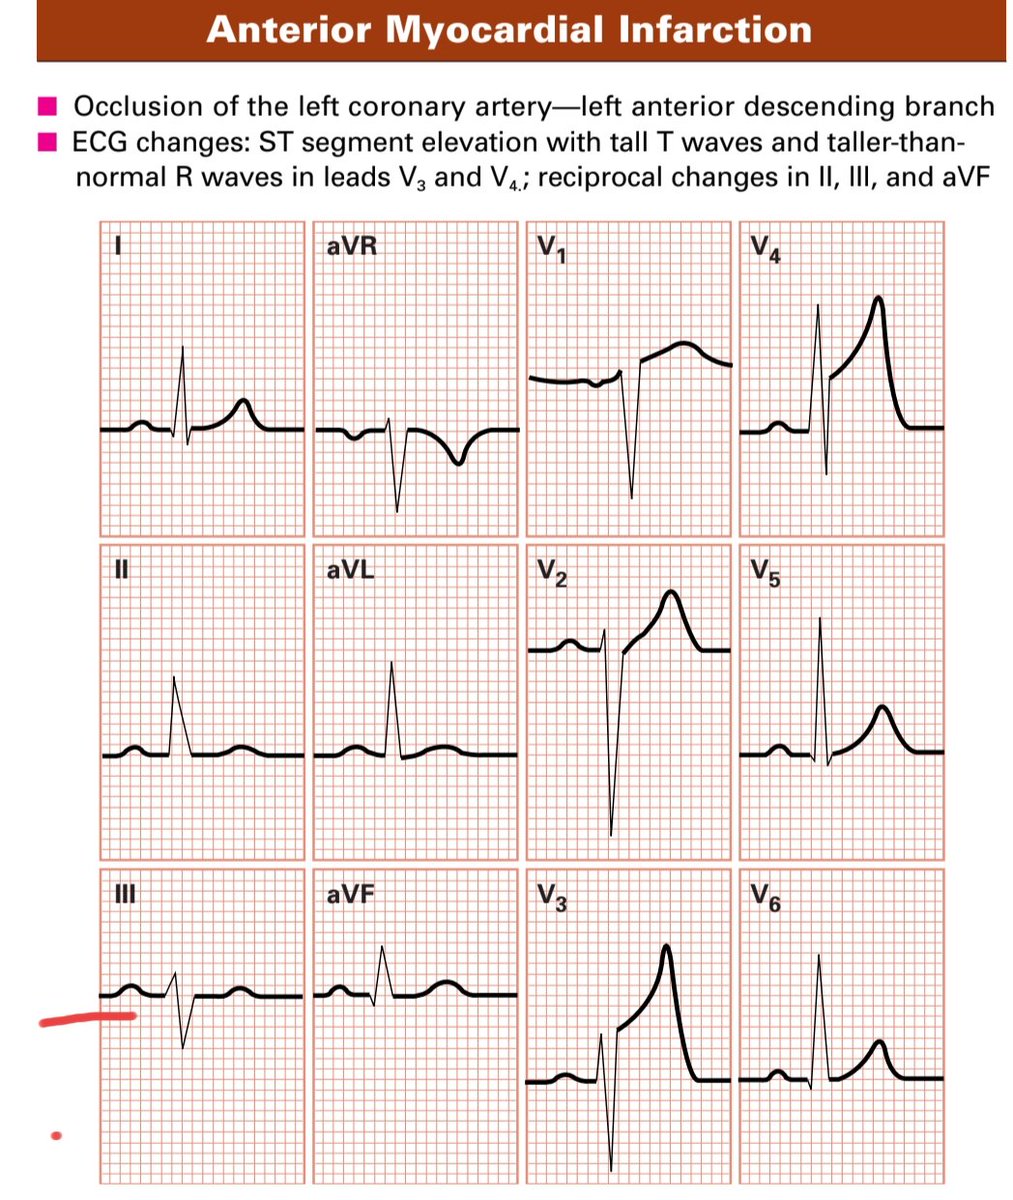
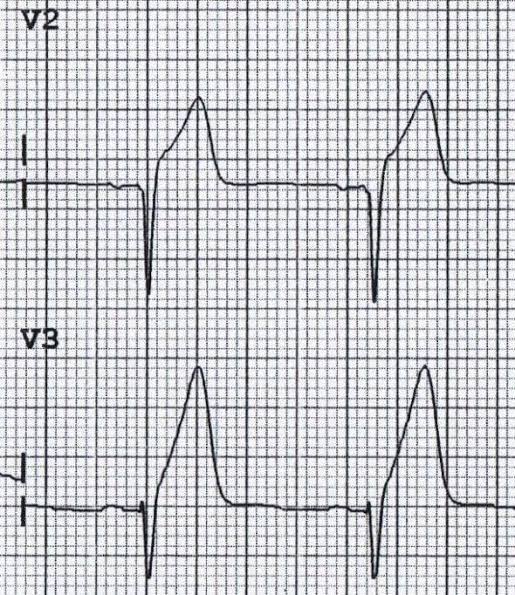
Step 7: ST Segment and T Waves
🔺ST elevation: Think STEMI, pericarditis, early repolarization, or ventricular aneurysm
🔻ST depression: Indicates subendocardial ischemia or reciprocal change
◾T wave inversion: Causes include ischemia, strain, Takotsubo, electrolyte disorders
🔺ST elevation: Think STEMI, pericarditis, early repolarization, or ventricular aneurysm
🔻ST depression: Indicates subendocardial ischemia or reciprocal change
◾T wave inversion: Causes include ischemia, strain, Takotsubo, electrolyte disorders
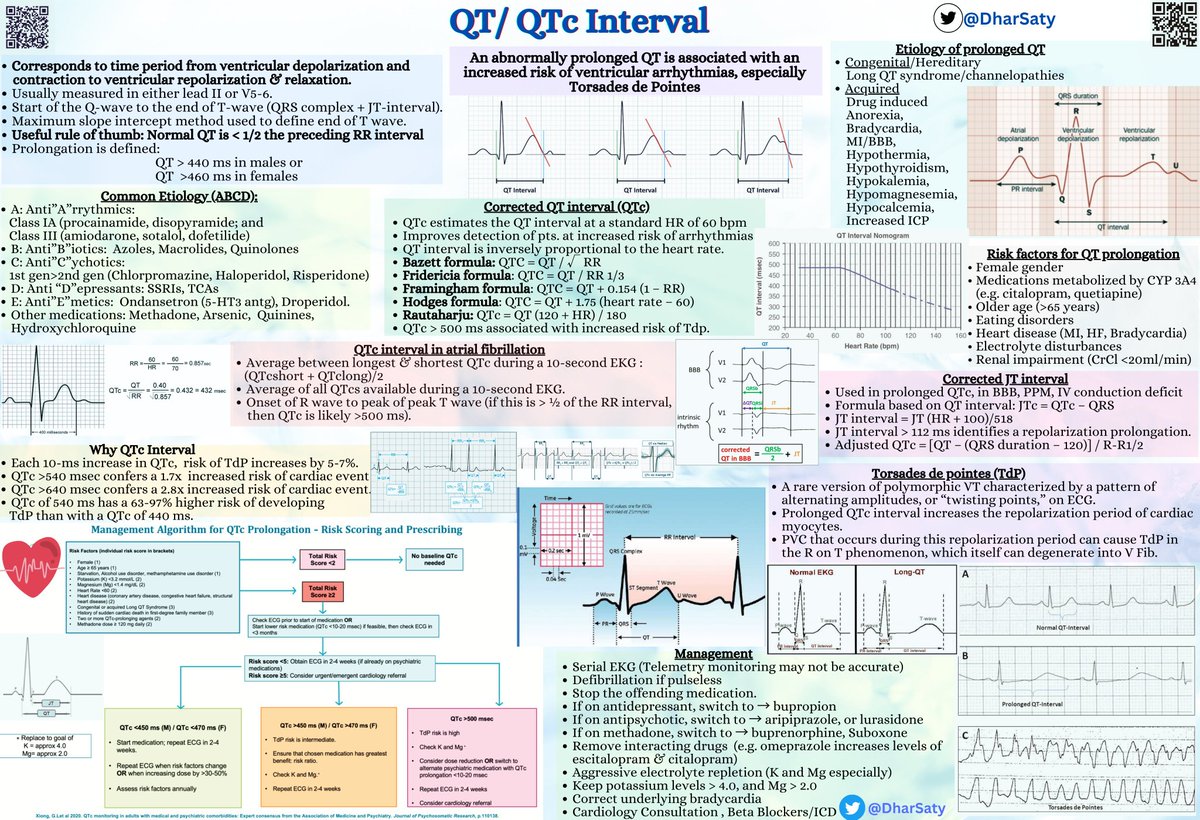
Step 8: QT Interval
How to measure:
🔸Use leads II, V5, or V6
🔸From beginning of Q wave to end of T wave (tangent method)
🔹Corrected QT (QTc) using Bazett’s formula: QTc = QT / √RR
Prolonged QTc:
🔹Men: >440 ms
🔹Women: >460 ms
Prolongation increases the risk of torsades
How to measure:
🔸Use leads II, V5, or V6
🔸From beginning of Q wave to end of T wave (tangent method)
🔹Corrected QT (QTc) using Bazett’s formula: QTc = QT / √RR
Prolonged QTc:
🔹Men: >440 ms
🔹Women: >460 ms
Prolongation increases the risk of torsades
Final Checklist for ECG Interpretation
1. Confirm paper speed and calibration
2. Determine heart rate
3. Assess rhythm
4. Examine P waves
5. Measure PR interval
6. Evaluate QRS duration
7. Determine QRS axis
8. Analyze ST segments and T wave
1. Confirm paper speed and calibration
2. Determine heart rate
3. Assess rhythm
4. Examine P waves
5. Measure PR interval
6. Evaluate QRS duration
7. Determine QRS axis
8. Analyze ST segments and T wave
Suggested References:
- ECG Step by Step by Garamendi & Lip
- Life in the Fast Lane (LITFL)
-
- Mayo Clinic ECG Curriculum
- Dr Smith's ECG blogspot.
Read it. Save it. Share it
Follow me at @TrackYourHeartECGwaves.com
- ECG Step by Step by Garamendi & Lip
- Life in the Fast Lane (LITFL)
-
- Mayo Clinic ECG Curriculum
- Dr Smith's ECG blogspot.
Read it. Save it. Share it
Follow me at @TrackYourHeartECGwaves.com
• • •
Missing some Tweet in this thread? You can try to
force a refresh