
Your guide to a healthy heart and body.
Evidence-based cardiology content..
Tweets are only for educational purposes.
 A 54-year-old woman was admitted with septic shock secondary to an intra-abdominal infection.
 2/ Main causes of AS:
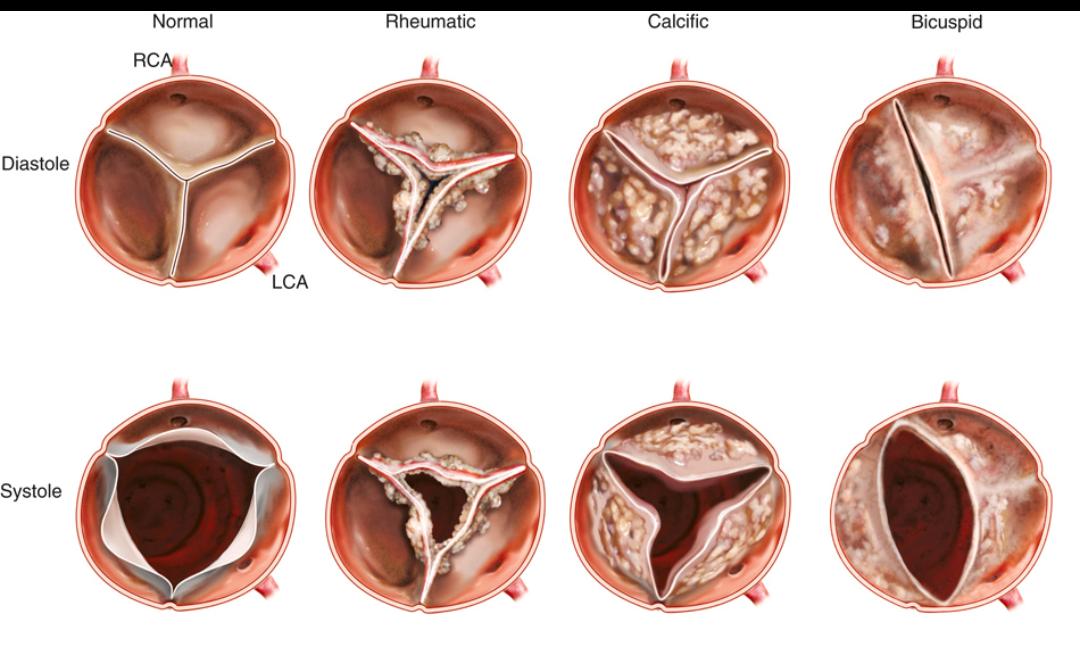
 1️⃣ When to Suspect RV Infarction?
 1/
1/
 Step 0: Initial Checks
 1/
1/ 1/
1/
 1️⃣ Start earlier.
 2/
2/
 1️⃣ Acute Coronary Occlusion (STEMI)
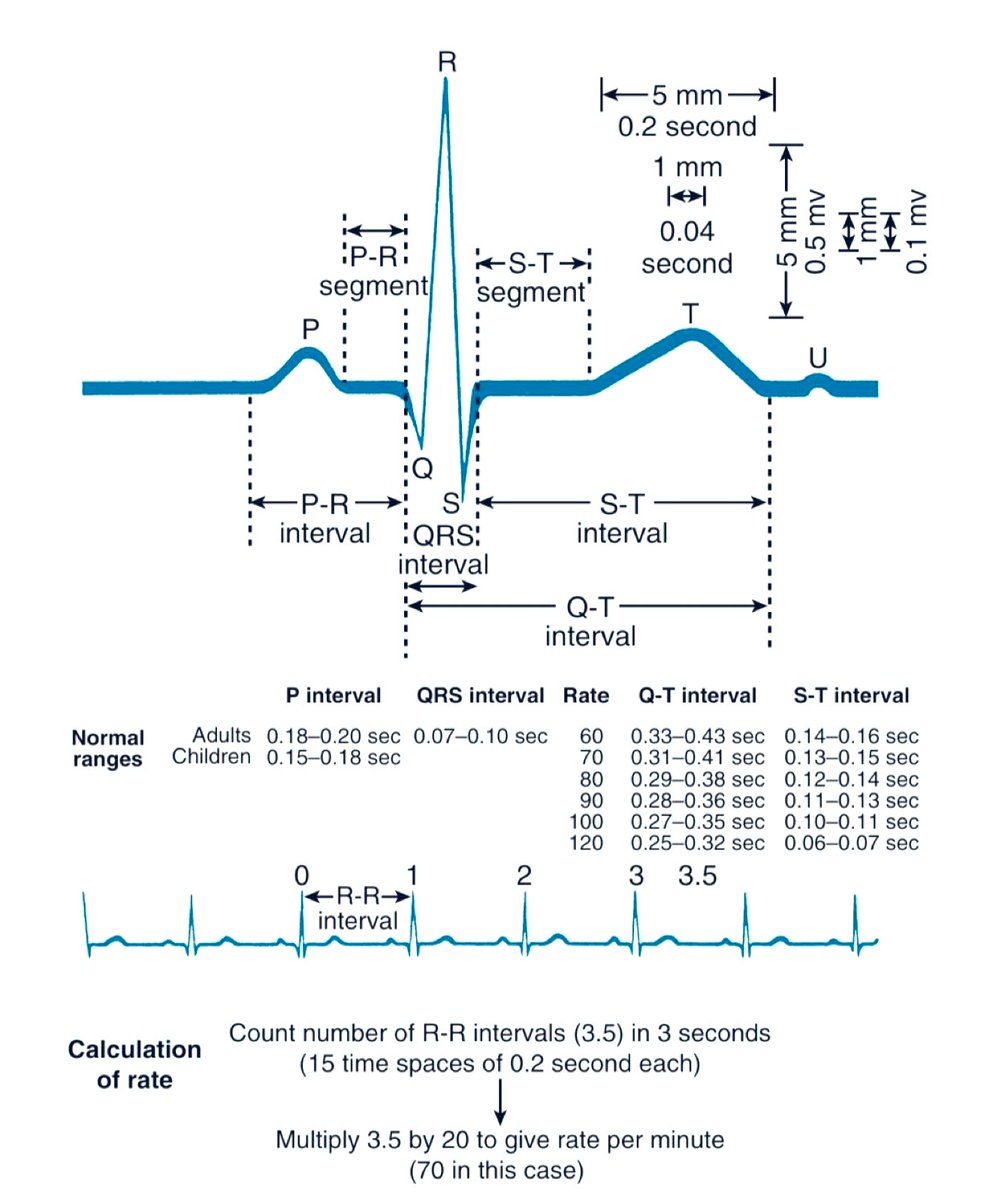
 1/ Holter Monitor
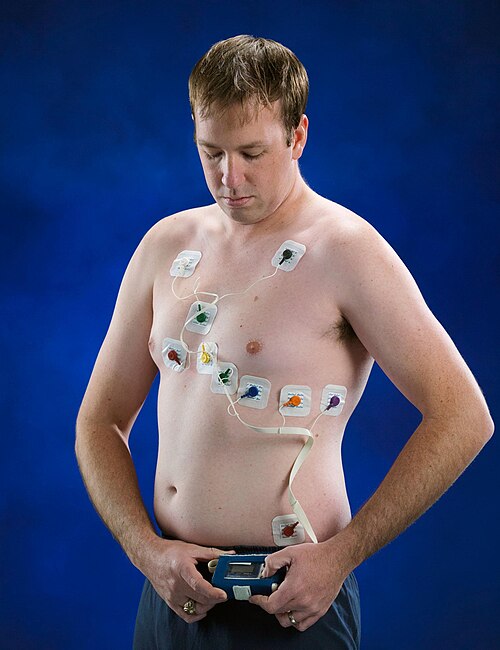
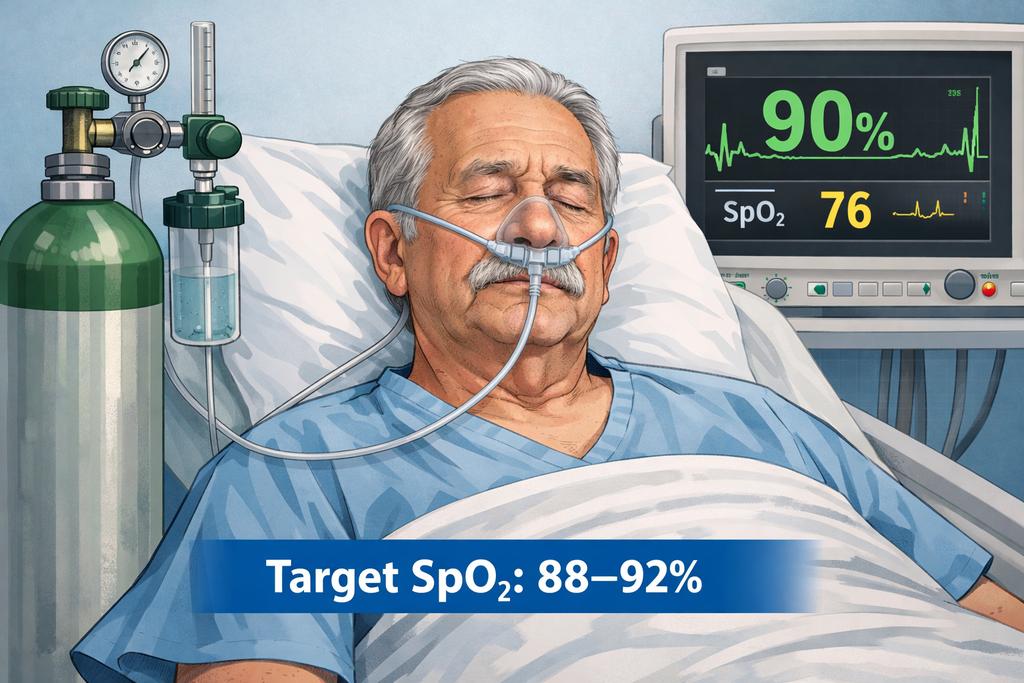 Oxygen does NOT usually cause dangerous hypercapnia by stopping breathing.
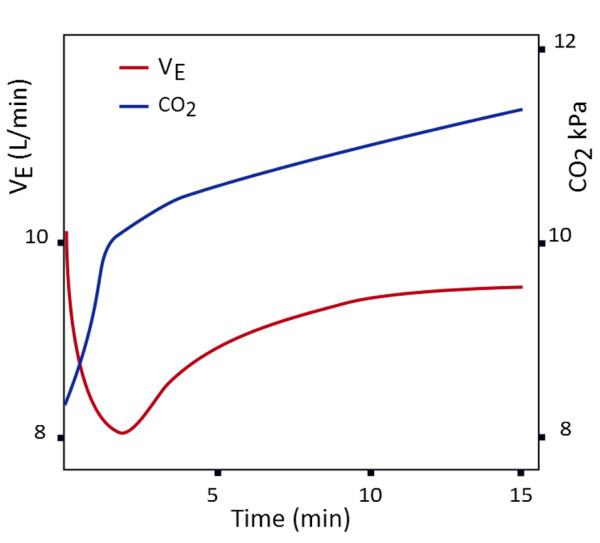
 1/
1/ Step 0: Initial Checks
 2/
2/
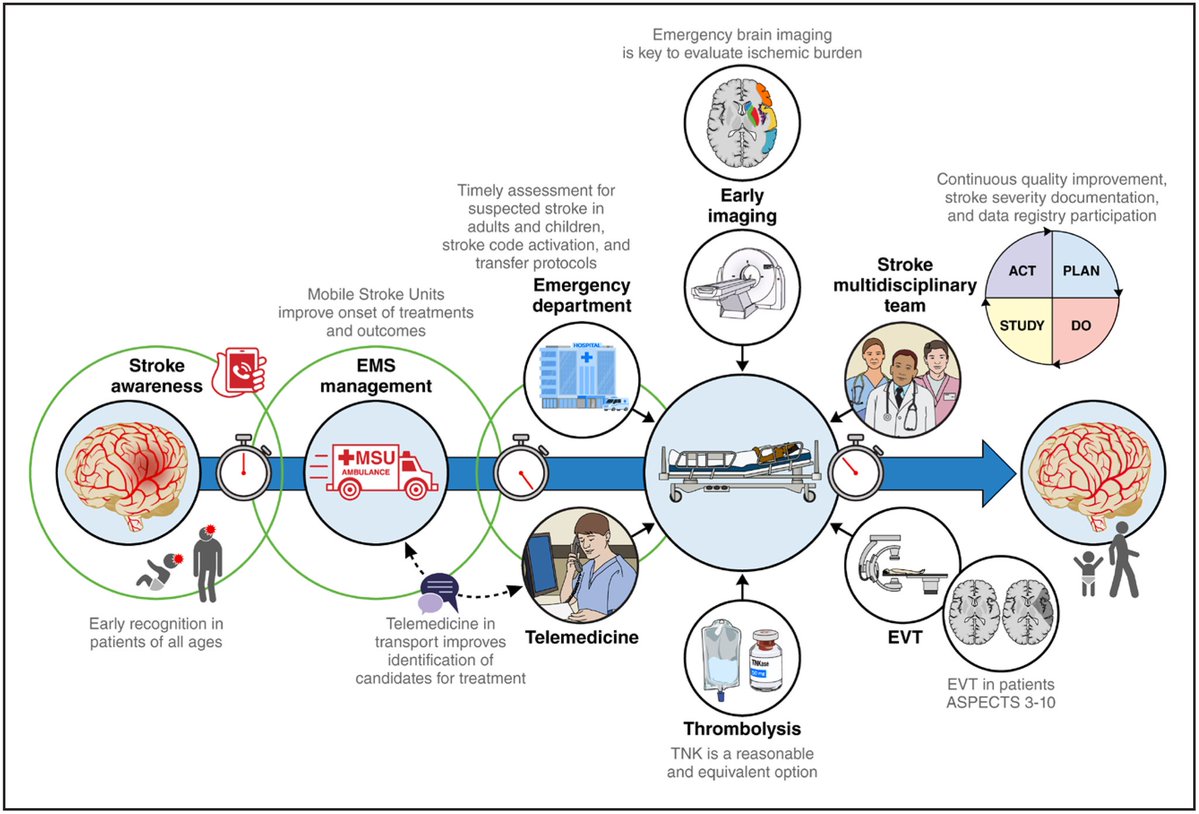 1️⃣ Mobile Stroke Units (MSUs)
 Oxygen does NOT usually cause dangerous hypercapnia by stopping breathing.
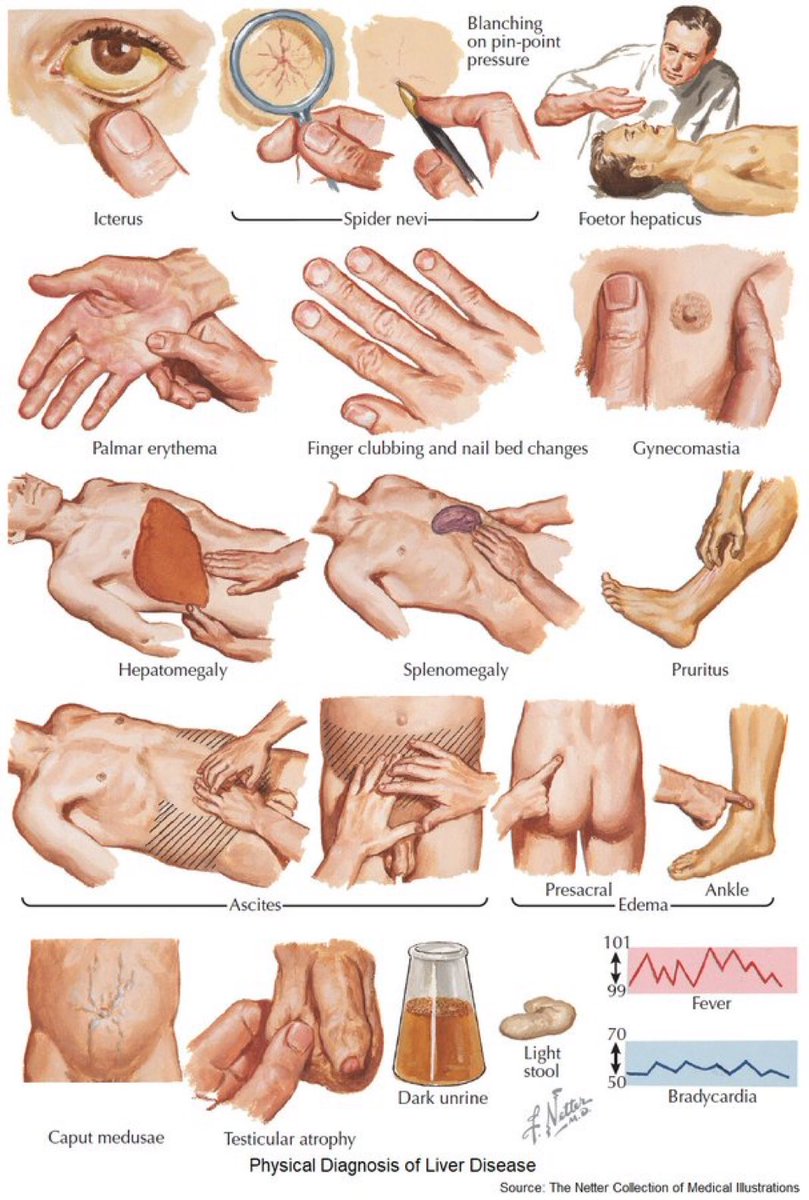 🔵Icterus
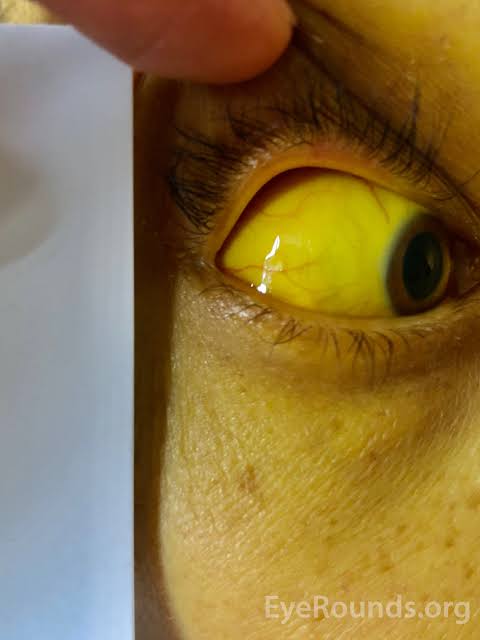
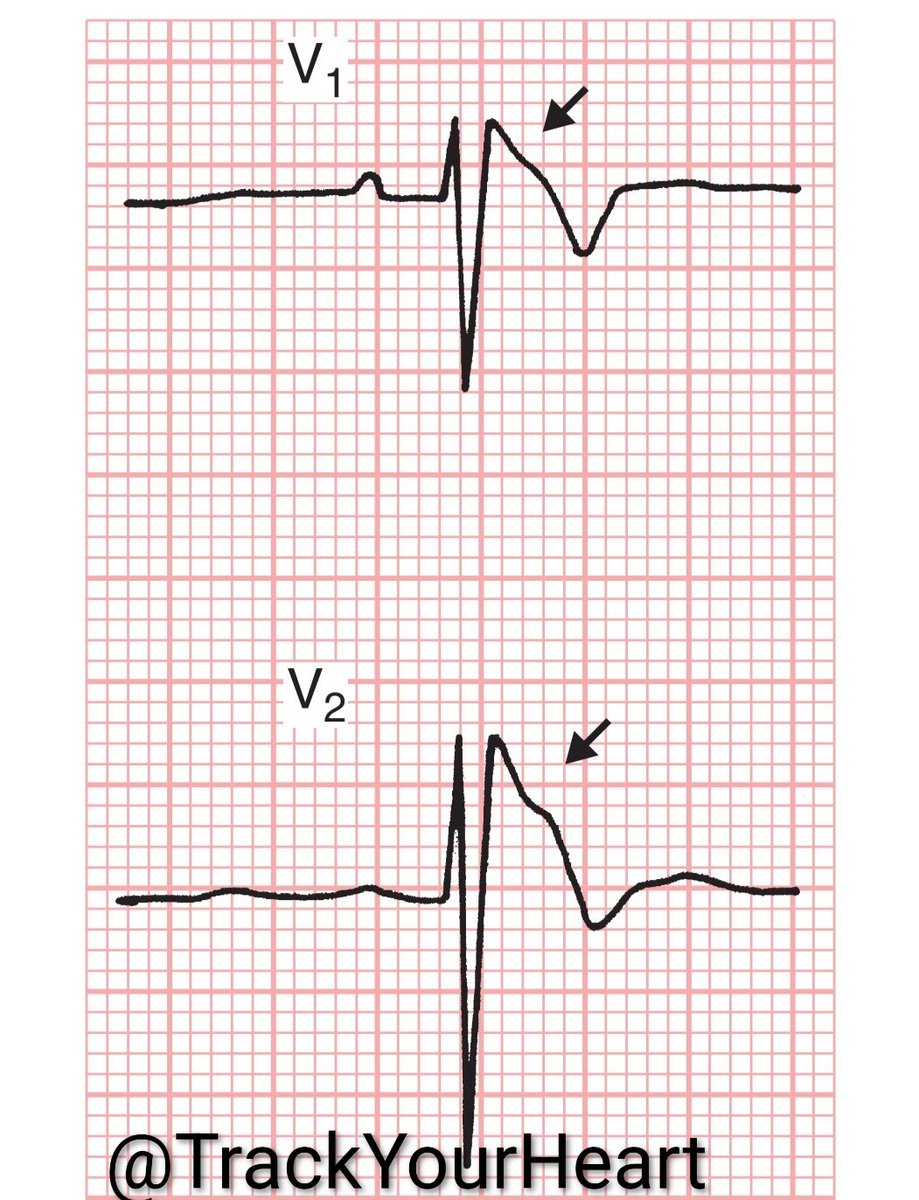
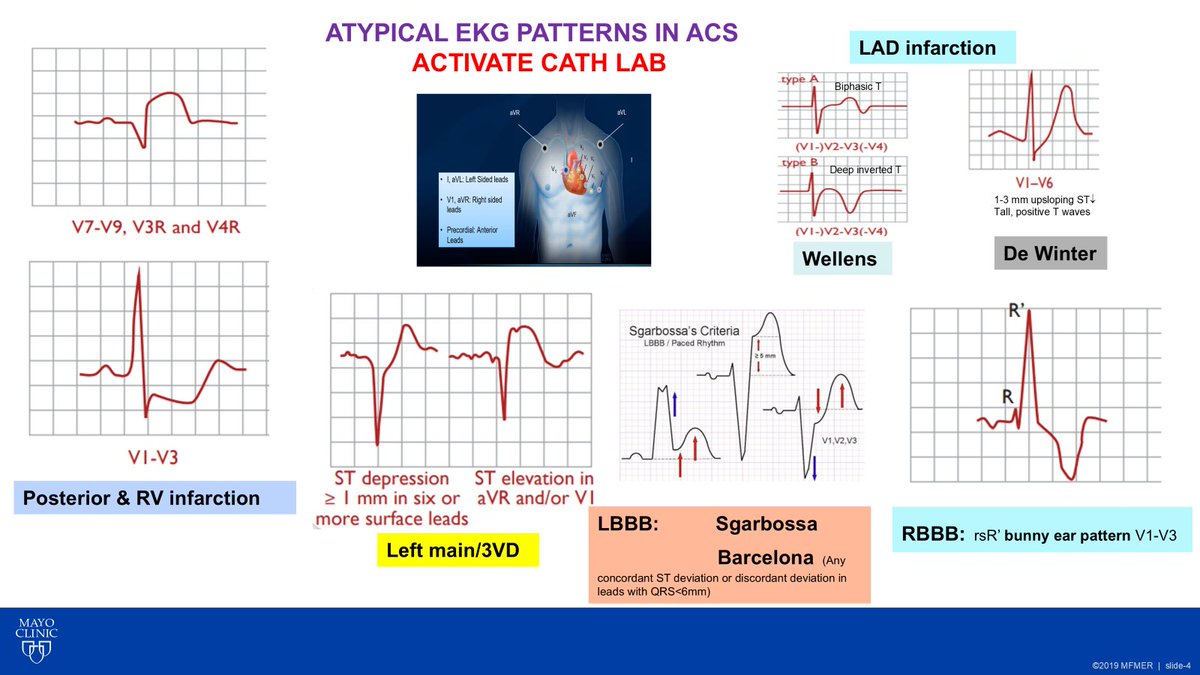 🔵 Posterior MI & Right Ventricular MI
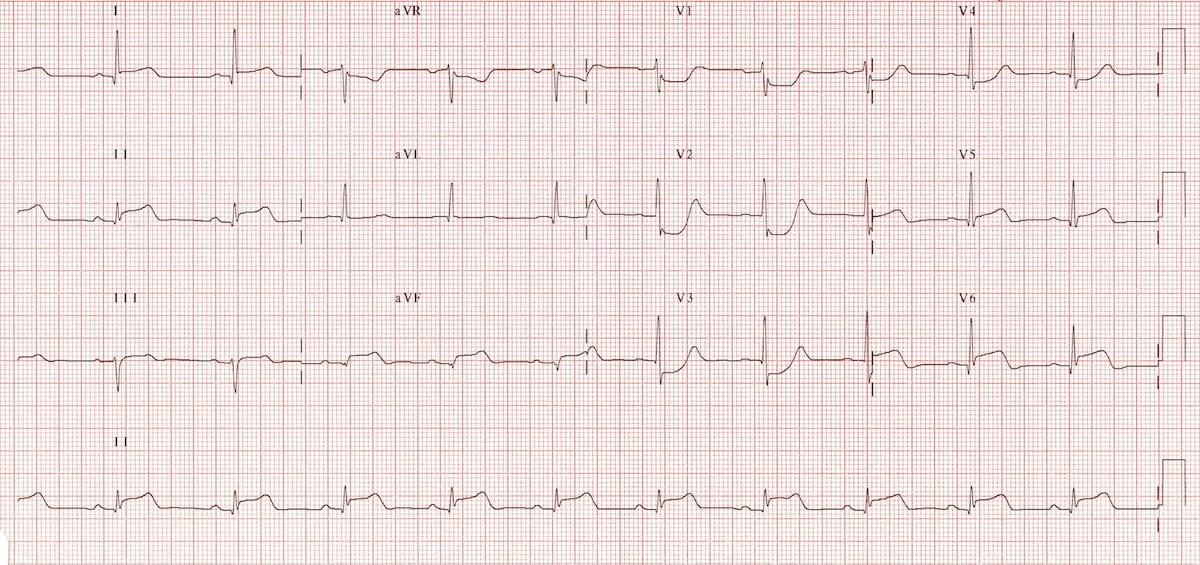

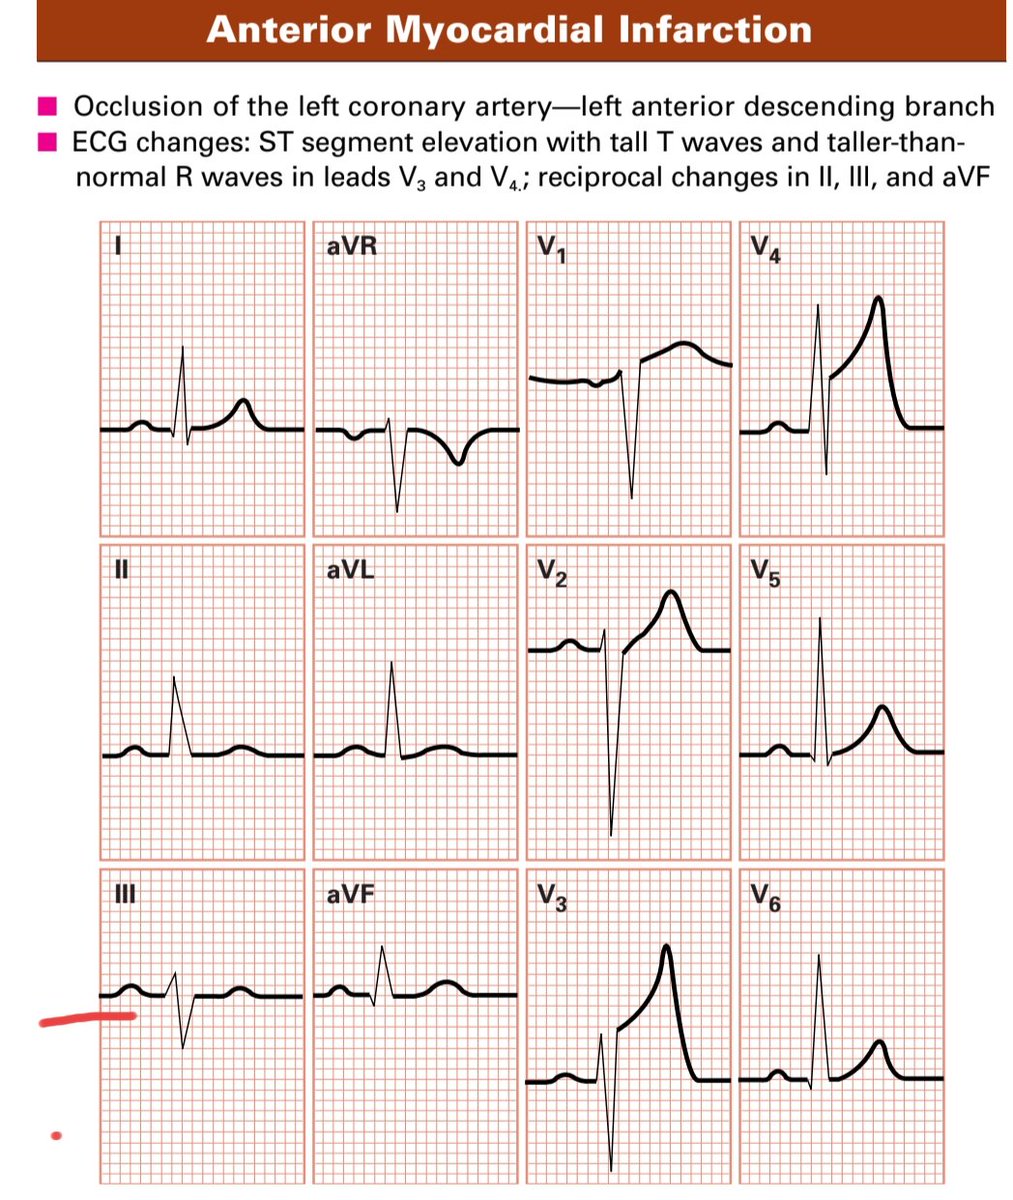
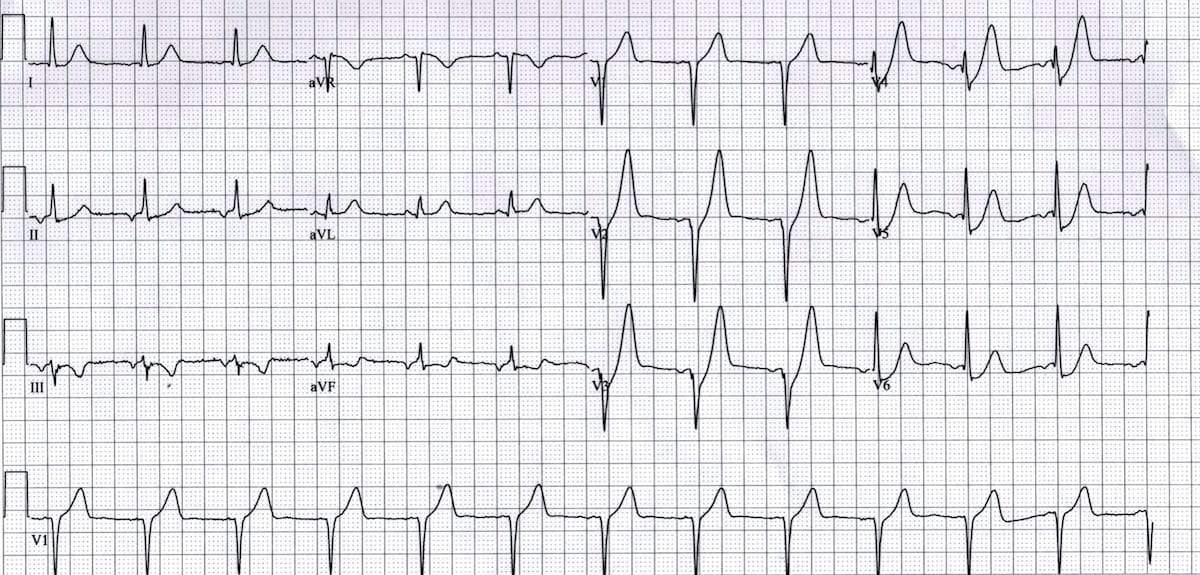
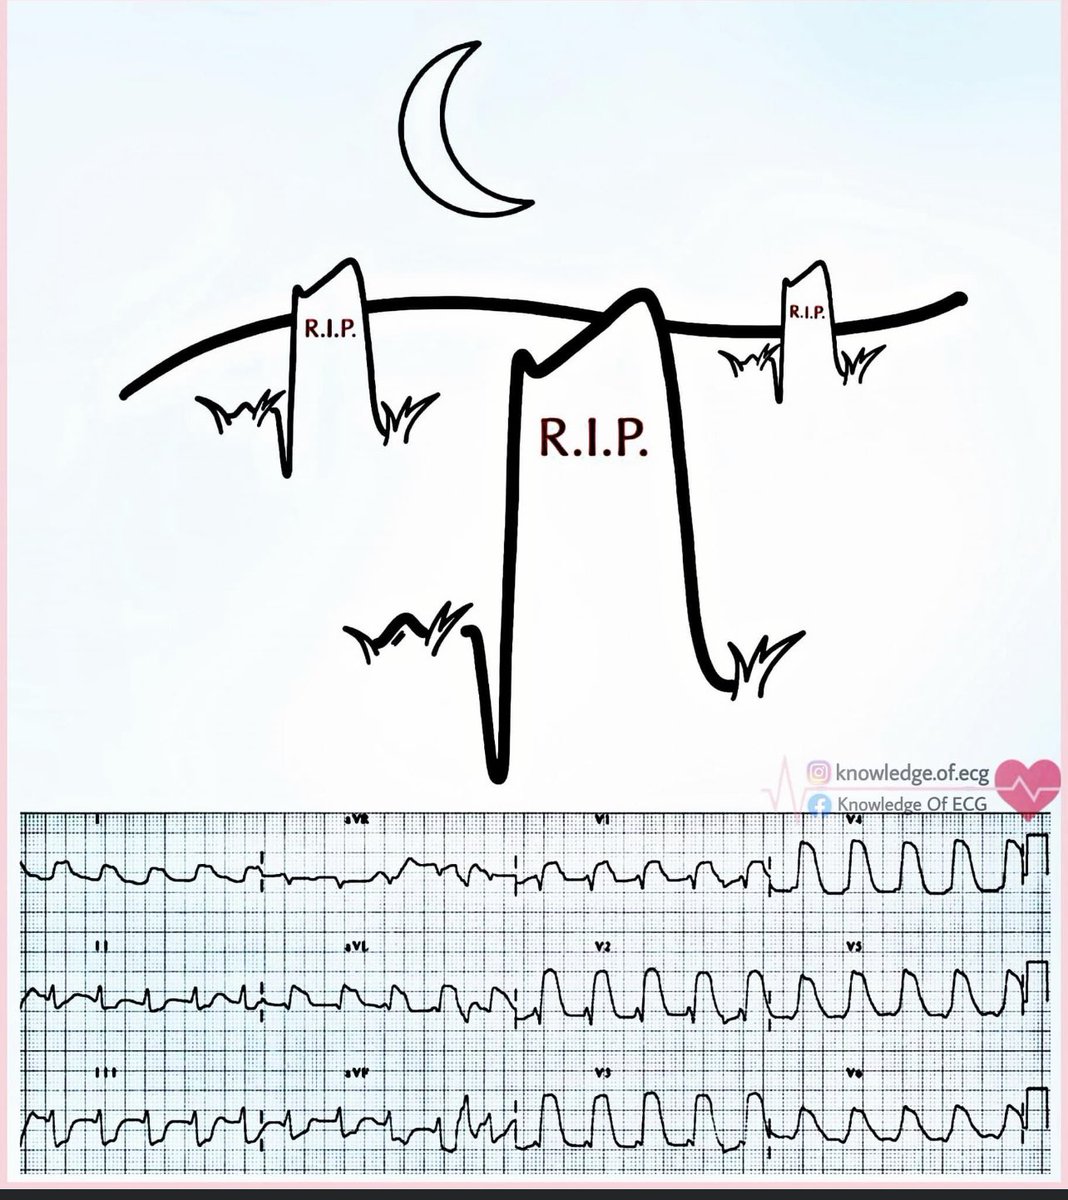 1️⃣ Acute Coronary Occlusion (STEMI)