Nick Gerli Profile picture
Mar 6 10 tweets 4 min read Read on X
Las Vegas apartment vacancies are spiking.

And landlords are not happy.

7.6% of Vegas apartments are now sitting vacant, the highest level in nearly 10 years.

(Triple the pandemic low of 2.4%).

4 years ago, rents were soaring, and there was no availability.

Now they're cutting rents aggressively and giving concessions just to get tenants through the door.

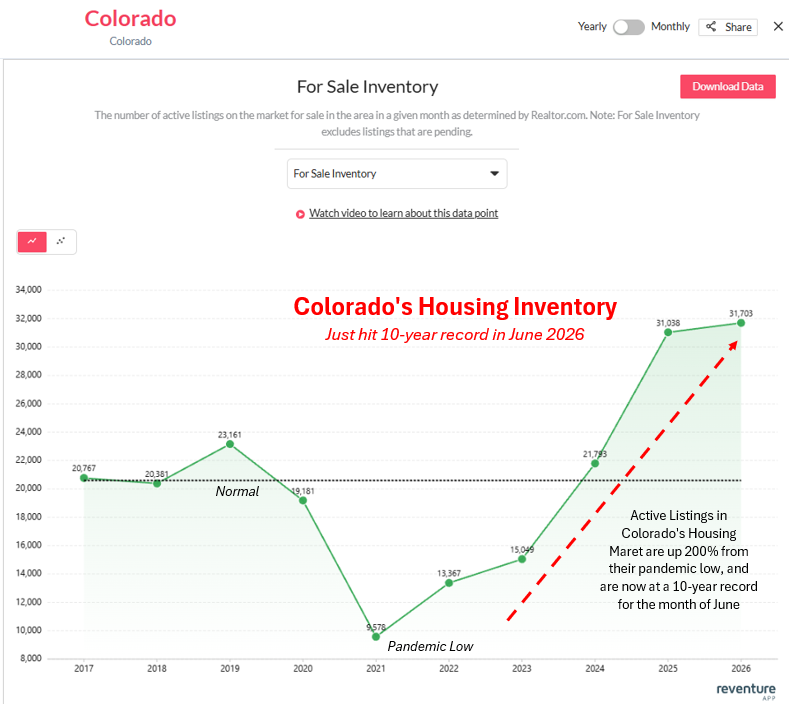
A potentially ominous sign for Vegas' overall housing market in 2026.Image
1) I like looking at a local area's rental market as an additional bellwether of where things are heading.

If vacancies are rising, and rents are getting cut, it's a suggestion that the broader housing market is oversupplied.

And that general housing deflation could be on the way (as if the case in Las Vegas).
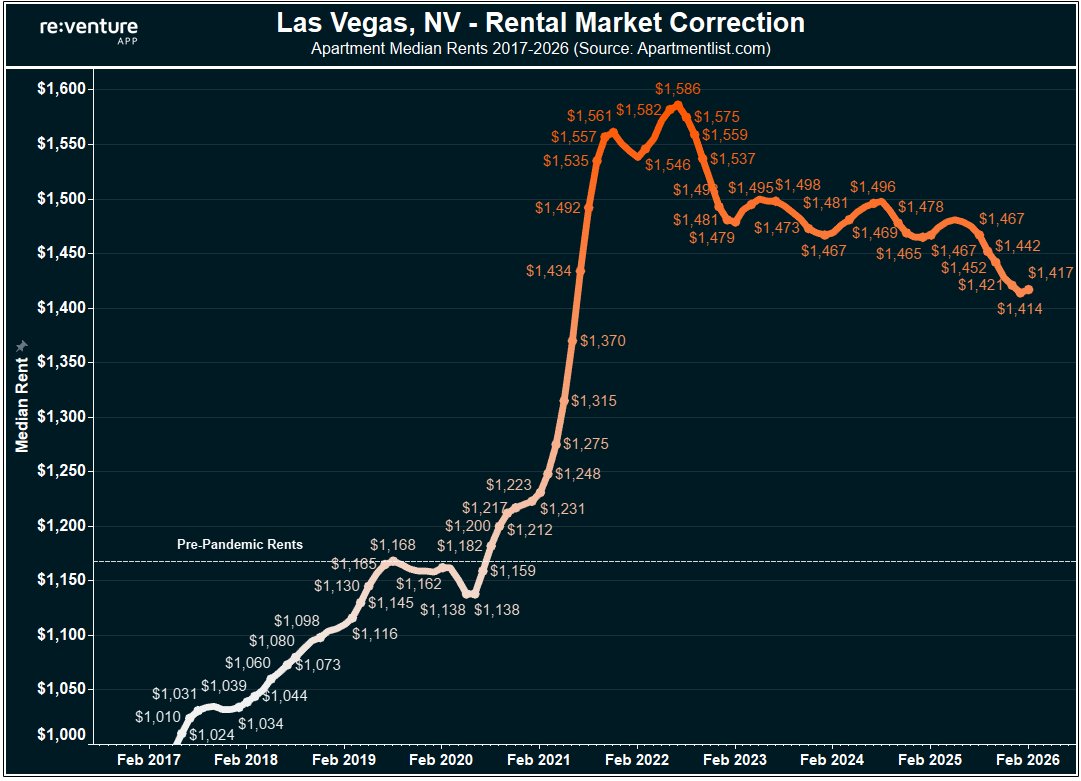
2) Data from Apartment List shows that apartment rents in Vegas are down about 10% from their post-pandemic peak in 2022.

Back then, they were at $1,586 per apartment.

Now they're at $1,417.

(note that this is still 21% above pre-pandemic rents) Image
3) In some communities, the cuts could be even steeper.

Here is an apartment community that has 1-month free.

On 600 SF studios at $725/month base rent.

($664 net of concession) Image
4) The reason why this is happening is multi-fold.

First, Las Vegas is experiencing a slowdown in net migration after the pandemic, both from domestic and international sources. This is crimping housing demand.

Second, the affordability metrics in Vegas became skewed after the pandemic, and many local renters, especially those on the lower end of the income spectrum, became priced out.

Third, the local economy in Las Vegas is starting to struggle. Job growth in the metro just went into negative YoY territory for only the 4th time in the last 35 years.
5) Nevada non-farm payrolls hit -0.6% YoY in December 2025, which is the first negative reading since the pandemic.

And only the 4th since 1992.

Indicating how robust Vegas' job growth usually is. Image
6) But no longer. Slower job growth, due to reduced tourist demand and potentially lower immigration, is weighing the rental market.

At the same time, there's been a marked slowdown in migration from other U.S. states, which is causing a reduction in home sales and buyer demand.

In fact - demand to buy houses in Vegas in Jan 2026 was 43% below the pandemic peak.Image
7) Home values are now also officially dropping in Vegas' housing market. They're down -2.2% YoY.

But still up 35.8% over the last five years.
8) The value drops are getting especially intense in certain ZIP codes.

Some areas are down over 6% in the last year, according to Zillow's value index, which is a big drop for just one year. Image
9) To see our forecasts on the Vegas housing market, and to arm yourself with the right data before making a big purchase in 2026, head to and upgrade to a premium plan.

Forecasts are available for nearly every ZIP code in the U.S., and are updated monthly based on the underlying data in each market.reventure.app/mobile

• • •

Missing some Tweet in this thread? You can try to force a refresh
 

Keep Current with Nick Gerli

Nick Gerli Profile picture

Stay in touch and get notified when new unrolls are available from this author!

Read all threads

This Thread may be Removed Anytime!

PDF

Twitter may remove this content at anytime! Save it as PDF for later use!

Try unrolling a thread yourself!

how to unroll video
  1. Follow @ThreadReaderApp to mention us!

  2. From a Twitter thread mention us with a keyword "unroll"
@threadreaderapp unroll

Practice here first or read more on our help page!

More from @nickgerli1

May 20
Lots of people are speculating about what the higher yields and upward inflation pressure means for real estate.

The answer will come down to wage growth.

In a true "inflationary" scenario, wage growth will take off alongside inflation, and there will be asset-level appreciation across real estate as a result.

However, in a transitory inflation scenario, wage growth does not take off with inflation, and the higher yields and inflation spike eventually dissipate.

And could even lead to deflation after the fact.

Right now, wage growth is not showing any real signs of moving upward, which makes this look different than the 2021/22 inflation spike, as well as the one that occurred in the 1970s.

My gut instinct is that the higher yields and inflation spike will hit a ceiling with wage growth and will come back down.

Simply put, there isn't much "room" for consumers to absorb the higher costs.Image
1) And this is very important to understand for the housing market, because in real estate, there are only two types of inflation that actually matter:

-wage inflation
-rent inflation

These two types of inflation feed directly into home prices.
2) Wage inflation directly increases a homebuyer's capacity to afford higher prices and mortgage payments, while rent inflation increases an investor's capacity to afford high prices and mortgage payments.

Moreover, higher rents are a big incentive for renters to jump into the market and buy.
Read 15 tweets
May 10
Seattle's housing market is going through a historic inventory shock.

There are now 8,630 listings across the Seattle metro as of Apr 2026.

In a normal April, there are only 4,600 listings.

Meaning inventory today is 88% above normal.

This is happening due to layoffs, a historic lack of affordability, and increased outbound migration.

Ultimately, good news for local Seattle buyers. For the first time in a decade, you have control over this market.

Expect prices to fall in the next year, potentially by a lot in certain ZIP codes.

Access the data on mobile: reventure.app/mobileImage
1) While Seattle's days on market and months of supply are still tighter than most other markets, what matters most here is how Seattle's market is trending compared to its own history.

And as a result of this inventory spike, values are already dropping.

Down -1.7% YoY.
2) The biggest decline is in King County, where values have dropped -2.5% in the last year. Image
Read 7 tweets
May 4
Some crazy stuff is going on in Nashville's housing market.

Opendoor, America's largest homebuyer, just purchased this house for $462K in March.

But then immediately relisted and cut the price to $430k.

a $32,000 loss on price in a matter of weeks.

On top of that, the appraised value for this house is $548,000.

Meaning today's list price is 22% below 2025 appraisal.

Suggesting major downward pressure on values in Nashville.

(that, or both Opendoor and the Nashville tax appraiser don't know what they're doing).Image
1) Opendoor's models can sometimes produce strange results, however I've never seen them take a $32,000 loss in a month.

Even down in Florida last year, when things were very crazy in terms of declining prices, I never witnessed anything like this.
2) On top of this, the Nashville tax appraiser seems like they might have dramatically overestimated the true value on some properties with the 2025 assessment.

A $548,000 appraised value for a house listed at $430,000 a year later is disastrous.

(/ a signal of declining values overall)Image
Read 7 tweets
Apr 15
Mortgage applications to buy a house fell again.

They're back down to an index level of 159, which is more than 50% below the pandemic peak in early 2021.

Not only that - they're now declining year-over-year, reversing a slight positive trend that began taking place in early 2025.

The figures are so bad that Mortgage Apps are now nearly 40% below pre-pandemic levels.

As a result, I wouldn't be surprised if April & May have the lowest sales figures we've ever seen for those months (excl the initial pandemic lockdowns).

Sellers must adapt and understand that if they don't cut the price now, their house will sit. For a long time.

To see the areas with the biggest price cuts, download Reventure and search your city: reventure.app/mobileImage
1) This Mortgage Application Purchase data, sourced from the MBA (Mortgage Bankers Association), is a real-time indicator of buyer demand.

It updates every week, and suggests where closed sales could be heading in the next several months.

A slowdown today, along with continued weakness, suggests a rough spring selling season ahead.
2) I wouldn't be surprised if we say April and May existing sales did hit the lowest levels on record for those months, and the first half of 2026 to have the lowest levels ever for the first six months of the year.

This is simply where we're at now in the housing market.

Prices remain too high, sellers too stubborn, and buyers with the most inertia they've had in U.S. history.
Read 11 tweets
Apr 14
The U.S. Housing Market is in a full-fledged depression.

Existing sales in March just hit their 2nd lowest level ever for the month, behind only 2009.

Not only that - sales volumes are down 25% from pre-pandemic norms and continue to drop YoY.

Why is this happening? Simple: sky-high prices.

Even though values are starting to drop in many markets, overall price levels remain disconnected from what buyers can pay.

So they're not buying. A concerning signal for the Spring/Summer housing market. Sellers better get ready to cut the price.

To track sales for your city, download Reventure and hit Home Sales Surplus/Deficit: reventure.app/mobileImage
1) A lot of people seem to think the housing market is "doing just fine".

But that couldn't be further from the truth.

We've never seen sales activity this low, for this extended period a time.

It's even worse than the demand in the post-2008 crash.
2) You can see that sales, relative to homeowners, are actually well below the post-2008 levels.

In the current environment, only 4.5% of homeowners are selling their homes.

Back in 2008, it was 5.4%.

Good is like 7.0%.

Showing you just how poor today's demand environment is.Image
Read 12 tweets
Apr 3
The housing market has split into two.

In South and West states, the housing shortage is over. (inventory up to 741k listings as of March 2026, above 2019 levels).

Prices are dropping and buyers have leverage in TX, FL, GA, TN, CO, AZ, and WA.

But in the Northeast/Midwest, it's a different story.

Inventory has plummeted 45%, and there are only 215k listings compared to 381k pre-pandemic.

Meaning there's still a shortage (and even bidding wars).

To understand the dynamics in your market, search at reventure.app/mobile.Image
1) I still people floating around this idea of a "national housing shortage", and that couldn't be further from the truth at this point.

In the South and West, the shortage is over.

Southern inventory is up 2% from March 2019 levels, West is flat.

While sales in these markets are down significantly.Image
2) There's a genuine housing correction playing out in these states, while in the Northeast/Midwest it's a different story.

Midwest listings, according to 's data, are down 35% from pre-pandemic norms.

Meanwhile, Northeast listings are down 53%.

Good luck trying to buy a house in New Jersey or Connecticut right now.Realtor.com
Read 9 tweets

Did Thread Reader help you today?

Support us! We are indie developers!


This site is made by just two indie developers on a laptop doing marketing, support and development! Read more about the story.

Become a Premium Member ($3/month or $30/year) and get exclusive features!

Become Premium

Don't want to be a Premium member but still want to support us?

Make a small donation by buying us coffee ($5) or help with server cost ($10)

Donate via Paypal

Or Donate anonymously using crypto!

Ethereum

0xfe58350B80634f60Fa6Dc149a72b4DFbc17D341E copy

Bitcoin

3ATGMxNzCUFzxpMCHL5sWSt4DVtS8UqXpi copy

Thank you for your support!

Follow Us!

:(