Palpitations, syncope, unexplained arrhythmias: which cardiac monitor should you choose?
A short guide to the most commonly used ambulatory ECG monitoring devices and when to use them. 🧵
A short guide to the most commonly used ambulatory ECG monitoring devices and when to use them. 🧵

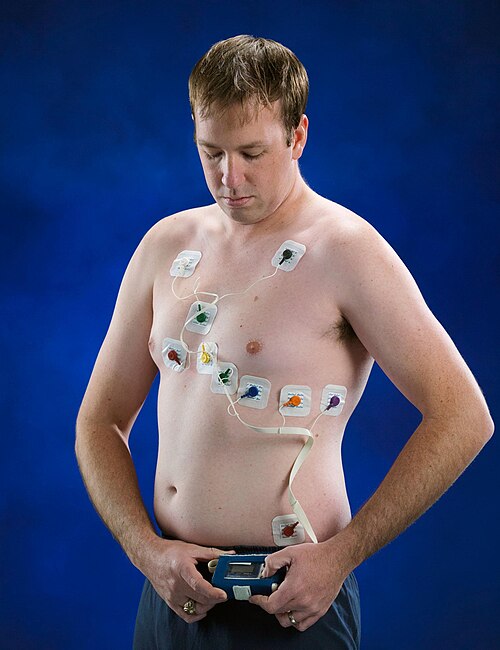
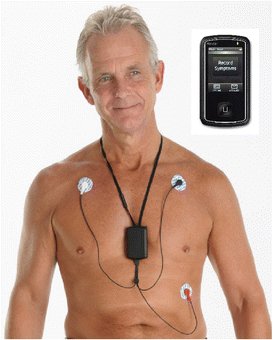
1/ Holter Monitor
A portable ECG device that records continuously for 24–72 hours (up to ~2 weeks in newer models).
Patients can mark symptoms using an event button or diary to correlate symptoms with rhythm.
Best for frequent symptoms expected to occur within a few days.
A portable ECG device that records continuously for 24–72 hours (up to ~2 weeks in newer models).
Patients can mark symptoms using an event button or diary to correlate symptoms with rhythm.
Best for frequent symptoms expected to occur within a few days.
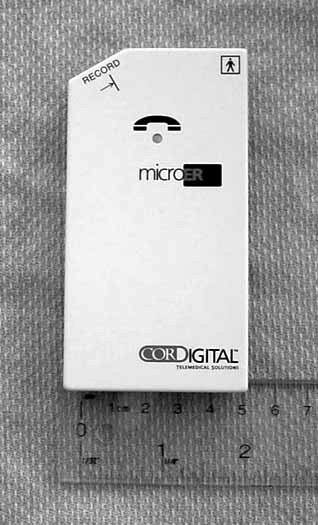
2/ Event Monitor
Records ECG only when the pt activates it during Sx and sends the recording to a monitoring center via telephone.
Useful when Sx occur intermittently within 2–6 weeks.
Limitation: not ideal for sudden syncope, since the pts may not be able to activate the device.
Records ECG only when the pt activates it during Sx and sends the recording to a monitoring center via telephone.
Useful when Sx occur intermittently within 2–6 weeks.
Limitation: not ideal for sudden syncope, since the pts may not be able to activate the device.
3/ External Loop Recorder
Continuously records ECG for wks to months, storing rhythm before, during, and after an event.
Can be patient-triggered or automatically triggered for asymptomatic arrhythmias.
Often used when syncope or palpitations occur sporadically within several wks
Continuously records ECG for wks to months, storing rhythm before, during, and after an event.
Can be patient-triggered or automatically triggered for asymptomatic arrhythmias.
Often used when syncope or palpitations occur sporadically within several wks
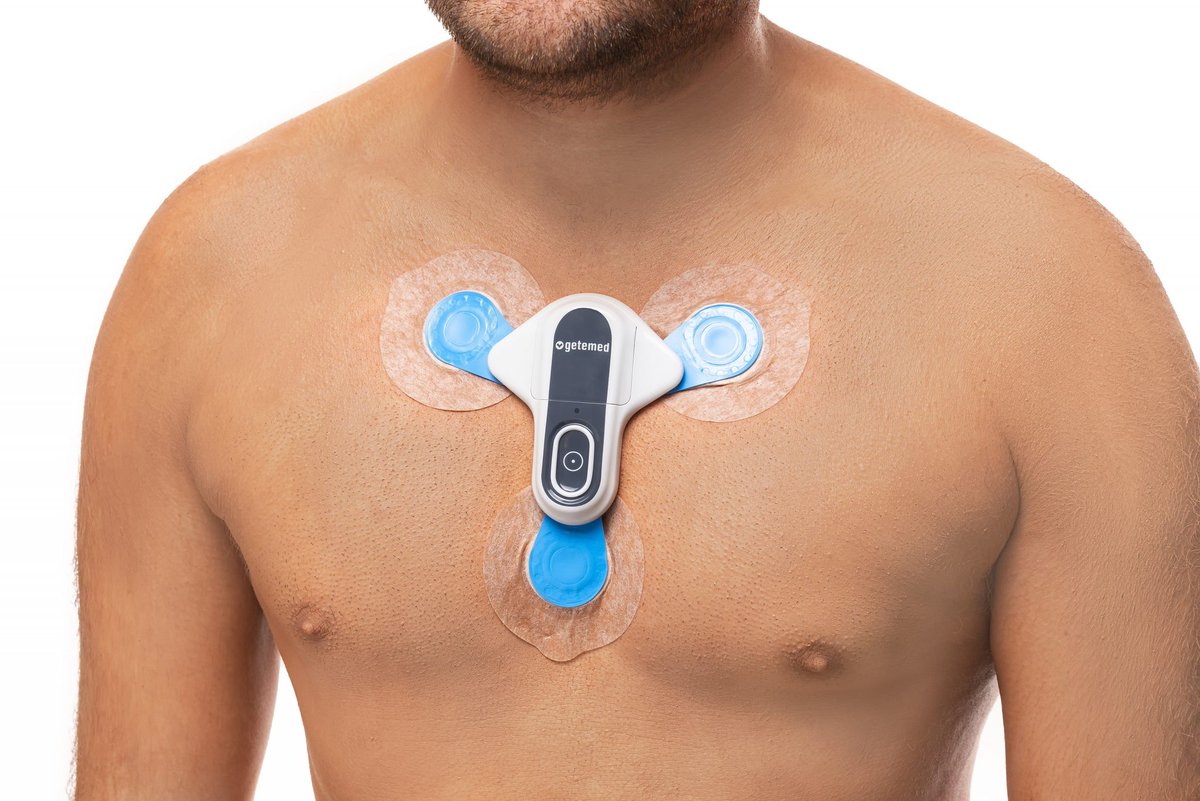
4/ External Patch Recorder
A leadless adhesive patch placed on the chest.
🟢 Records continuously for 2–14 days
🟢 Comfortable and water resistant
🟢 Allows patient activation and automatic arrhythmia detection
Commonly used to evaluate AFib burden.
A leadless adhesive patch placed on the chest.
🟢 Records continuously for 2–14 days
🟢 Comfortable and water resistant
🟢 Allows patient activation and automatic arrhythmia detection
Commonly used to evaluate AFib burden.
5/ Mobile Cardiac Outpatient Telemetry
A system that continuously records and transmits ECG data for up to 30 days.
When significant arrhythmias occur, the ECG is automatically sent to a 24/7 monitoring center.
Provides near real-time alerts to clinicians.
A system that continuously records and transmits ECG data for up to 30 days.
When significant arrhythmias occur, the ECG is automatically sent to a 24/7 monitoring center.
Provides near real-time alerts to clinicians.
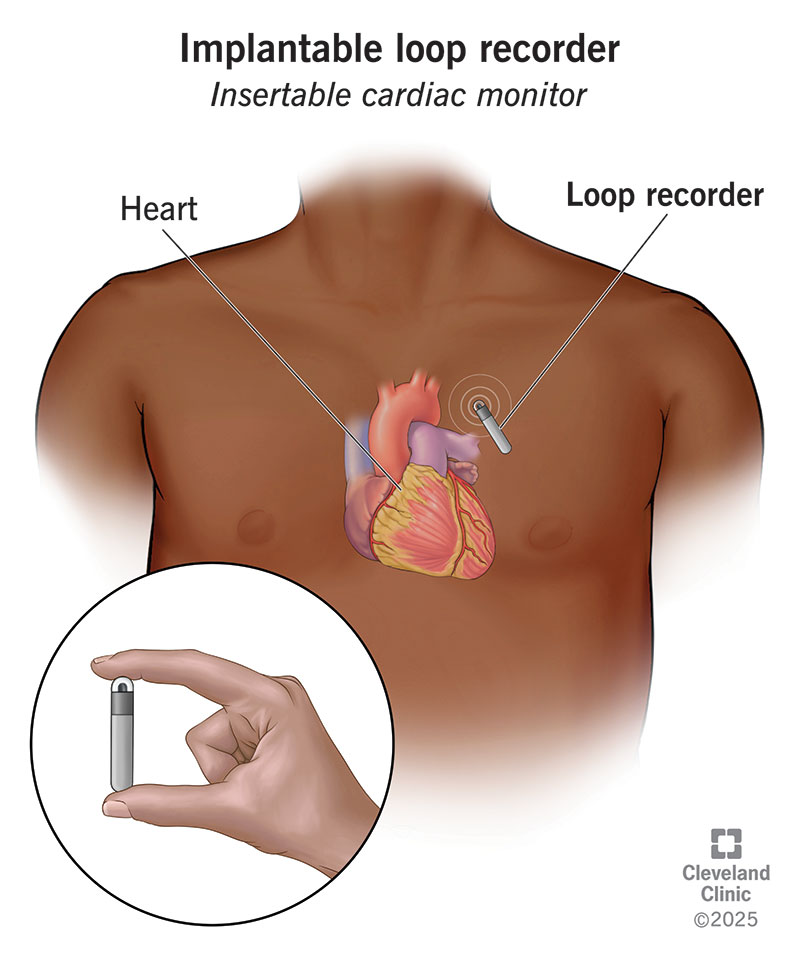
6/ Implantable Cardiac Monitor
A small device implanted subcutaneously, with a battery life of 2–3 years.
Automatically detects arrhythmias and allows remote transmission.
Best for recurrent, unexplained syncope or suspected arrhythmias that occur very infrequently.
A small device implanted subcutaneously, with a battery life of 2–3 years.
Automatically detects arrhythmias and allows remote transmission.
Best for recurrent, unexplained syncope or suspected arrhythmias that occur very infrequently.
7/ Quick clinical takeaway
◼️Symptoms within days → Holter
◼️Symptoms within weeks → Event monitor / loop recorder
◼️Need real-time monitoring → MCOT
◼️Symptoms rare (ms–yrs) → Implantable monitor
Choosing the right monitor often depends on how frequently the symptoms occur.
◼️Symptoms within days → Holter
◼️Symptoms within weeks → Event monitor / loop recorder
◼️Need real-time monitoring → MCOT
◼️Symptoms rare (ms–yrs) → Implantable monitor
Choosing the right monitor often depends on how frequently the symptoms occur.
• • •
Missing some Tweet in this thread? You can try to
force a refresh