HOW TO BUILD YOUR OWN ICT TRADING MODEL 🧵
ICT teaches retail traders to think like institutions (“smart money”).
Instead of chasing indicators, ICT focuses on how banks and hedge funds manipulate price to grab liquidity, then move the market efficiently.
The real edge comes when you stop trying to be ICT and use his concepts and teachings as a blueprint to build your own personalized trading model.
Take ownership for your work and you will prosper!
Core ICT Concepts You Must Know
Market Structure: Higher highs/high lows = uptrend. Lower highs/low lows = downtrend. A Break of Structure (BOS) signals trend change.
Order Blocks (OB): Last opposing candle before a strong move — institutional order flow.
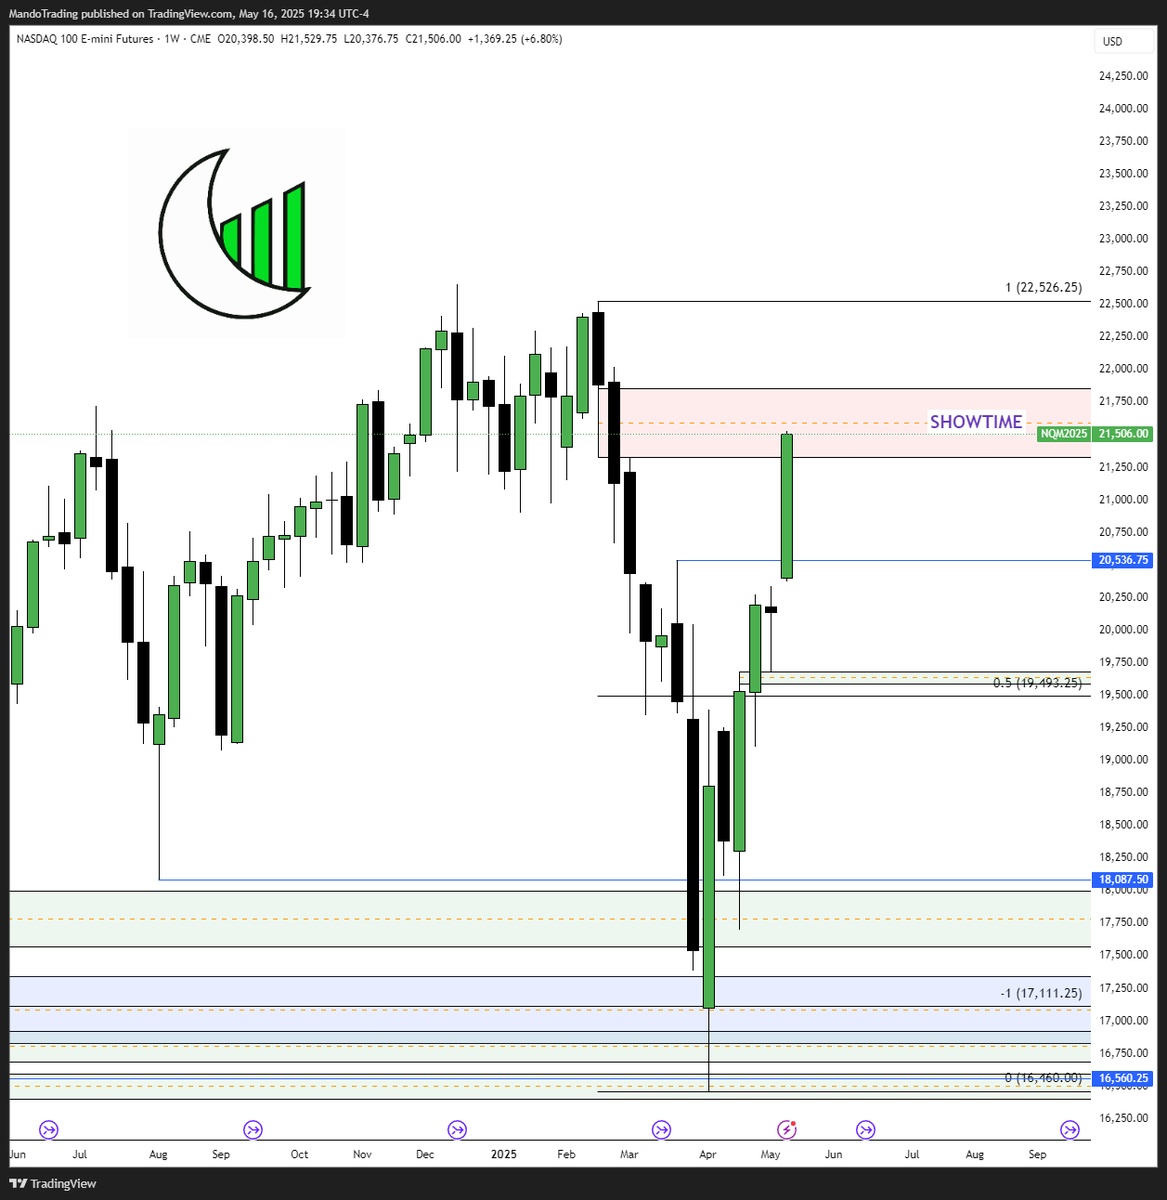
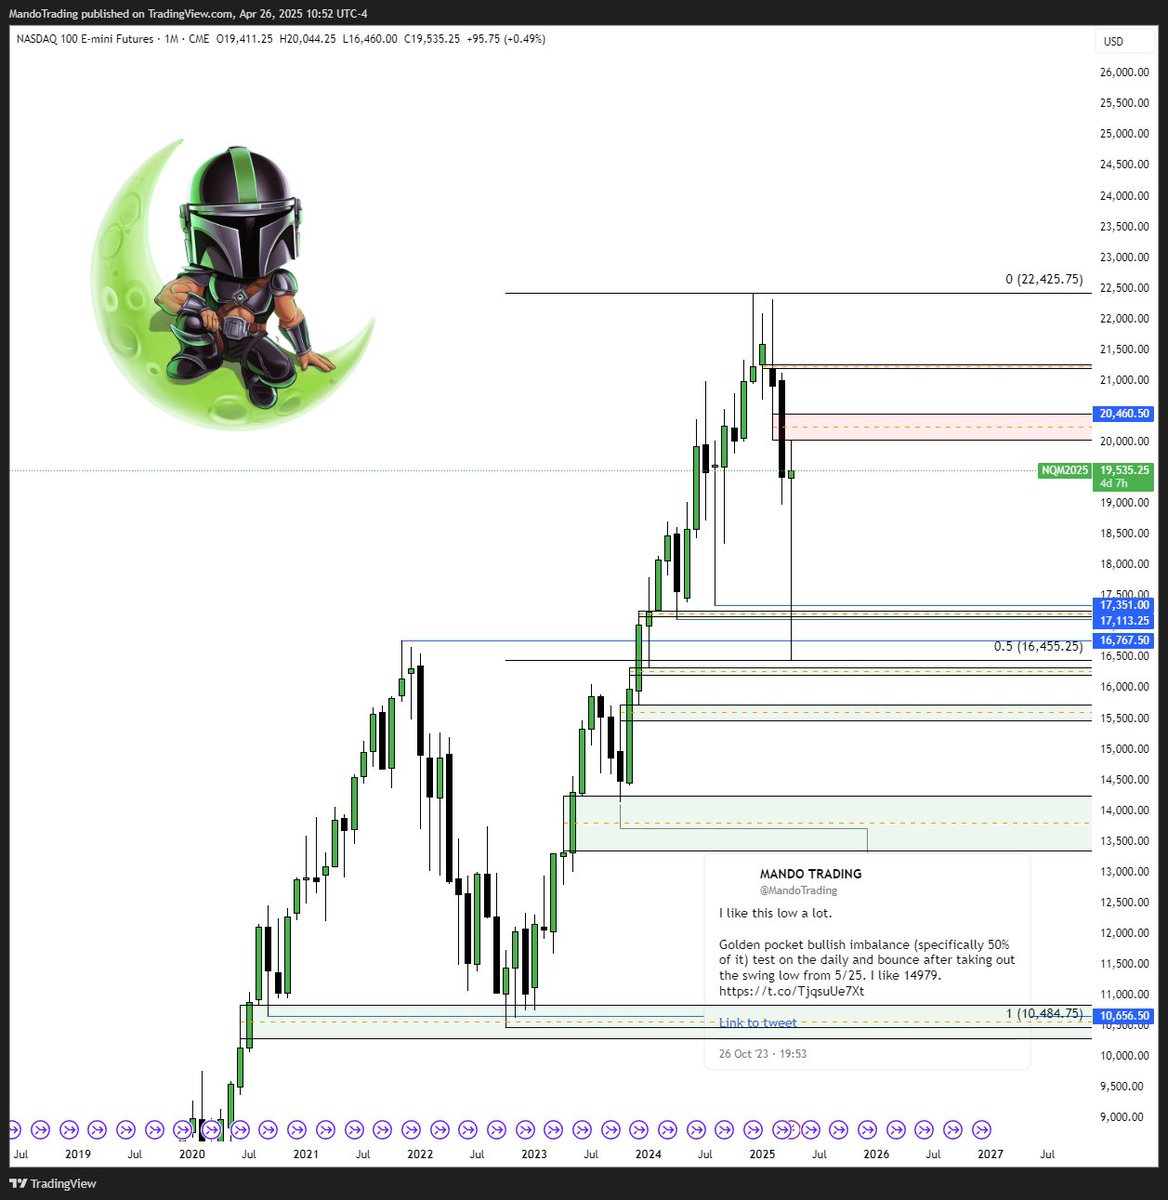
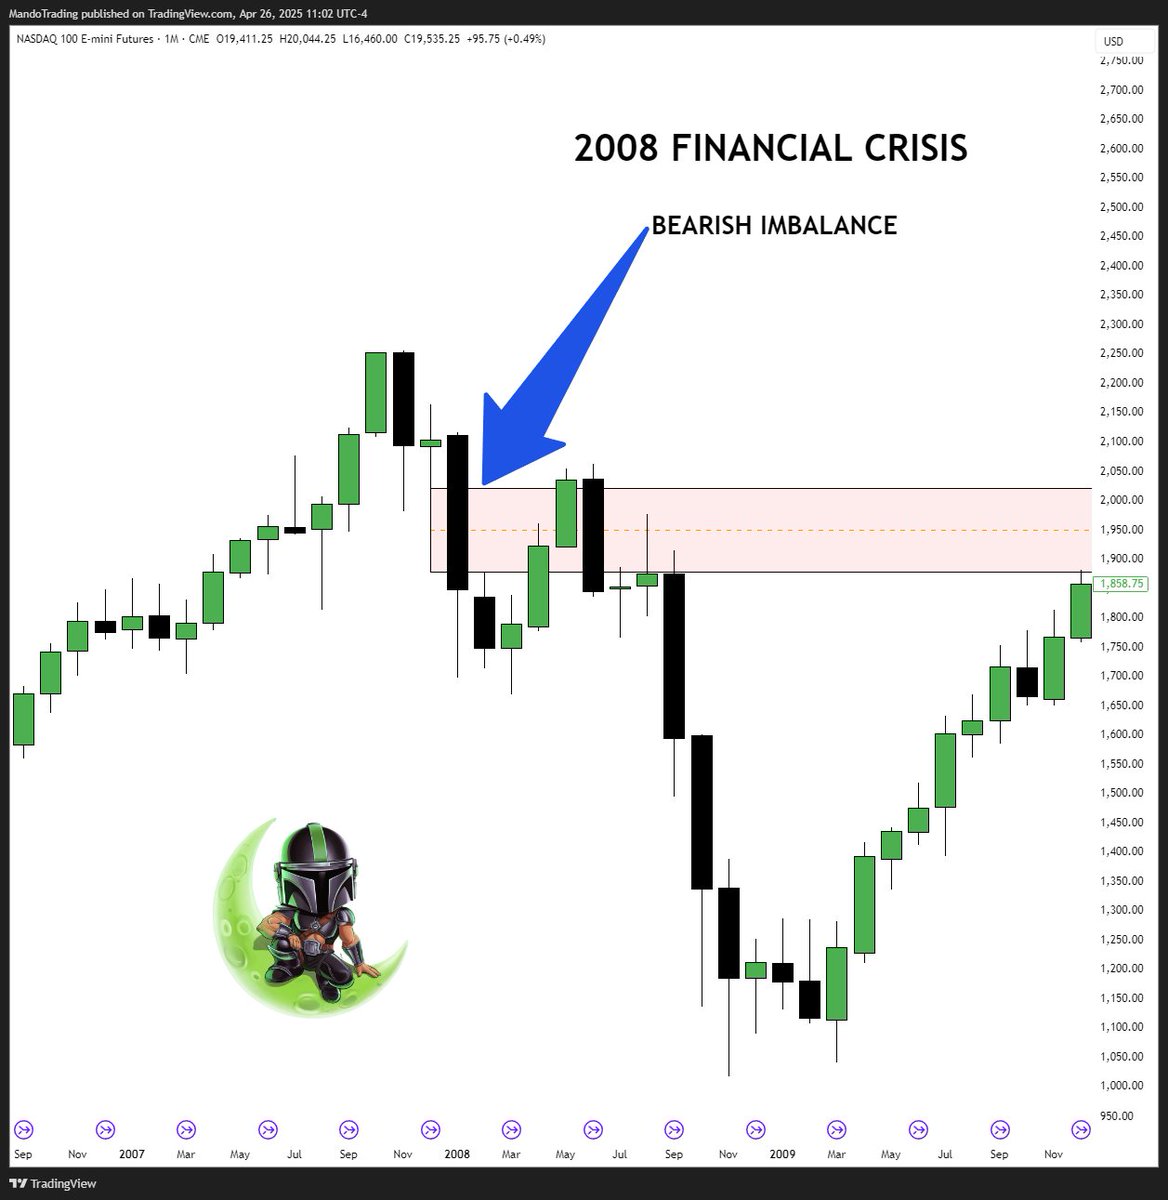
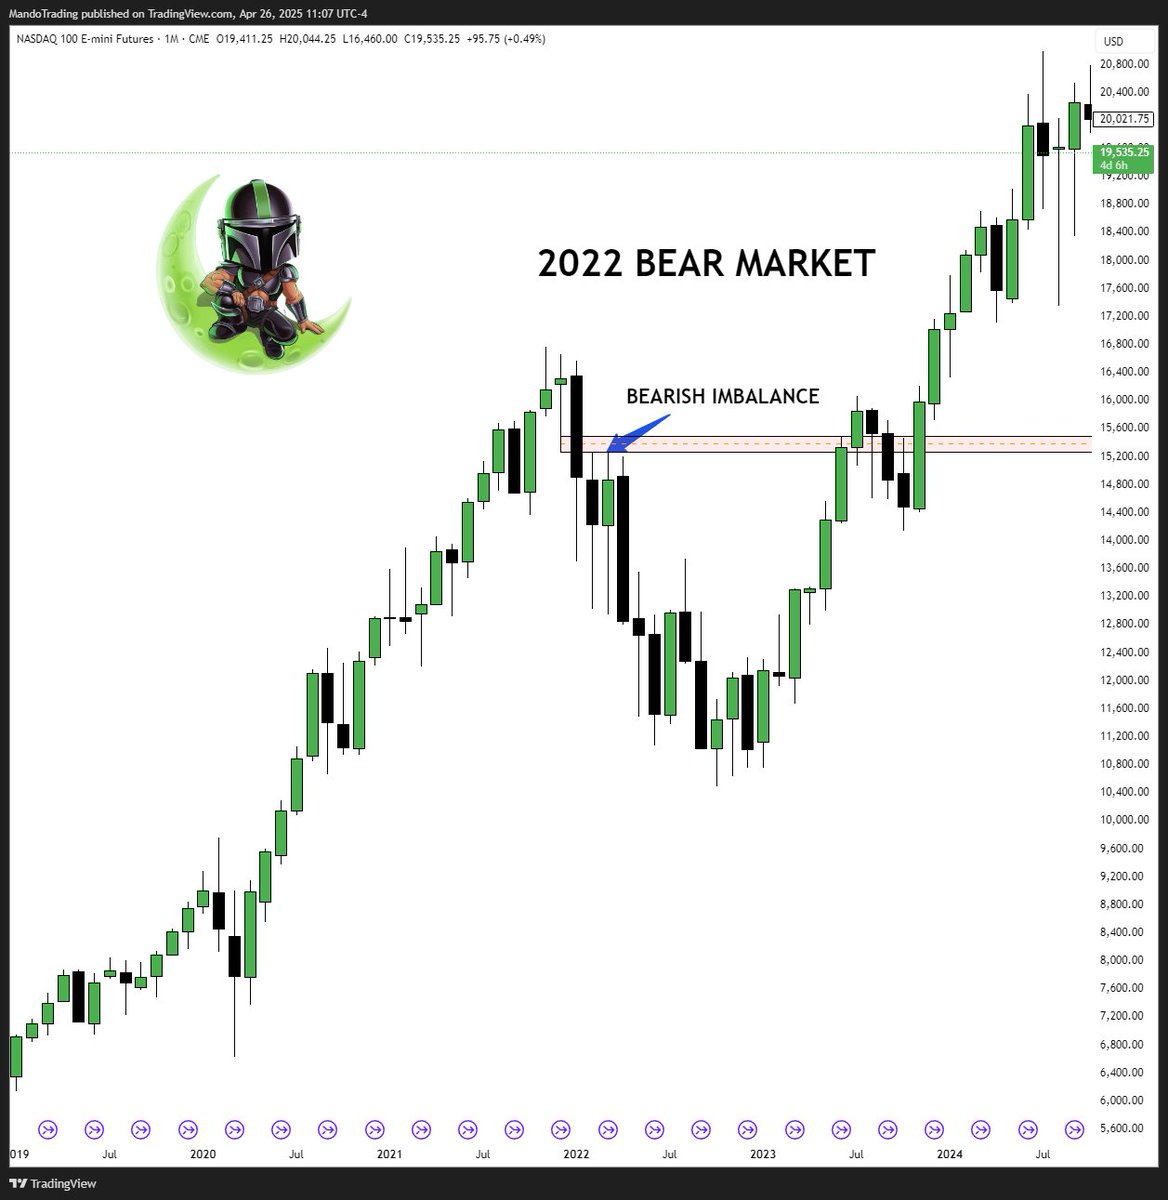
Fair Value Gaps (FVG): Imbalances left by fast price moves; price often returns to fill them.
Liquidity Grabs & Inducements: Fakeouts that sweep stops before reversing.
Premium vs. Discount of a specific range
Kill Zones + Macro times: High-probability times (London open, NY open).
Market Structure: Higher highs/high lows = uptrend. Lower highs/low lows = downtrend. A Break of Structure (BOS) signals trend change.
Order Blocks (OB): Last opposing candle before a strong move — institutional order flow.
Fair Value Gaps (FVG): Imbalances left by fast price moves; price often returns to fill them.
Liquidity Grabs & Inducements: Fakeouts that sweep stops before reversing.
Premium vs. Discount of a specific range
Kill Zones + Macro times: High-probability times (London open, NY open).
Step 1: Define Your Rules
Pick 2–3 stocks/indices you'd want to lock in on for a specific day (for example: $SPY, $TSLA, $NQ)
Timeframes: Higher TF for bias (H4/D1), lower for entry (M5/M15)
Risk: Identify trades in advance to understand risk prior to entry.
Daily goal: Trade must meet HTF draw and setup on lower time frames
Step 2: Create Clear Rules (Example Model)
Bias
- Only trade in direction of daily/weekly structure
- Setup must align with kill zone/macro for efficient delivery
Entry (Criteria must be met)
Here's mine:
- Clear HTF bias
- Retracement into a discounted imbalance
- Lower time frame imbalance in the direction I'd like price to go for confirmation
Risk Management
Stop loss: low of the candle that created the imbalance
Target: Next buyside draw OR imbalance
Filters
No trading during high-impact news
Skip if market is ranging (no clear structure)
Step 3: Test It Ruthlessly
Backtest 6–12 months manually on TradingView
Forward test 3 months on demo
Track in journal: Win rate, RR, expectancy
Adjust accordingly as data reveals answers
Backtest 6–12 months manually on TradingView
Forward test 3 months on demo
Track in journal: Win rate, RR, expectancy
Adjust accordingly as data reveals answers
Step 4: Make It Yours
Here's mine:
Combining HTF draw on liquidity with market structure, premium and discount theory and imbalance to map the trade
Add your personal edge: options flow used as a scanner. If money flows correspond with the setup on the chart dive deeper
Here's mine:
Combining HTF draw on liquidity with market structure, premium and discount theory and imbalance to map the trade
Add your personal edge: options flow used as a scanner. If money flows correspond with the setup on the chart dive deeper
Final Breakdown:
- Keep it simple. Analysis paralysis is real
- Take accountability and actual track trades
- Gather data for tweaks if necessary
- Take your time. You're working towards a lifelong skill, what's the rush?
- Keep it simple. Analysis paralysis is real
- Take accountability and actual track trades
- Gather data for tweaks if necessary
- Take your time. You're working towards a lifelong skill, what's the rush?
ICT gives you the road map. Building your own model turns it into your weapon.
Trade like the institutions — not like the crowd.
Interested in building your own? I've helped hundreds of traders find their edge in the markets without ever giving a single alert. DM me and we'll get started!
Trade like the institutions — not like the crowd.
Interested in building your own? I've helped hundreds of traders find their edge in the markets without ever giving a single alert. DM me and we'll get started!
• • •
Missing some Tweet in this thread? You can try to
force a refresh