1/
Most people think you need an angiogram to detect coronary artery disease.
But sometimes, the first clue appears on a simple echocardiogram.
Here are echo findings that quietly reveal coronary artery disease (CAD), even before other tests. 🧵
Most people think you need an angiogram to detect coronary artery disease.
But sometimes, the first clue appears on a simple echocardiogram.
Here are echo findings that quietly reveal coronary artery disease (CAD), even before other tests. 🧵
2/
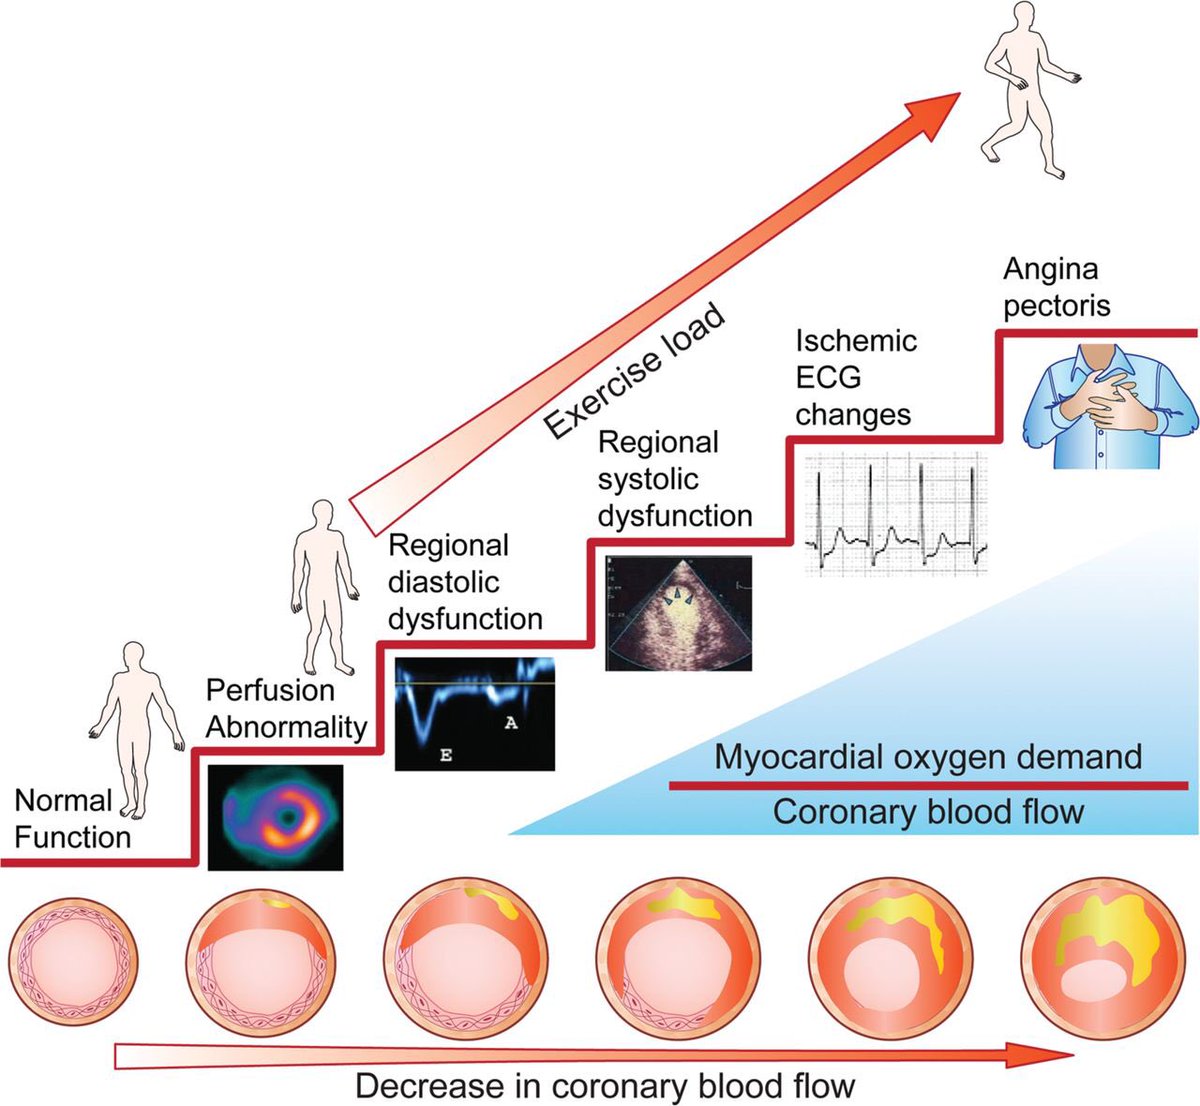
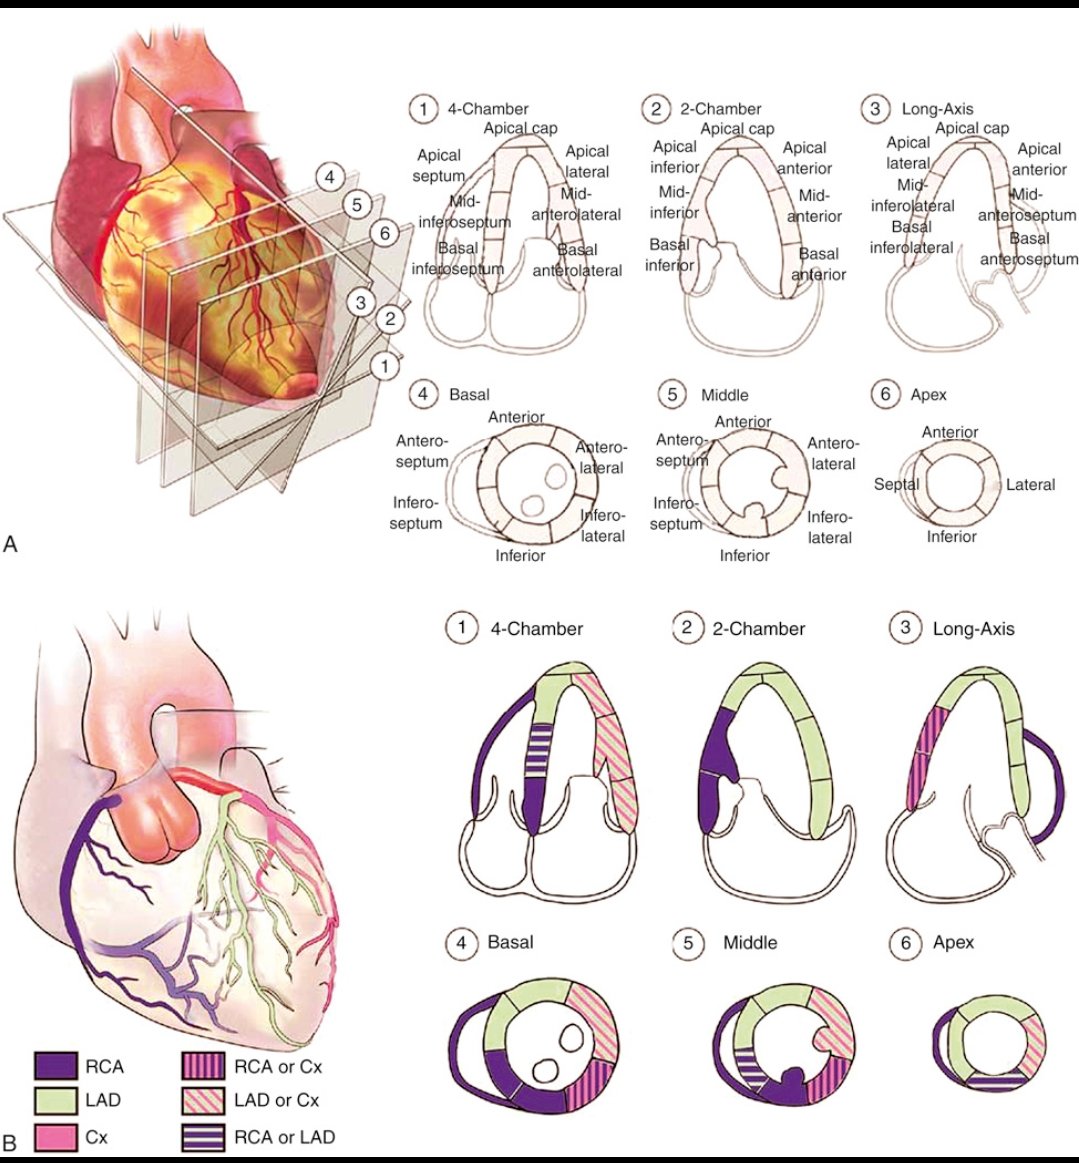
In CAD, the first thing echo helps us look for is regional wall motion abnormalities.
When a coronary artery can't deliver enough blood, the affected myocardial segment stops contracting normally.
This is often the earliest visible sign of ischemia.
In CAD, the first thing echo helps us look for is regional wall motion abnormalities.
When a coronary artery can't deliver enough blood, the affected myocardial segment stops contracting normally.
This is often the earliest visible sign of ischemia.
3/
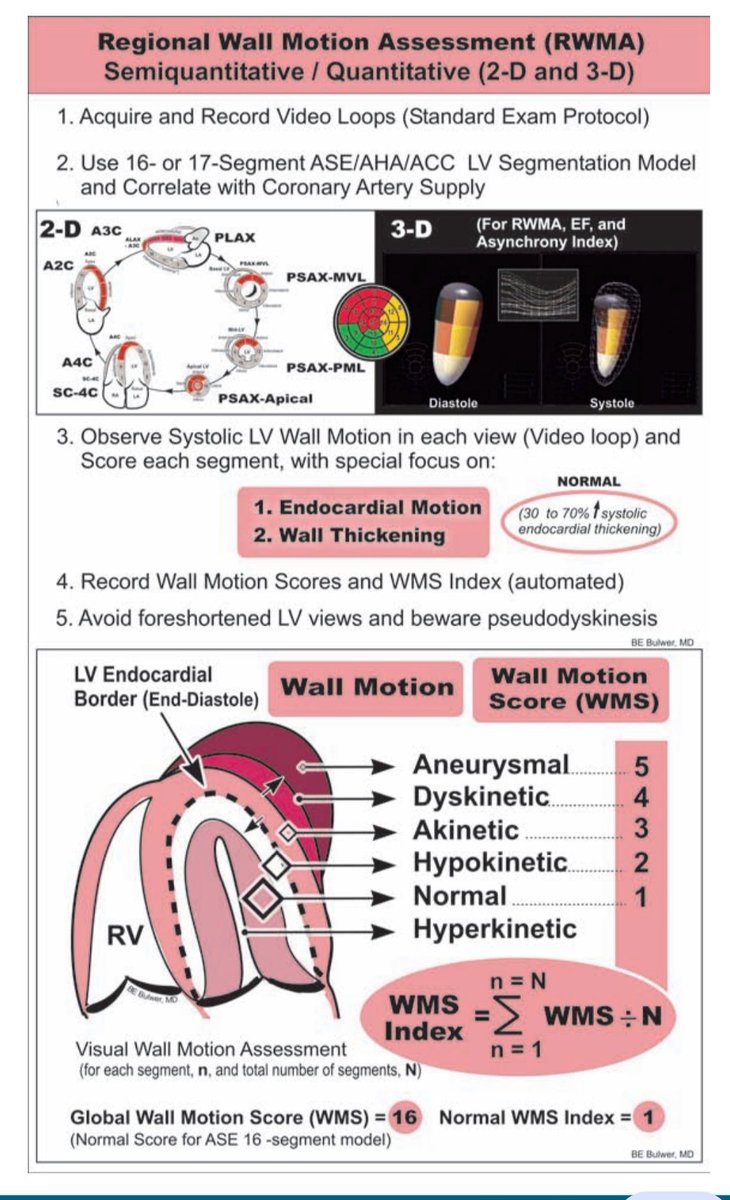
Cardiologists classify wall motion using a simple scoring system:
◼️Normal / hyperkinetic
◼️ Hypokinetic (reduced contraction)
◼️ Akinetic (no contraction)
◼️ Dyskinetic (paradoxical motion)
This forms the basis of the Wall Motion Score Index (WMSI) used in ischemia assessment
Cardiologists classify wall motion using a simple scoring system:
◼️Normal / hyperkinetic
◼️ Hypokinetic (reduced contraction)
◼️ Akinetic (no contraction)
◼️ Dyskinetic (paradoxical motion)
This forms the basis of the Wall Motion Score Index (WMSI) used in ischemia assessment
4/
Modern echocardiography goes beyond just "looking."
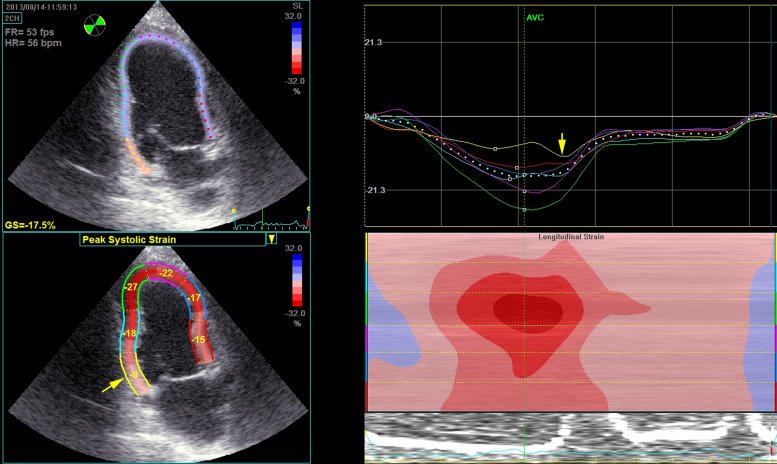
With speckle-tracking strain imaging, we can measure myocardial deformation and detect subtle dysfunction, even when the wall motion still appears normal.
Sometimes strain detects ischemia earlier than the eye can.
Modern echocardiography goes beyond just "looking."
With speckle-tracking strain imaging, we can measure myocardial deformation and detect subtle dysfunction, even when the wall motion still appears normal.
Sometimes strain detects ischemia earlier than the eye can.
5/
One interesting marker is post-systolic shortening (PSS).
Normally, the myocardium finishes contracting before the aortic valve closes.
But ischemic segments may contract late, after systole.
That delayed contraction can be a clue to ischemia.
One interesting marker is post-systolic shortening (PSS).
Normally, the myocardium finishes contracting before the aortic valve closes.
But ischemic segments may contract late, after systole.
That delayed contraction can be a clue to ischemia.

6/
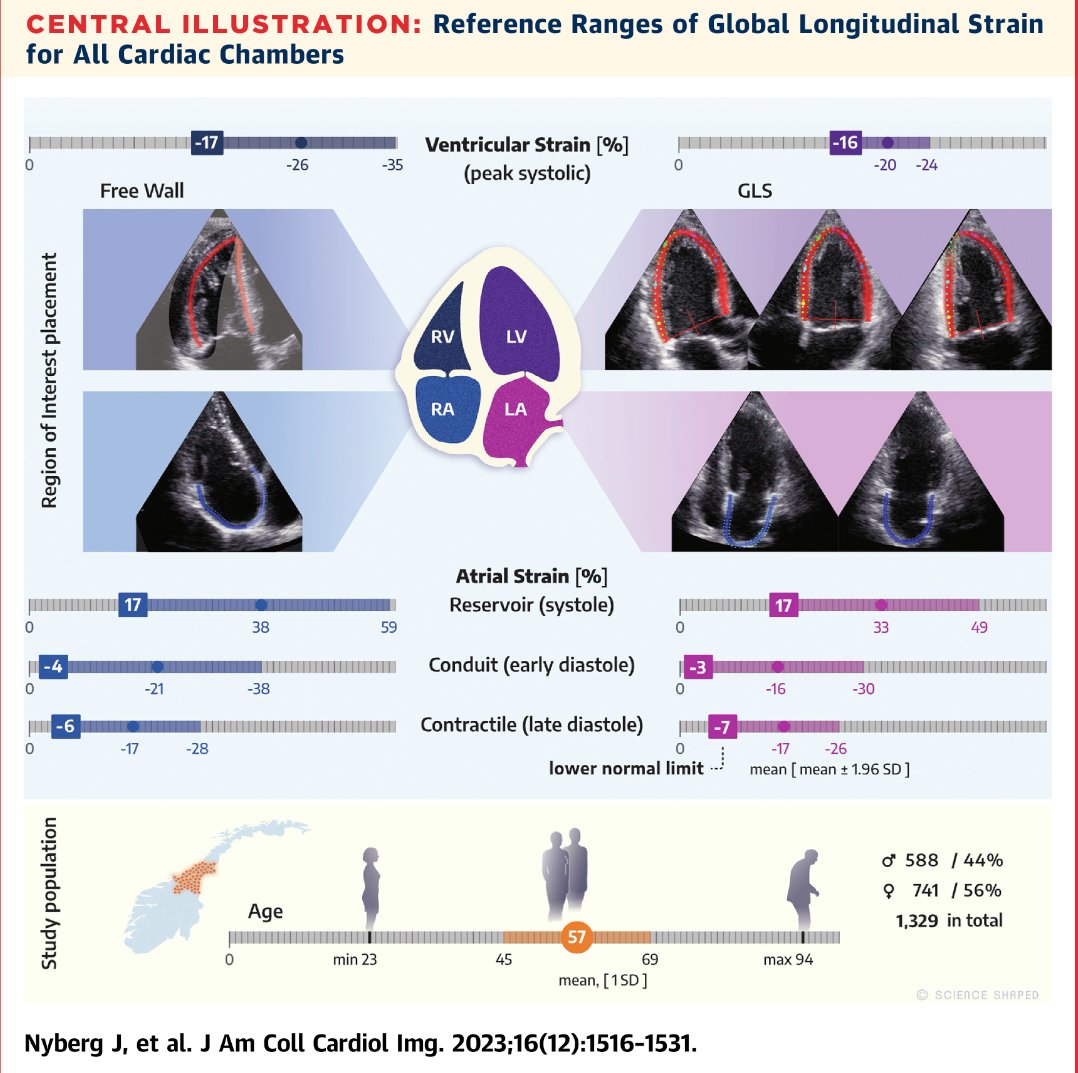
Another powerful parameter is Global Longitudinal Strain (GLS).
Normal GLS is around −20%.
Less negative values often indicate impaired myocardial function and may hint at underlying coronary disease, even when ejection fraction looks normal.
Another powerful parameter is Global Longitudinal Strain (GLS).
Normal GLS is around −20%.
Less negative values often indicate impaired myocardial function and may hint at underlying coronary disease, even when ejection fraction looks normal.
7/
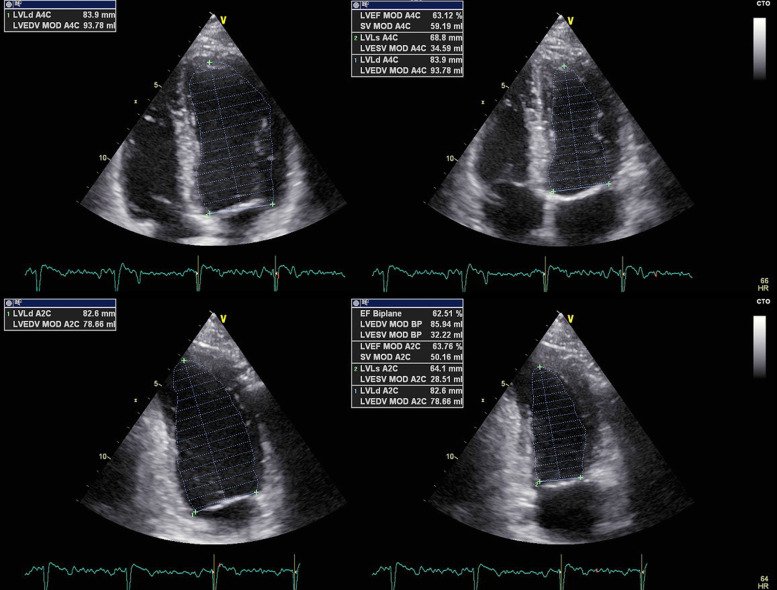
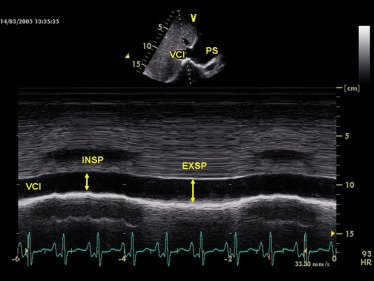
Echo also evaluates overall heart pumping ability.
Using the Simpson biplane method, we calculate left ventricular ejection fraction (LVEF).
Reduced EF in CAD patients often reflects myocardial damage from ischemia or infarction.
Echo also evaluates overall heart pumping ability.
Using the Simpson biplane method, we calculate left ventricular ejection fraction (LVEF).
Reduced EF in CAD patients often reflects myocardial damage from ischemia or infarction.
8/
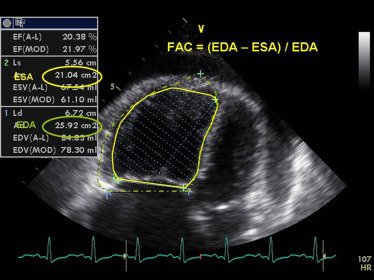
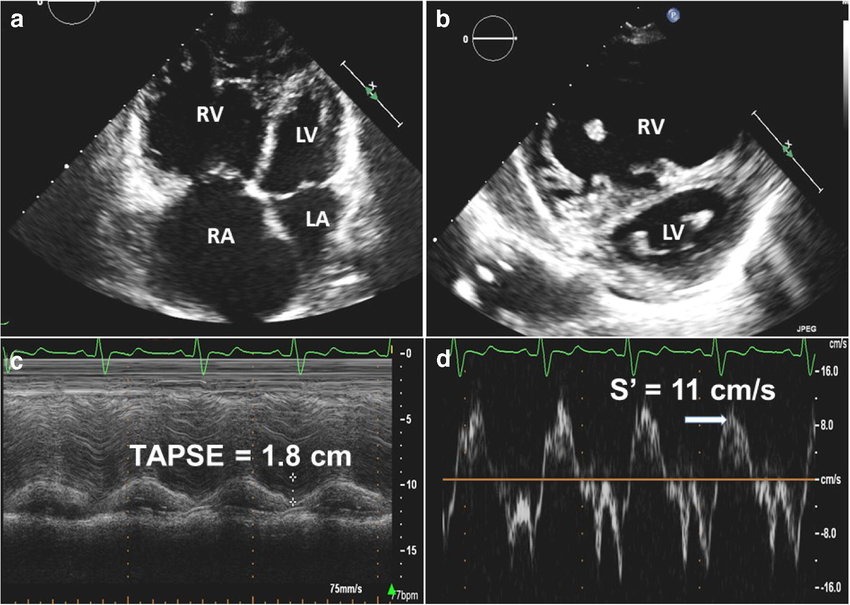
But CAD doesn't only affect the left ventricle.
Right ventricular infarction can occur, especially with right coronary artery occlusion.
Echo findings may include:
🔵 RV wall motion abnormalities
🔵 Reduced TAPSE
🔵 RV dilation
But CAD doesn't only affect the left ventricle.
Right ventricular infarction can occur, especially with right coronary artery occlusion.
Echo findings may include:
🔵 RV wall motion abnormalities
🔵 Reduced TAPSE
🔵 RV dilation
9/
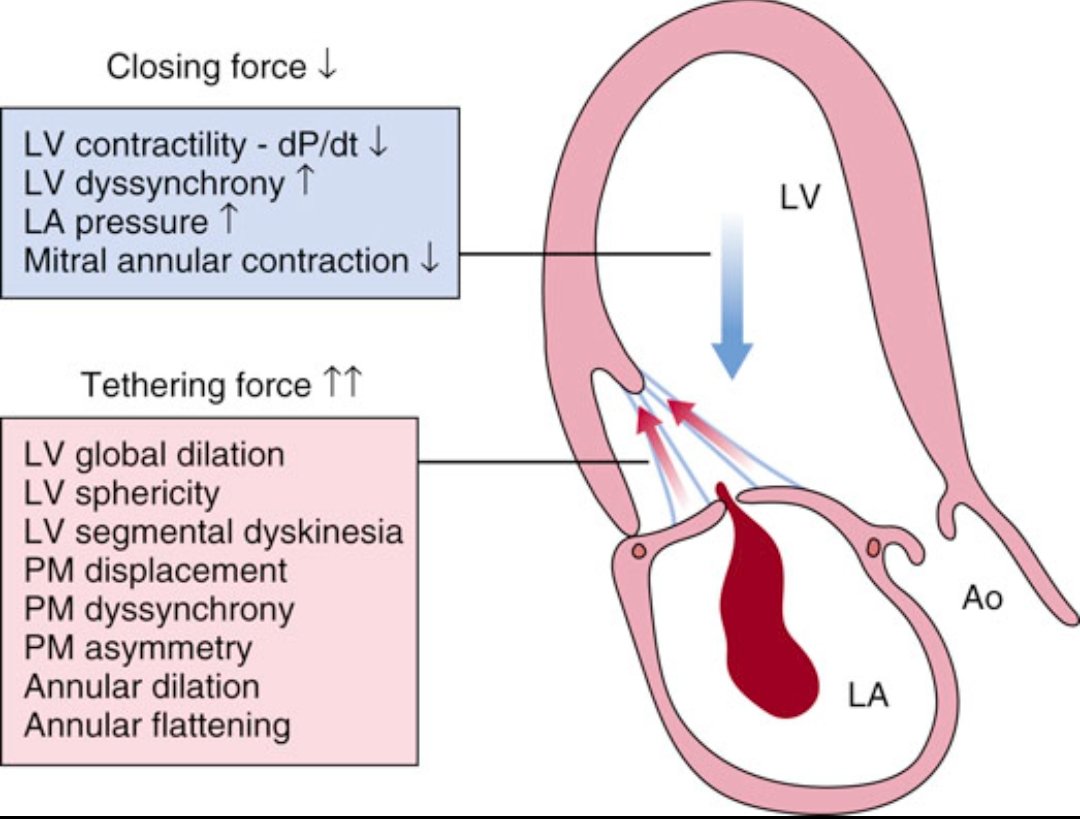
Another complication cardiologists watch closely is ischemic mitral regurgitation.
After MI, the ventricle remodels → papillary muscles shift → mitral leaflets fail to coapt.
The result: MR that worsens HF and prognosis.
Echo is essential to diagnose and quantify it
Another complication cardiologists watch closely is ischemic mitral regurgitation.
After MI, the ventricle remodels → papillary muscles shift → mitral leaflets fail to coapt.
The result: MR that worsens HF and prognosis.
Echo is essential to diagnose and quantify it
10/
Despite newer imaging technologies, echo remains indispensable in CAD.
It helps us evaluate:
- myocardial fx
- ischemia
- ventricular remodeling
- valve complications
- hemodynamics
All in real time, at the bedside.
Sometimes the most powerful tools are still the simplest.
Despite newer imaging technologies, echo remains indispensable in CAD.
It helps us evaluate:
- myocardial fx
- ischemia
- ventricular remodeling
- valve complications
- hemodynamics
All in real time, at the bedside.
Sometimes the most powerful tools are still the simplest.
• • •
Missing some Tweet in this thread? You can try to
force a refresh