In honour of #LongCOVIDAwarenessDay, I’d like to present some important data from the latest GP-Patient survey.
This is a HUGE survey with a sample size of ~700K people in England (5x bigger than ONS’s Covid survey).
In this thread, I’ll walk you through some key findings…
/1
This is a HUGE survey with a sample size of ~700K people in England (5x bigger than ONS’s Covid survey).
In this thread, I’ll walk you through some key findings…
/1
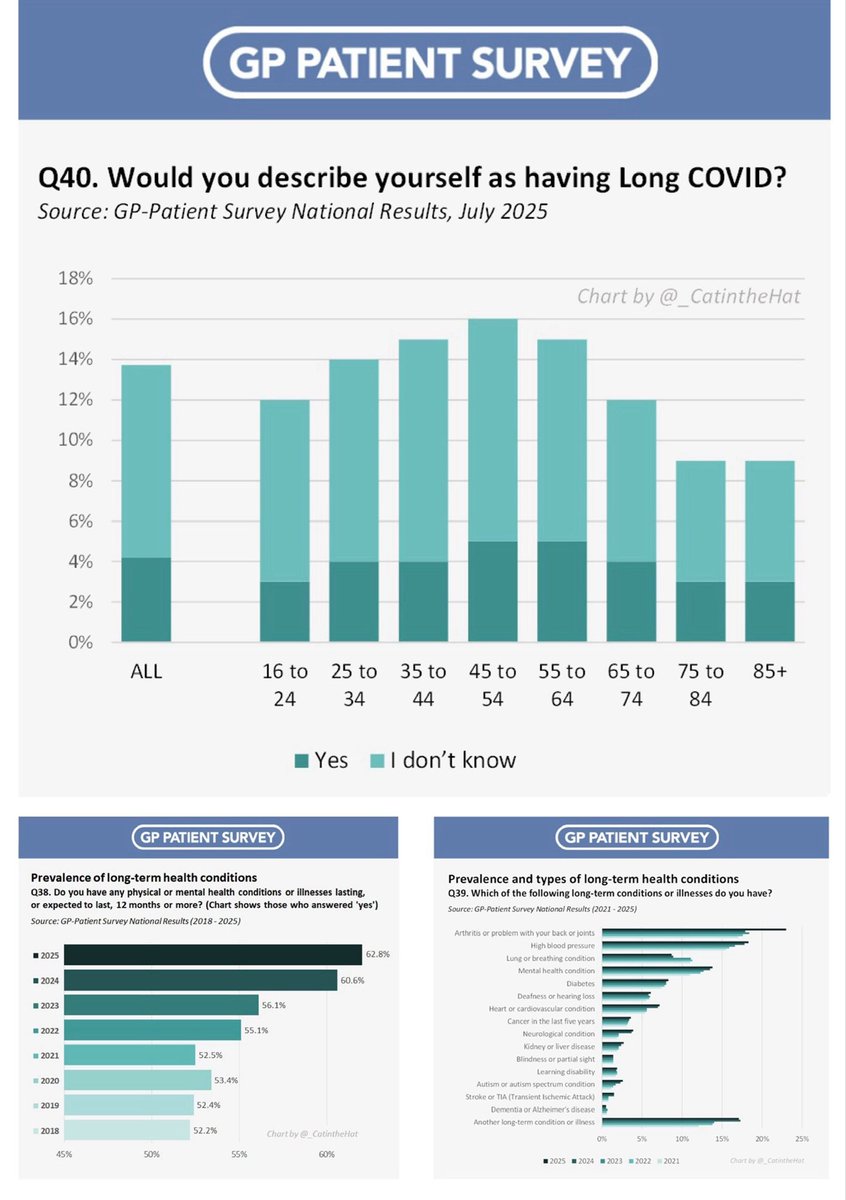
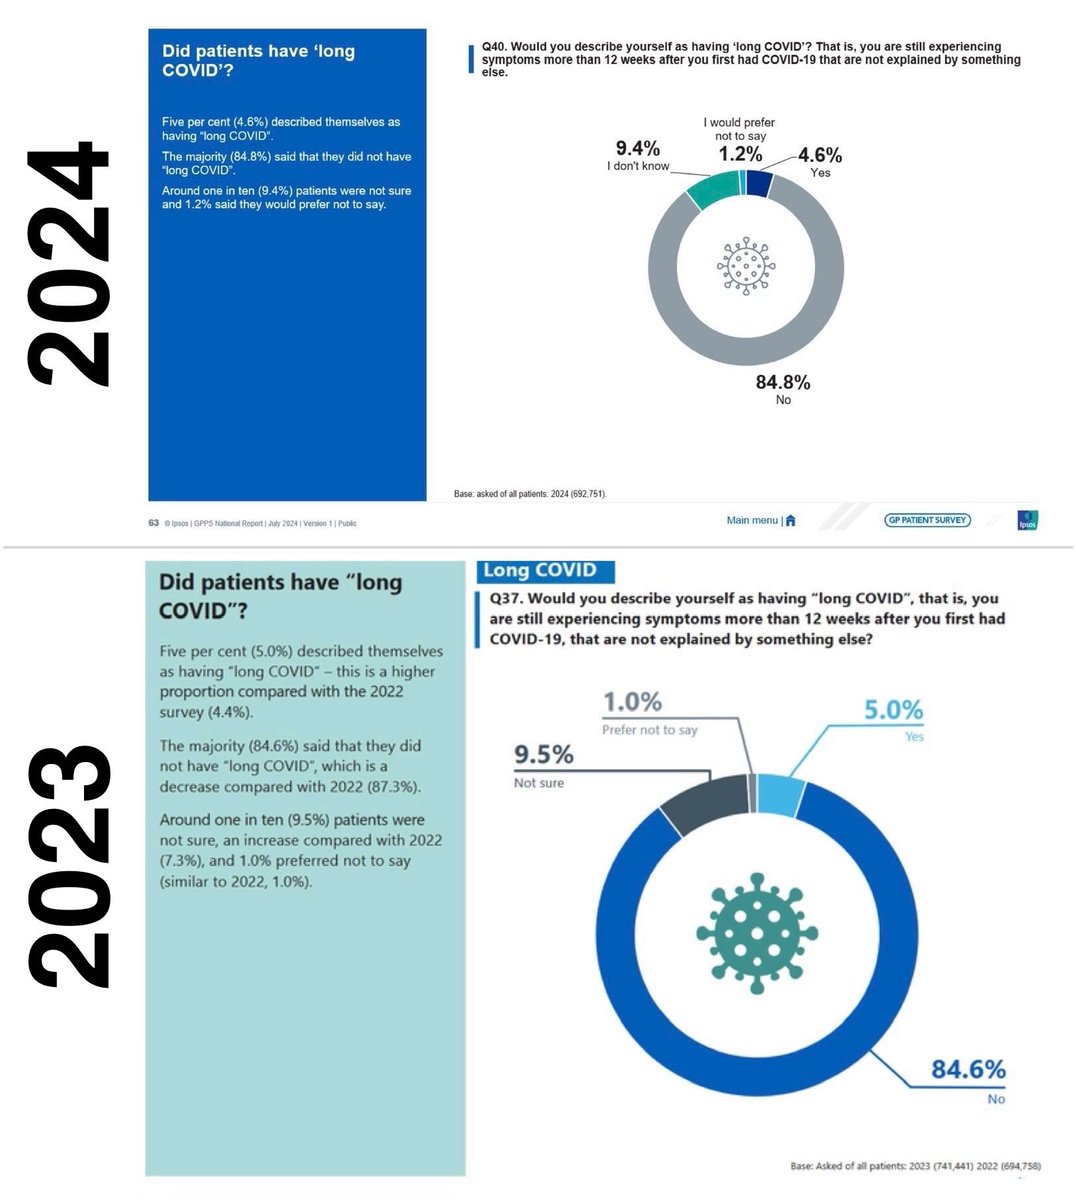
According to the GP-Patient survey:
🚨4.2% of people say they DO have Long Covid. That equates to around 2.3M people in England.
🚨A further 9.5% (~5.3M) say they ‘don’t know’.
So potentially as many as 7.6M people in England either have Long Covid or suspect they might.
/2
🚨4.2% of people say they DO have Long Covid. That equates to around 2.3M people in England.
🚨A further 9.5% (~5.3M) say they ‘don’t know’.
So potentially as many as 7.6M people in England either have Long Covid or suspect they might.
/2
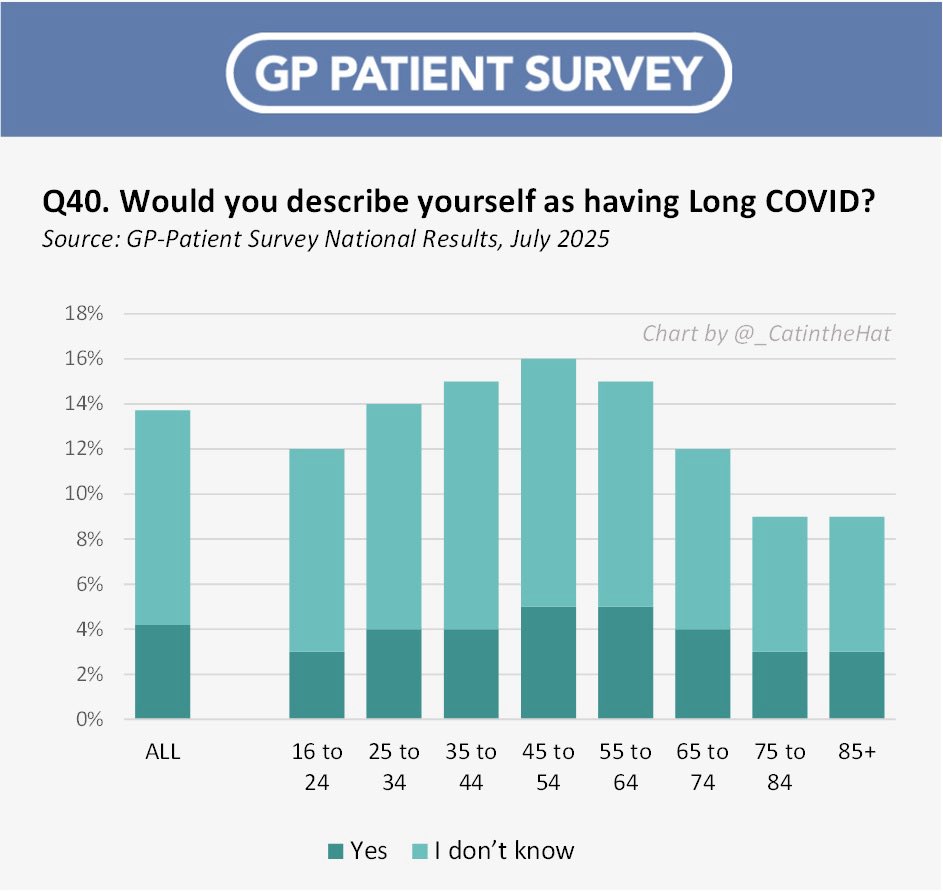
The fact that 9.5% of people said they “don’t know” if they have long Covid is actually not surprising.
It’s a HUGE number of people who suspect something isn’t right but don’t have clarity…
…and once you think about how Covid is diagnosed, it makes perfect sense.
/3
It’s a HUGE number of people who suspect something isn’t right but don’t have clarity…
…and once you think about how Covid is diagnosed, it makes perfect sense.
/3
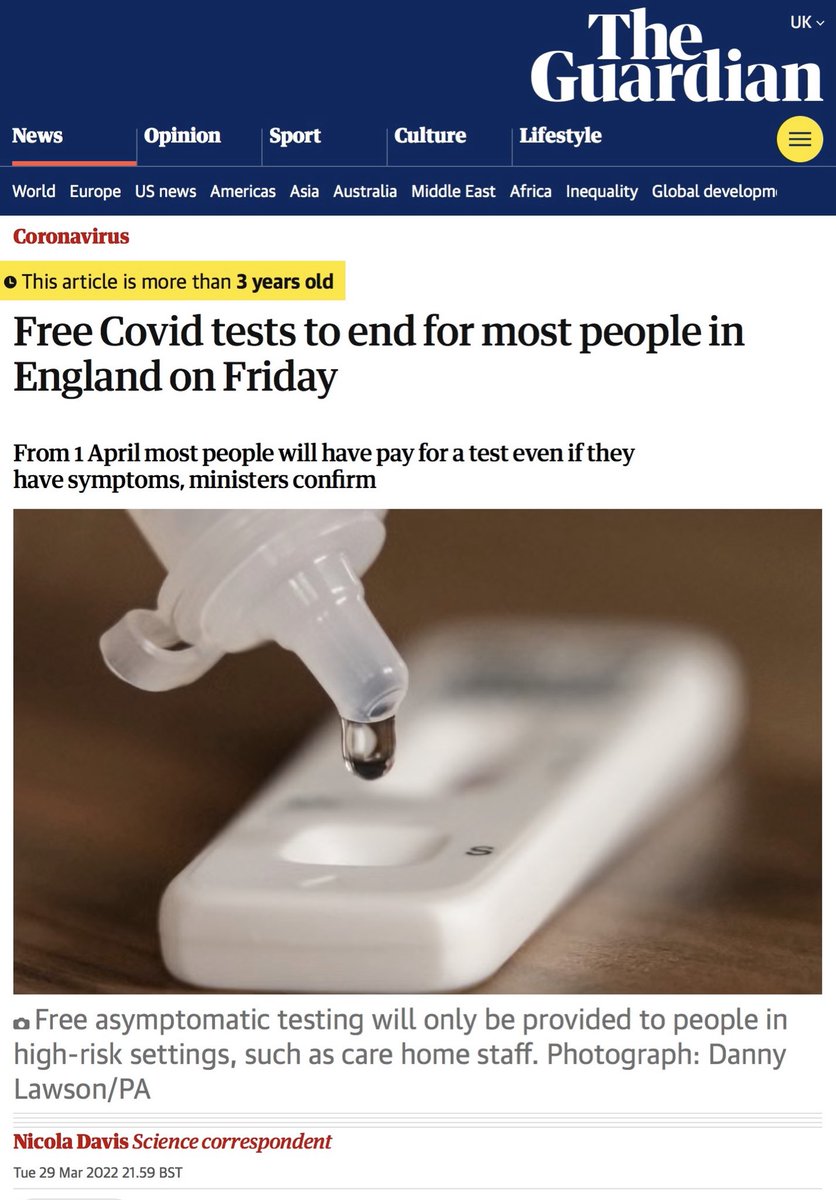
For starters, hardly anyone tests for Covid anymore.
Free mass testing ended on 1 April 2022.
Since then, if someone gets Covid symptoms, it’s unlikely they’ll test & will never know for sure if it was actually Covid.
That makes linking later symptoms to Covid much harder.
/4
Free mass testing ended on 1 April 2022.
Since then, if someone gets Covid symptoms, it’s unlikely they’ll test & will never know for sure if it was actually Covid.
That makes linking later symptoms to Covid much harder.
/4
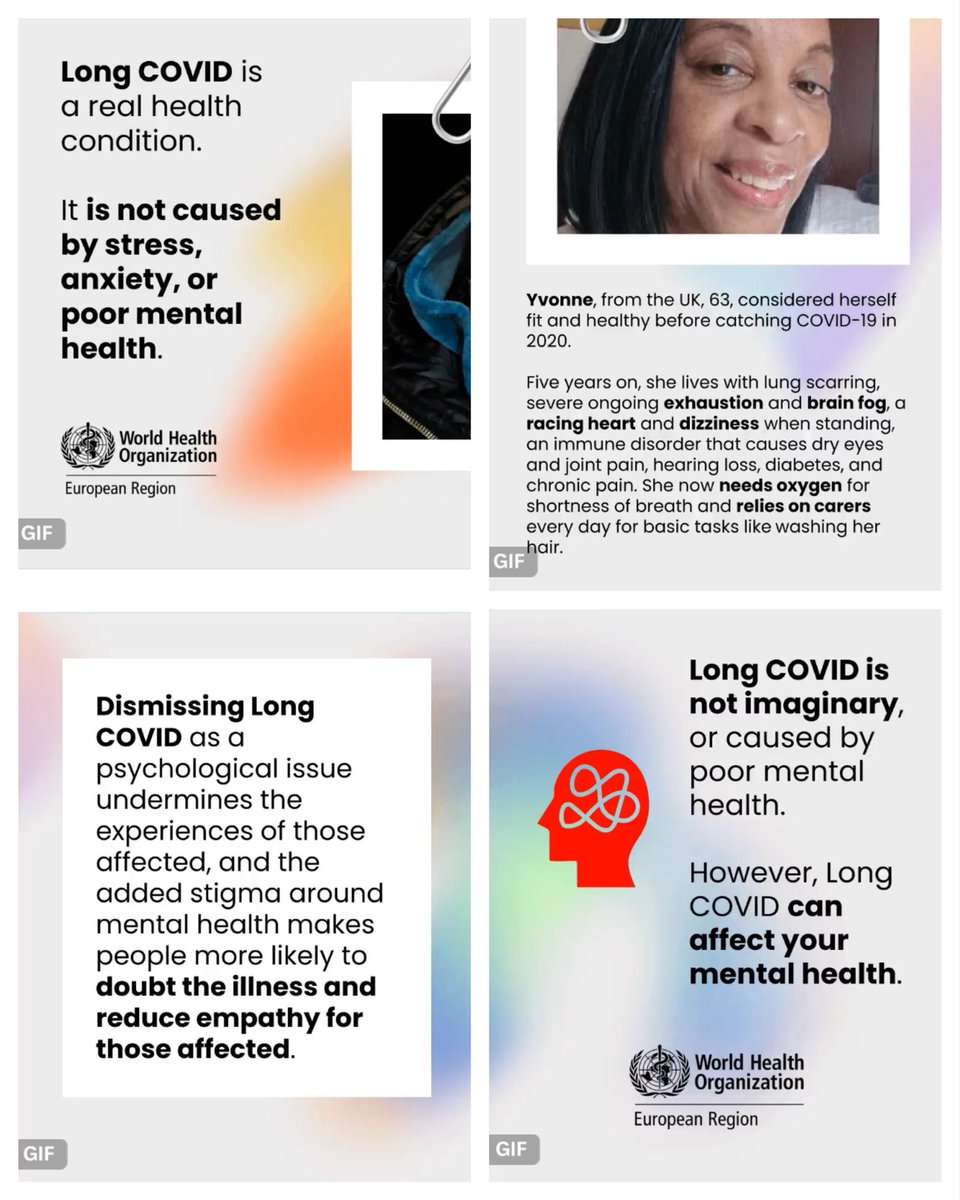
Secondly, it’s well documented that Long Covid patients are often dismissed & gaslit by doctors.
All too often, physical symptoms are dismissed as “stress, anxiety or poor mental health”.
This is such a widespread issue that the WHO put out the post below just this week.
/5
All too often, physical symptoms are dismissed as “stress, anxiety or poor mental health”.
This is such a widespread issue that the WHO put out the post below just this week.
/5
https://twitter.com/who_europe/status/2032549796091719920
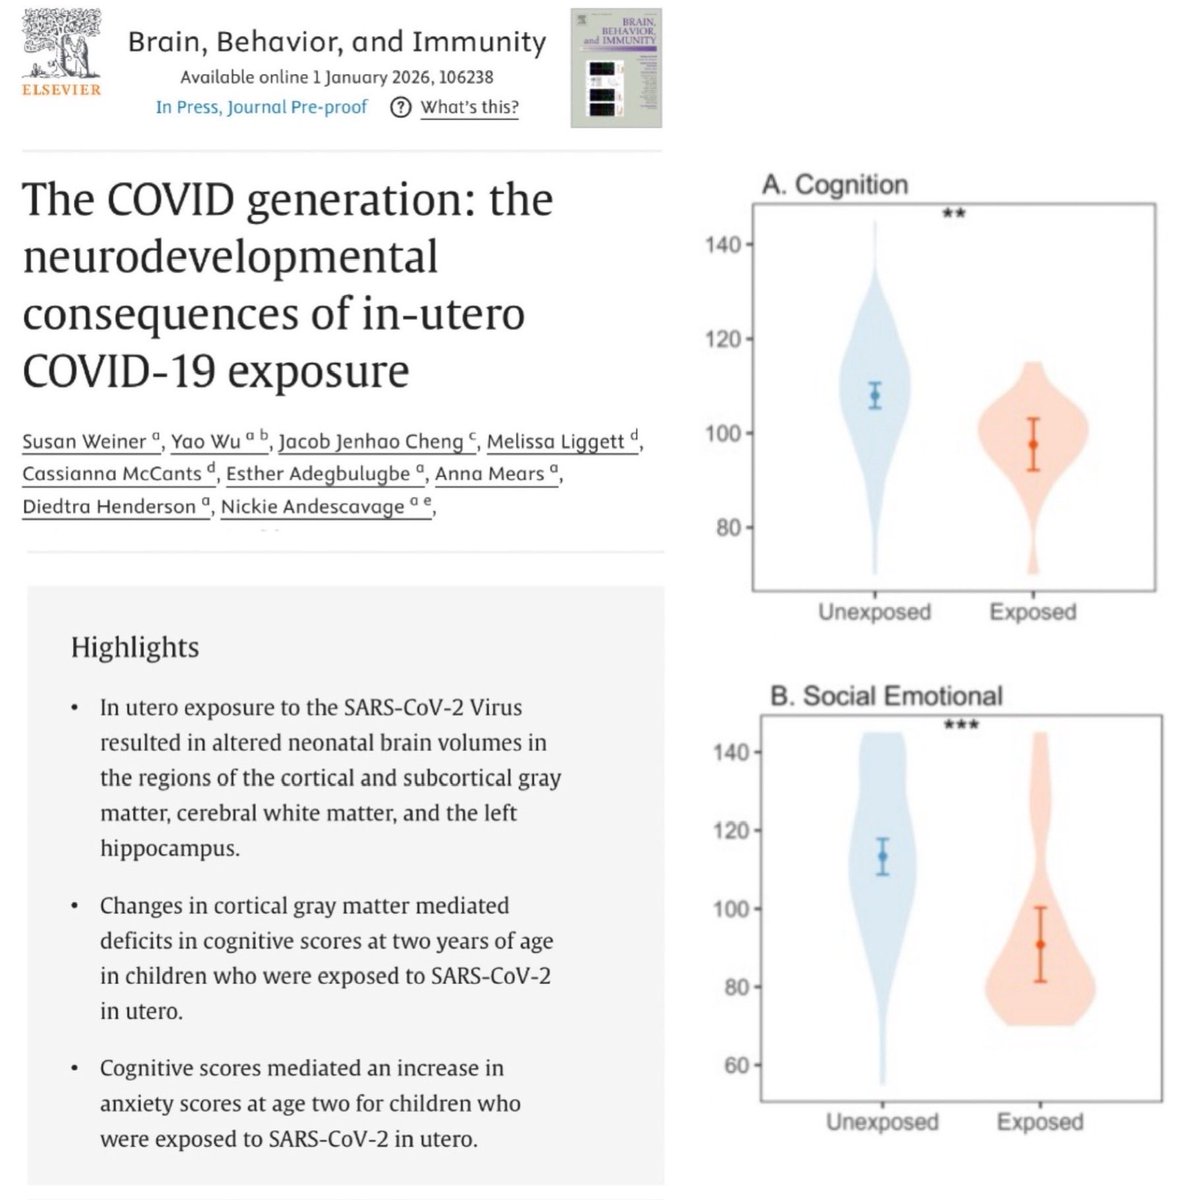
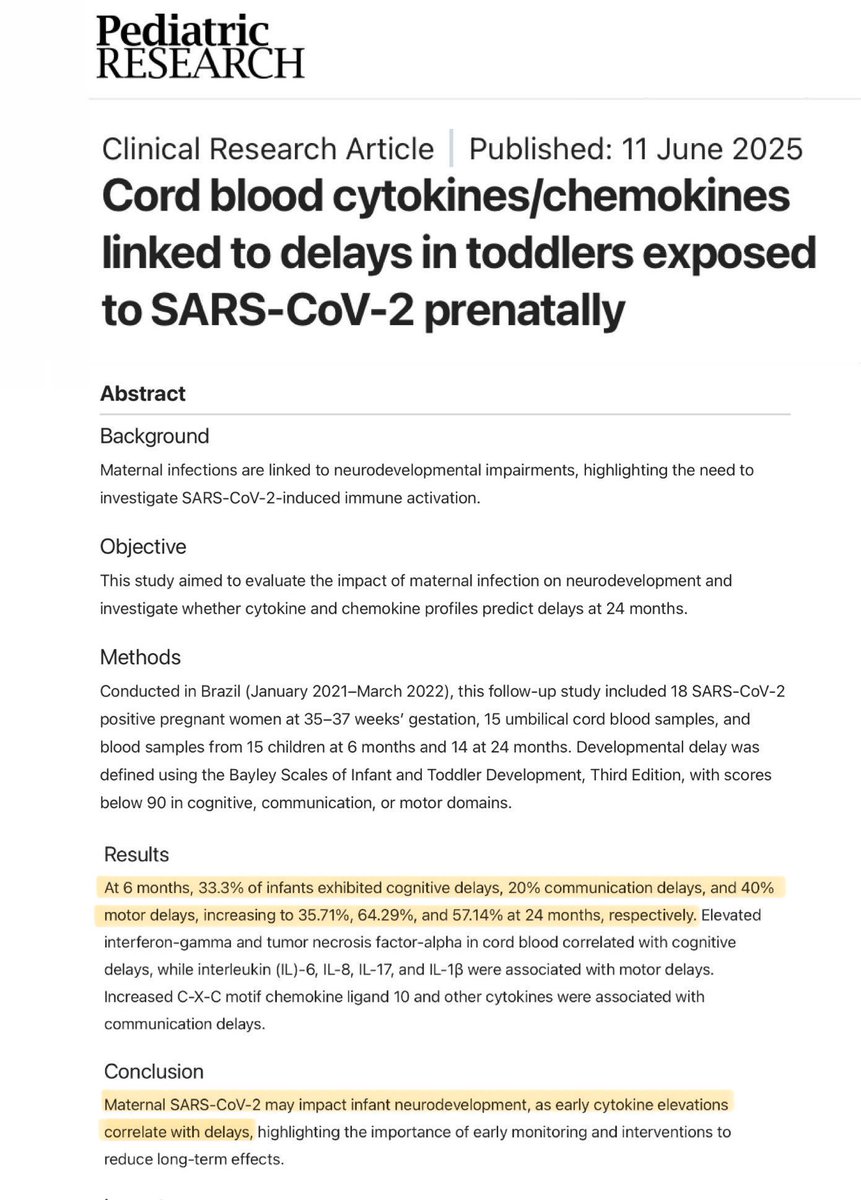
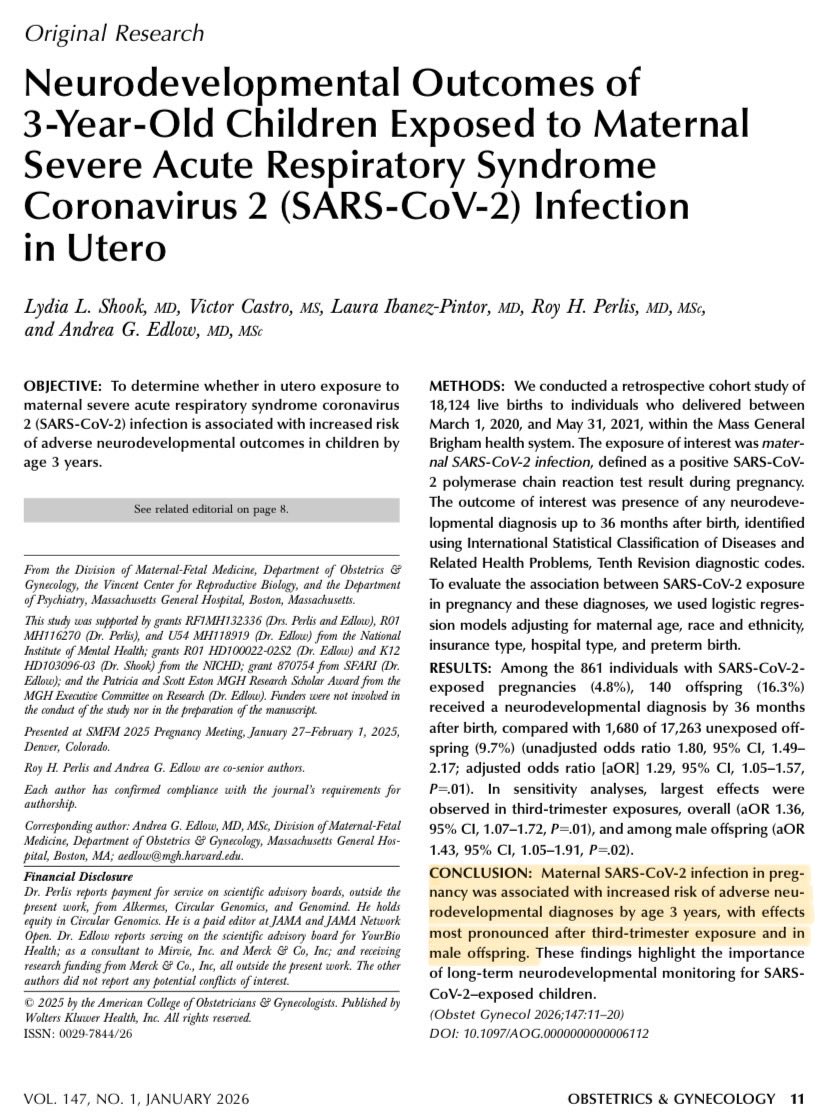
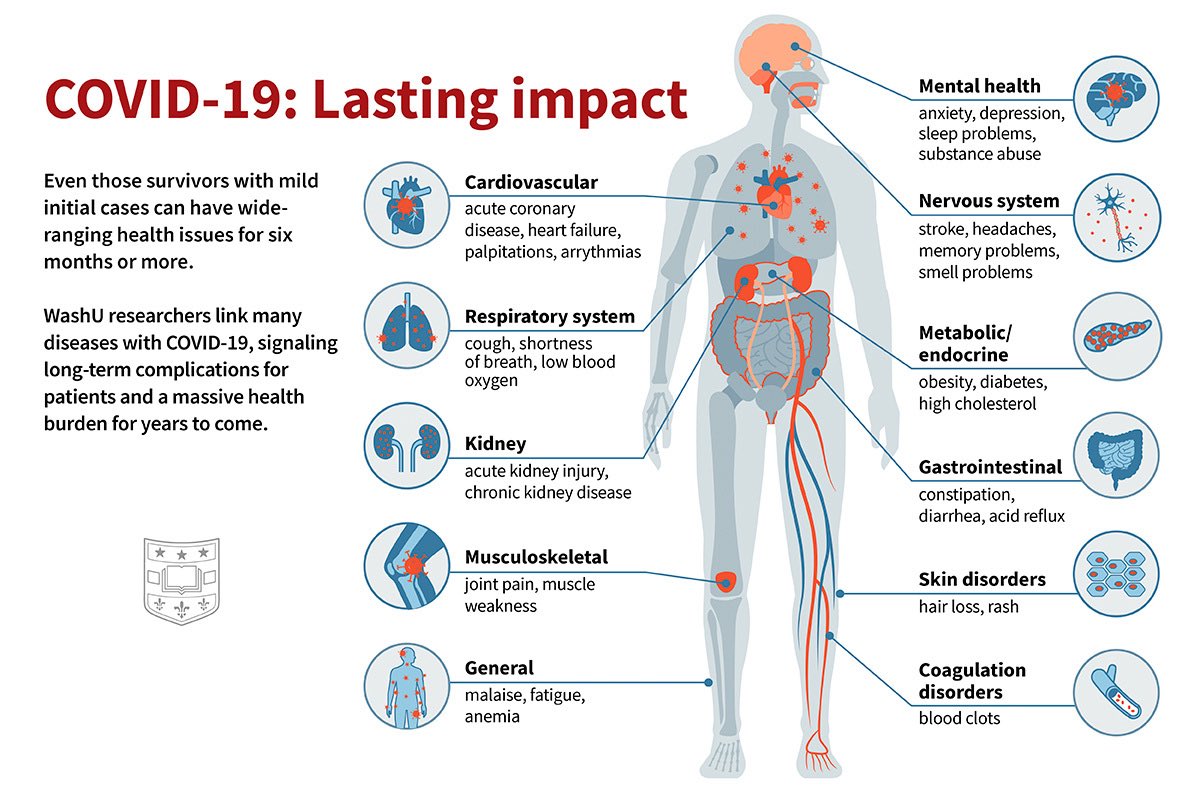
Another complication with diagnosis is that some Covid damage may be invisible at first.
Studies show that Covid can affect organs including the heart, brain & kidneys…
…but you may not notice anything immediately…
…until problems appear months or even years later.
/6
Studies show that Covid can affect organs including the heart, brain & kidneys…
…but you may not notice anything immediately…
…until problems appear months or even years later.
/6
https://twitter.com/zalaly/status/1760741448025264428
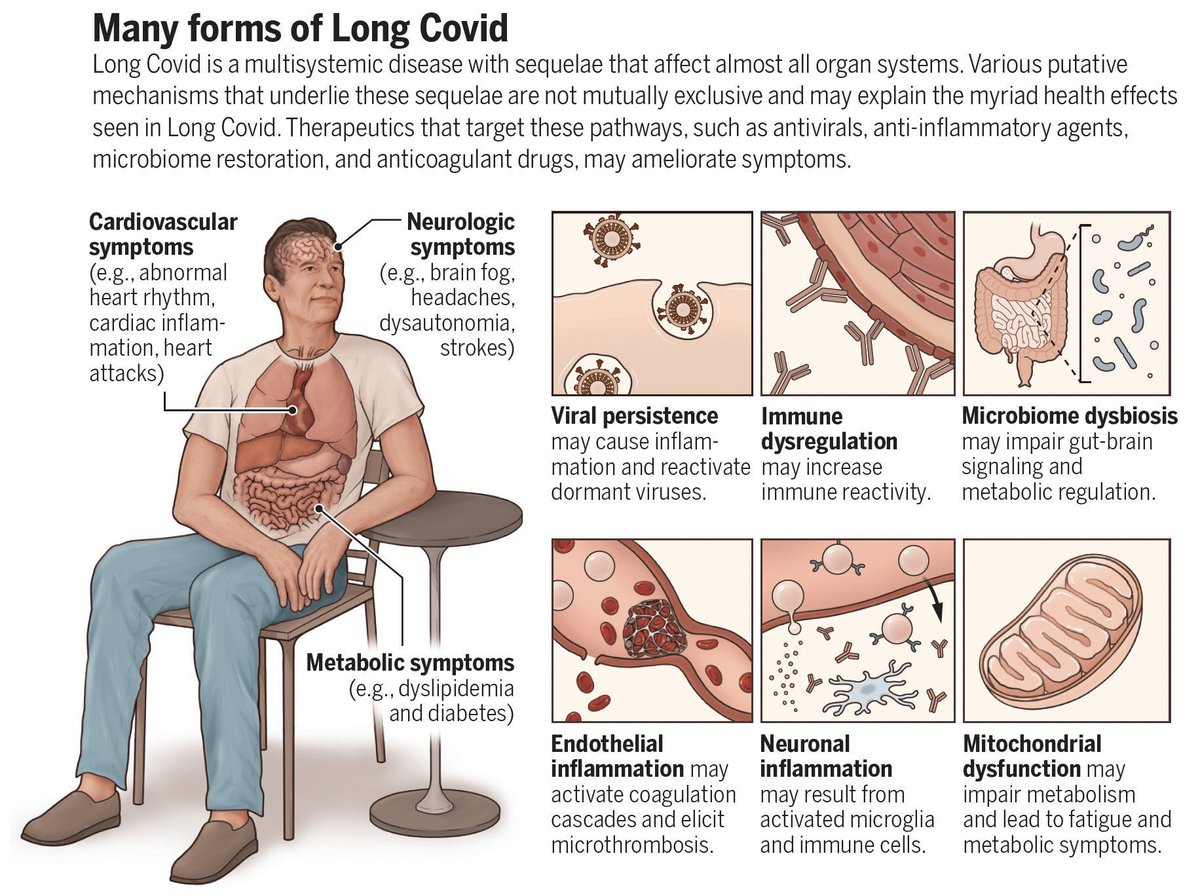
Many of the conditions linked to Covid are long-term diseases:
🫀 cardiovascular disease
🧠 neurological conditions
🚨metabolic conditions (eg. diabetes)
Some of these can develop slowly after infection… and wouldn’t necessarily be attributed to a past Covid infection.
/7
🫀 cardiovascular disease
🧠 neurological conditions
🚨metabolic conditions (eg. diabetes)
Some of these can develop slowly after infection… and wouldn’t necessarily be attributed to a past Covid infection.
/7
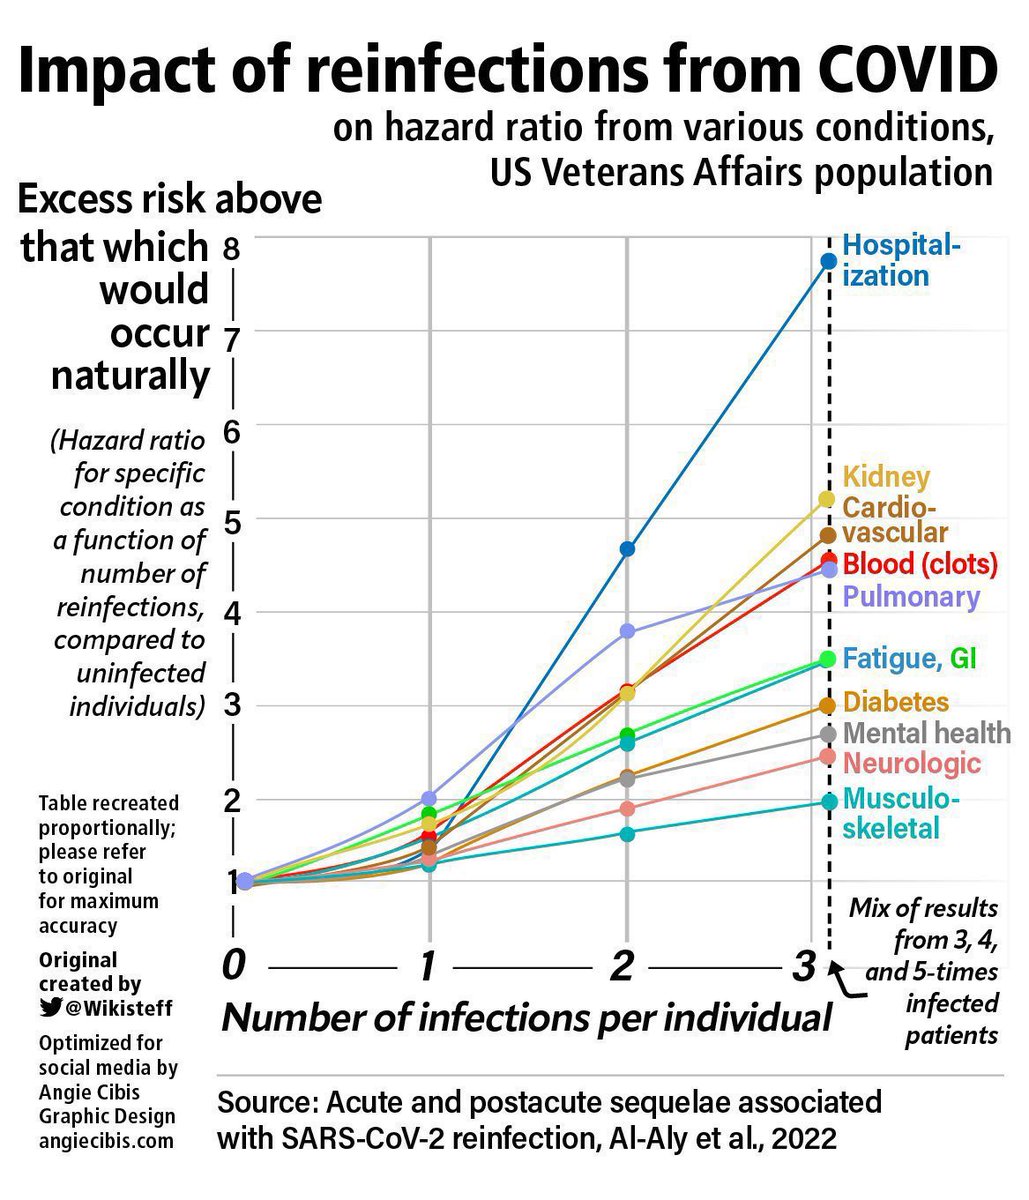
At an individual level, it can be hard to prove that something like heart attack is linked to a past Covid infection.
But large-scale studies show that the cumulative risk of developing long-term health conditions increases with each Covid infection.
/8 nature.com/articles/s4159…
But large-scale studies show that the cumulative risk of developing long-term health conditions increases with each Covid infection.
/8 nature.com/articles/s4159…
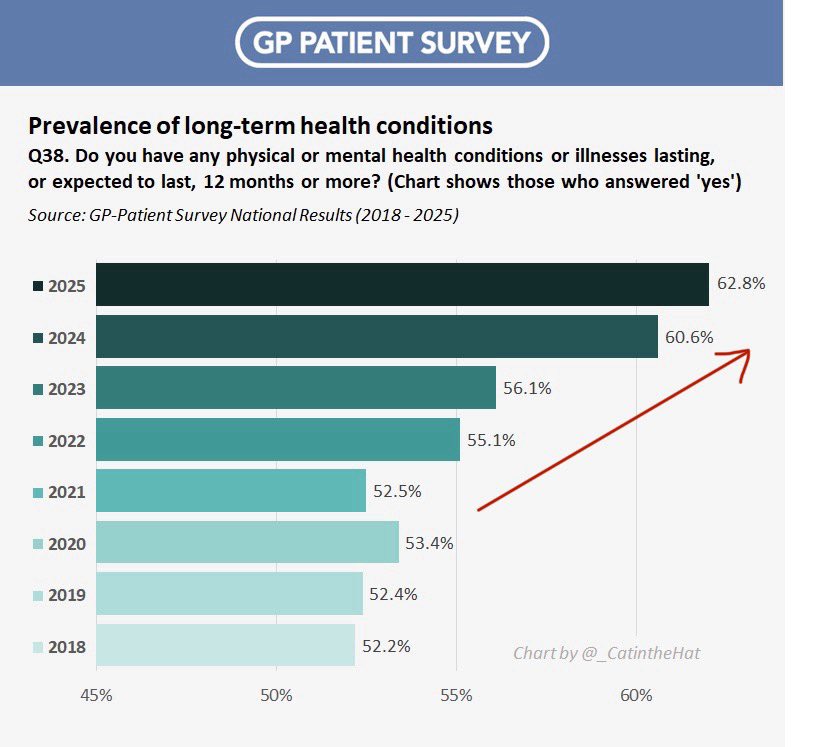
And we can see this coming through loud & clear in the GP-Patient survey data too!
This chart shows prevalence of long-term health conditions in England.
It was pretty stable at ~52% up to 2021.
But then all Covid mitigations were axed…
…and look 👀 what happened next.
/9
This chart shows prevalence of long-term health conditions in England.
It was pretty stable at ~52% up to 2021.
But then all Covid mitigations were axed…
…and look 👀 what happened next.
/9

Seriously. Just stop for a moment and take a proper look at that chart.
The trend couldn’t be clearer.
Prevalence of long-term health conditions has increased by a staggering 20% since 2019.
That should be ringing some serious alarm bells with the government.
/10
The trend couldn’t be clearer.
Prevalence of long-term health conditions has increased by a staggering 20% since 2019.
That should be ringing some serious alarm bells with the government.
/10
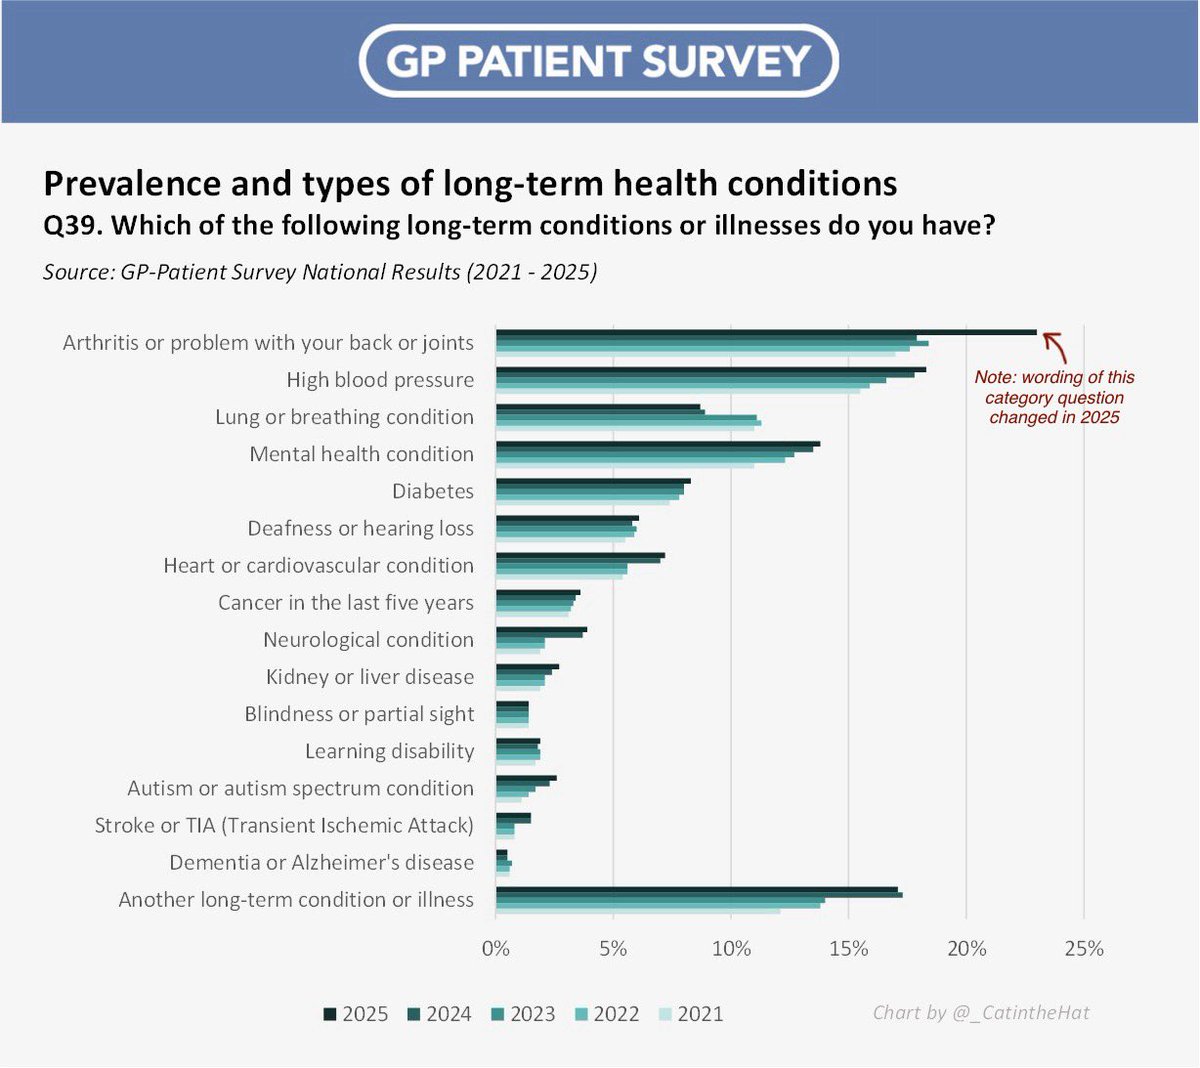
Now let’s dig a little deeper into the GP-Patient survey and look at which *specific* long-term health conditions have seen the biggest increases.
It’s a lot of the conditions that are known to be triggered & exacerbated by Covid…
/11
It’s a lot of the conditions that are known to be triggered & exacerbated by Covid…
/11

Take a look at the rises for these conditions:
▪️high blood pressure
▪️mental health
▪️diabetes
▪️heart/vascular condition
▪️neurological condition
▪️kidney/liver disease
▪️stroke
▪️other long-term condition (which would include long Covid)
/12
▪️high blood pressure
▪️mental health
▪️diabetes
▪️heart/vascular condition
▪️neurological condition
▪️kidney/liver disease
▪️stroke
▪️other long-term condition (which would include long Covid)
/12
The sharp upward trend in prevalence of long-term health conditions is rather reminiscent of another chart…
This chart shows the number of working age adults in the UK who have now been forced to drop out of the workplace due to long-term sickness.
/13
This chart shows the number of working age adults in the UK who have now been forced to drop out of the workplace due to long-term sickness.
/13

And it’s not just happening here in the UK.
The chart below shows UK data 🇬🇧 (working age adults who are out of work due to long-term sickness)…
…alongside US data 🇺🇸 (adults reporting a disability).
Two countries. Two charts.
A very similar (and concerning) trend.
/14
The chart below shows UK data 🇬🇧 (working age adults who are out of work due to long-term sickness)…
…alongside US data 🇺🇸 (adults reporting a disability).
Two countries. Two charts.
A very similar (and concerning) trend.
/14

Here’s @jim_reed, the BBC’s health reporter, speaking on BBC Radio 5 Live:
“Almost every expert out there thinks <Long COVID> is a very important factor in explaining why we’ve seen this rise over the past 4-5 years in people who are off work long-term sick”.
/15
“Almost every expert out there thinks <Long COVID> is a very important factor in explaining why we’ve seen this rise over the past 4-5 years in people who are off work long-term sick”.
/15
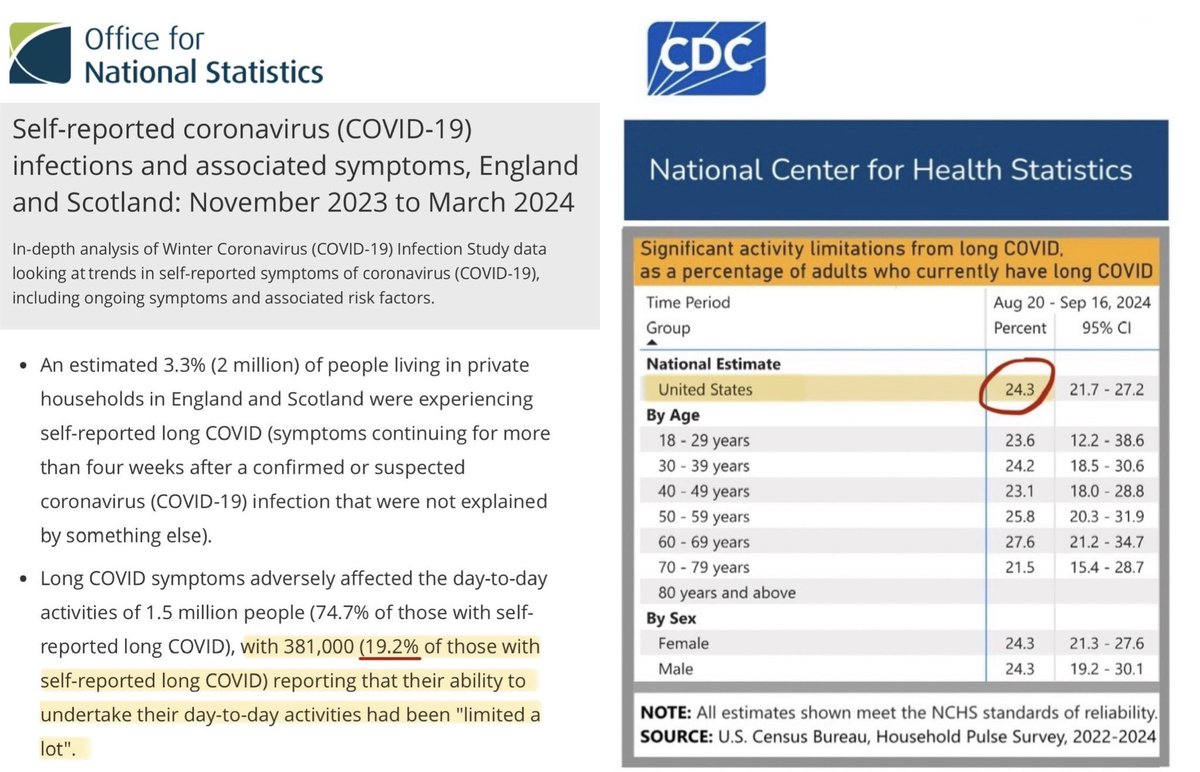
And other studies demonstrate this clearly too…
National data from both the UK (ONS) & US (CDC) suggests that roughly 1 in 5 of those affected by Long Covid will be SEVERELY debilitated, with their ability to undertake basic day-to-day activities limited a LOT.
/16
National data from both the UK (ONS) & US (CDC) suggests that roughly 1 in 5 of those affected by Long Covid will be SEVERELY debilitated, with their ability to undertake basic day-to-day activities limited a LOT.
/16
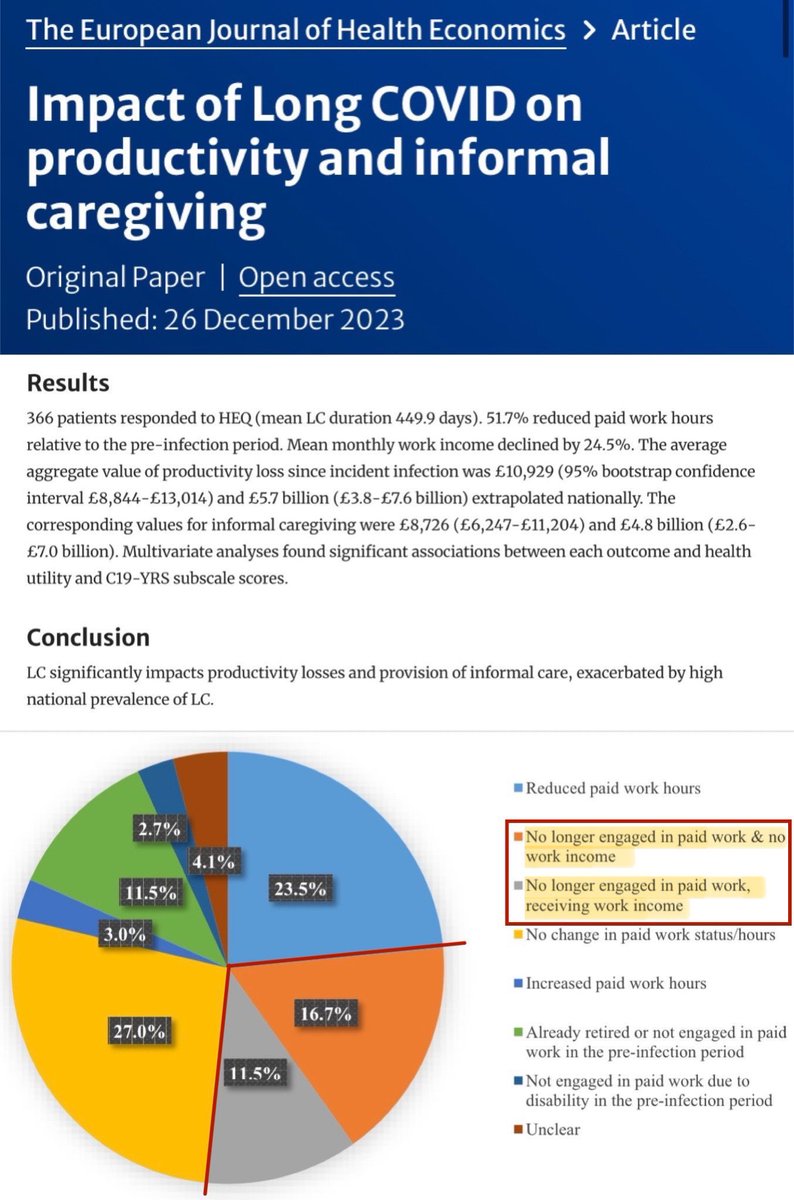
And, in Dec 2023, the UK LOCOMOTION study published an important paper warning that:
🚨28% of Long Covid patients in their study had been forced to stop working altogether 🟠⚪️
🚨A further 23.5% of LC patients had reduced their paid work hours 🔵
/17 evidence.nihr.ac.uk/alert/how-much
🚨28% of Long Covid patients in their study had been forced to stop working altogether 🟠⚪️
🚨A further 23.5% of LC patients had reduced their paid work hours 🔵
/17 evidence.nihr.ac.uk/alert/how-much
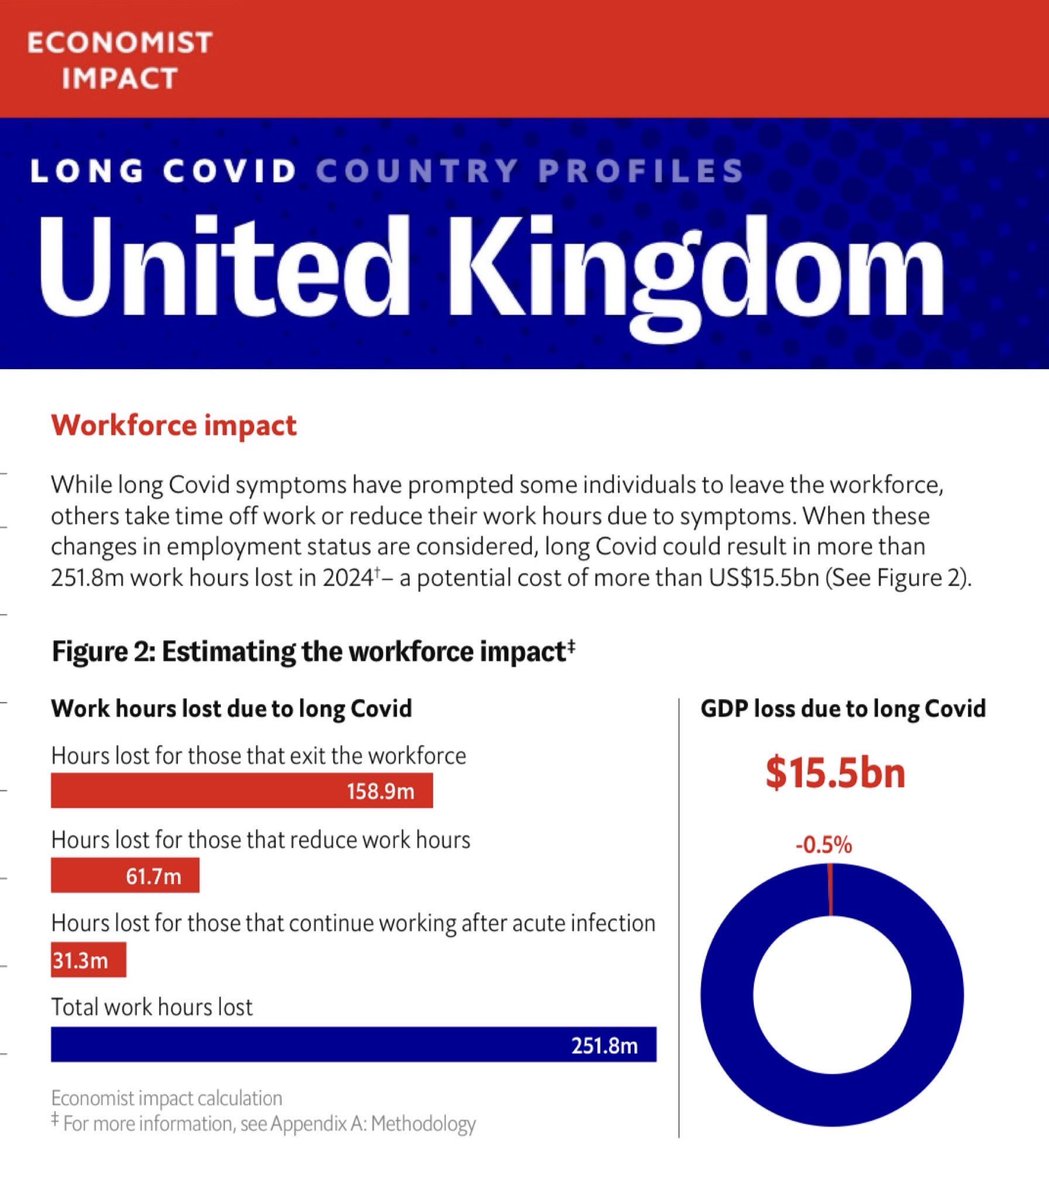
In April 2024, an Economist Impact report warned that:
🚨251.8 MILLION work hours may be lost in the UK in 2024 due to Long Covid.
🚨The economic cost was estimated to be over US$15.5 BILLION, equivalent to 0.5% of the UK’s GDP.
/18 impact.economist.com/health-society…
🚨251.8 MILLION work hours may be lost in the UK in 2024 due to Long Covid.
🚨The economic cost was estimated to be over US$15.5 BILLION, equivalent to 0.5% of the UK’s GDP.
/18 impact.economist.com/health-society…
Scientists around the world warned repeatedly that Long Covid would be a ‘mass disabling event’.
Tragically, it seems we are now watching that unfold in real time.
The consequences of not taking this seriously will be enormous, for both the health & economy of our nation.
/19
Tragically, it seems we are now watching that unfold in real time.
The consequences of not taking this seriously will be enormous, for both the health & economy of our nation.
/19

The best time to have done something about this was 6 years ago…
…but the next best time is NOW!
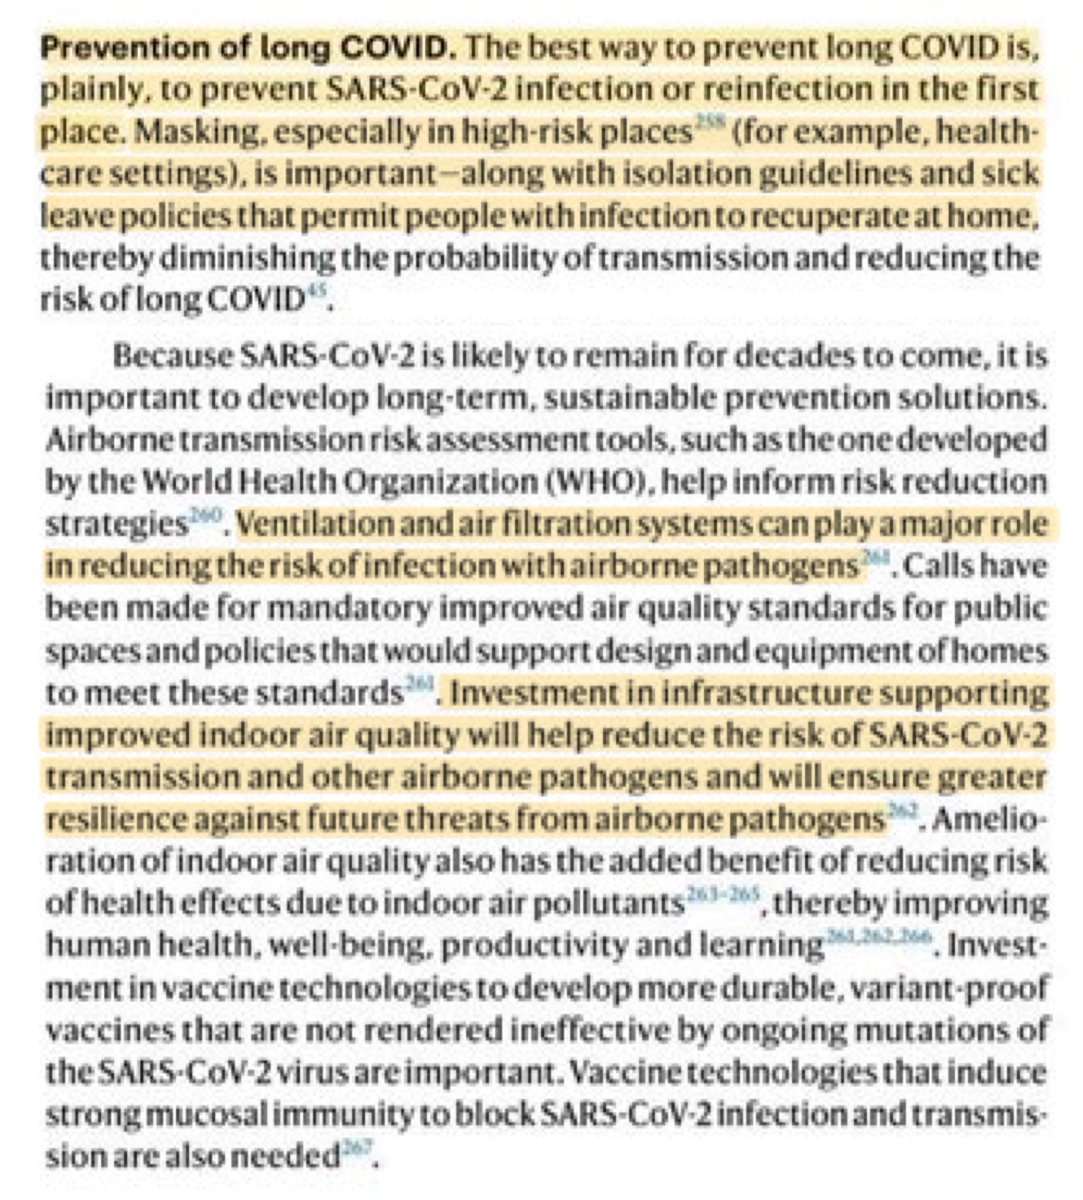
And it’s important to remember:
PREVENTION IS BETTER THAN CURE
(especially when there is no cure).
Masks, ventilation & air filtration are key.
nature.com/articles/s4159…
/20 x.com/zalaly/status/…
…but the next best time is NOW!
And it’s important to remember:
PREVENTION IS BETTER THAN CURE
(especially when there is no cure).
Masks, ventilation & air filtration are key.
nature.com/articles/s4159…
/20 x.com/zalaly/status/…
Final note: The charts of the GP-Patient survey data in this thread were created by me. They are not official charts from the survey report…
…and that’s because the data on prevalence of Long Covid (Q40) was curiously *left out* of the national report.
gp-patient.co.uk/latest-survey/…
…and that’s because the data on prevalence of Long Covid (Q40) was curiously *left out* of the national report.
gp-patient.co.uk/latest-survey/…
Luckily, data from the Long Covid question (Q40) is still available in the raw data files which is how I’ve been able to create my chart.
However, these LC stats will have been seen by very few people unless they’ve been digging around in the raw data.
gp-patient.co.uk/FileDownload/D…
However, these LC stats will have been seen by very few people unless they’ve been digging around in the raw data.
gp-patient.co.uk/FileDownload/D…

It’s also worth noting that the Long Covid question *was* included in the National reports in previous years…
…so, somewhere along the line, an intentional decision was made to REMOVE it for the 2025 report.
Why? 🤔
gp-patient.co.uk/past-survey-re…
…so, somewhere along the line, an intentional decision was made to REMOVE it for the 2025 report.
Why? 🤔
gp-patient.co.uk/past-survey-re…
• • •
Missing some Tweet in this thread? You can try to
force a refresh