This strategy has delivered 18% annual returns since 1926.
No black box. No complex ML model.
Just breakouts, trailing stops, and volatility sizing applied to industry portfolios.
Here's how it works (and link to the 37 page PDF):
No black box. No complex ML model.
Just breakouts, trailing stops, and volatility sizing applied to industry portfolios.
Here's how it works (and link to the 37 page PDF):
─────────────────
🔹 THE ENTRIES
─────────────────
A long position triggers when an industry breaks above either:
• A Donchian Channel (20-day high, 40-day lower band)
• A Keltner Channel (20-day EMA ± 1.4× ATR, 40-day lower band)
The asymmetric lookback keeps you invested during sustained trends.
No short positions. When nothing is trending, capital sits in T-bills.
─────────────────
🔹 THE EXITS
─────────────────
Trailing stop = the higher of the 40-day Donchian or Keltner lower band.
Once it moves up, it never moves back down.
Winners run. Losers get cut fast.
🔹 THE EXITS
─────────────────
Trailing stop = the higher of the 40-day Donchian or Keltner lower band.
Once it moves up, it never moves back down.
Winners run. Losers get cut fast.
─────────────────
🔹 THE SIZING
─────────────────
Volatility-targeted. Each position is sized inversely to its 14-day volatility.
More volatile industry = smaller position.
Total exposure capped at 200%.
🔹 THE SIZING
─────────────────
Volatility-targeted. Each position is sized inversely to its 14-day volatility.
More volatile industry = smaller position.
Total exposure capped at 200%.
─────────────────
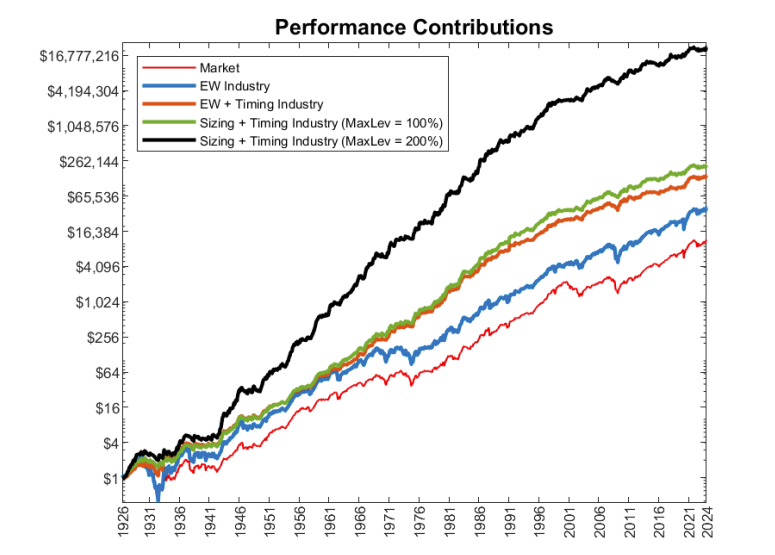
🔹 THE RESULTS (1926–2024)
─────────────────
• 18.2% annualized return vs. 9.7% for passive equities
• Sharpe ratio of 1.39 vs. 0.63 for the market
• Max drawdown of 33% vs. 84% for equities
• Upside beta of 1.16, downside beta of 0.31
🔹 THE RESULTS (1926–2024)
─────────────────
• 18.2% annualized return vs. 9.7% for passive equities
• Sharpe ratio of 1.39 vs. 0.63 for the market
• Max drawdown of 33% vs. 84% for equities
• Upside beta of 1.16, downside beta of 0.31
Get the 37 page PDF here:
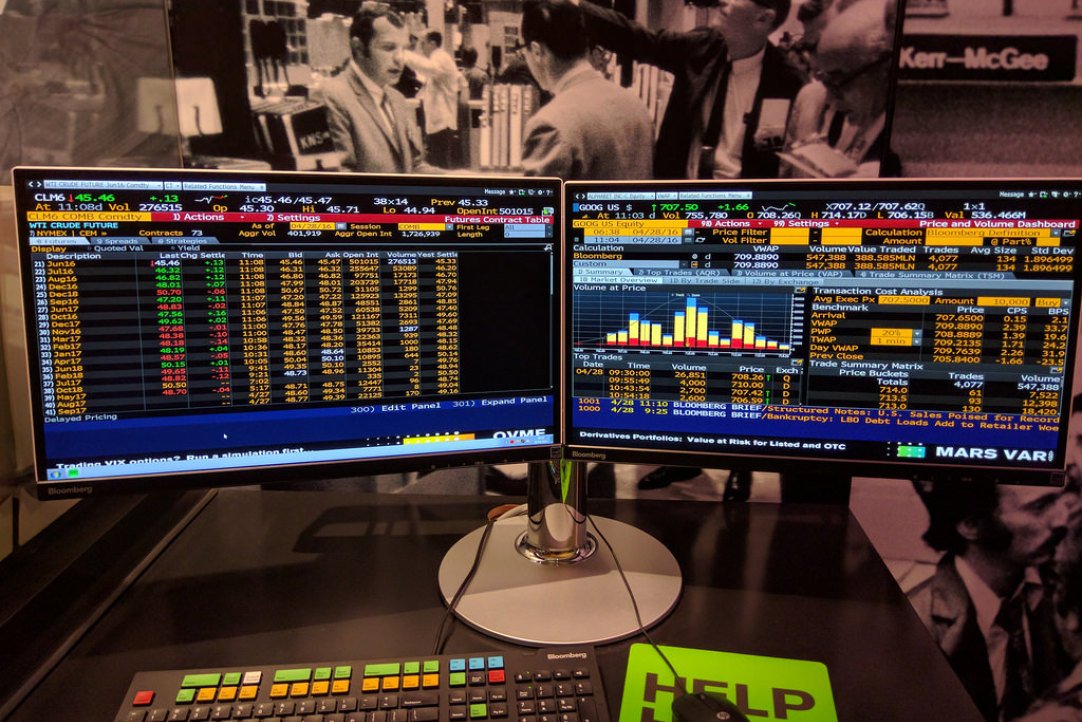
🚨Still trading manually in 2026?
You’re not alone. But the window to change that is closing.download.ssrn.com/2025/10/2/4857…
🚨Still trading manually in 2026?
You’re not alone. But the window to change that is closing.download.ssrn.com/2025/10/2/4857…
In 2026, traders are splitting into two groups:
Track 1: Manual traders. Chart watching. Indicator stacking. Hoping it works.
Track 2: Algorithmic operators. Tested strategies. Automated execution. Running while they sleep.
Track 1: Manual traders. Chart watching. Indicator stacking. Hoping it works.
Track 2: Algorithmic operators. Tested strategies. Automated execution. Running while they sleep.
I'm running a free live workshop that shows you the bridge from Track 1 → Track 2. Live Python demo + Q&A. 500 seats.
👉Register here (500 seats):  learn.quantscience.io/become-a-pro-q…
👉Register here (500 seats):  learn.quantscience.io/become-a-pro-q…
P.S. - Want Algorithmic Trading with Python tutorials every Sunday?
Register here to join our Sunday Quant Scientist Newsletter (it's free): learn.quantscience.io/quant-scientis…
Register here to join our Sunday Quant Scientist Newsletter (it's free): learn.quantscience.io/quant-scientis…
• • •
Missing some Tweet in this thread? You can try to
force a refresh