
PMC #COVID Update, March 23, 2026 (U.S.)
Transmission levels have plummeted nationally as we shift from the 12th wave toward a relative "lull."
Over half the states have "Very Low" relative transmission, per the CDC.
🧵THREAD 1 of 8
Transmission levels have plummeted nationally as we shift from the 12th wave toward a relative "lull."
Over half the states have "Very Low" relative transmission, per the CDC.
🧵THREAD 1 of 8

Transmission varies considerably by state.
Highest
🔥Mississippi: 1 in 31 estimated actively infectious
🔥Michigan: 1 in 41
*Both states w/limited data though
Rates are quite low in relative terms in California, AZ, FL, HI, ID, MA, NV, NY, OR, RI, UT, WI
🧵THREAD 2 of 8
Highest
🔥Mississippi: 1 in 31 estimated actively infectious
🔥Michigan: 1 in 41
*Both states w/limited data though
Rates are quite low in relative terms in California, AZ, FL, HI, ID, MA, NV, NY, OR, RI, UT, WI
🧵THREAD 2 of 8

The 6th anniversary of the WHO's pandemic declaration was March 11.
Bots, minimizers, & individuals' psychological defense mechanisms will downplay that.
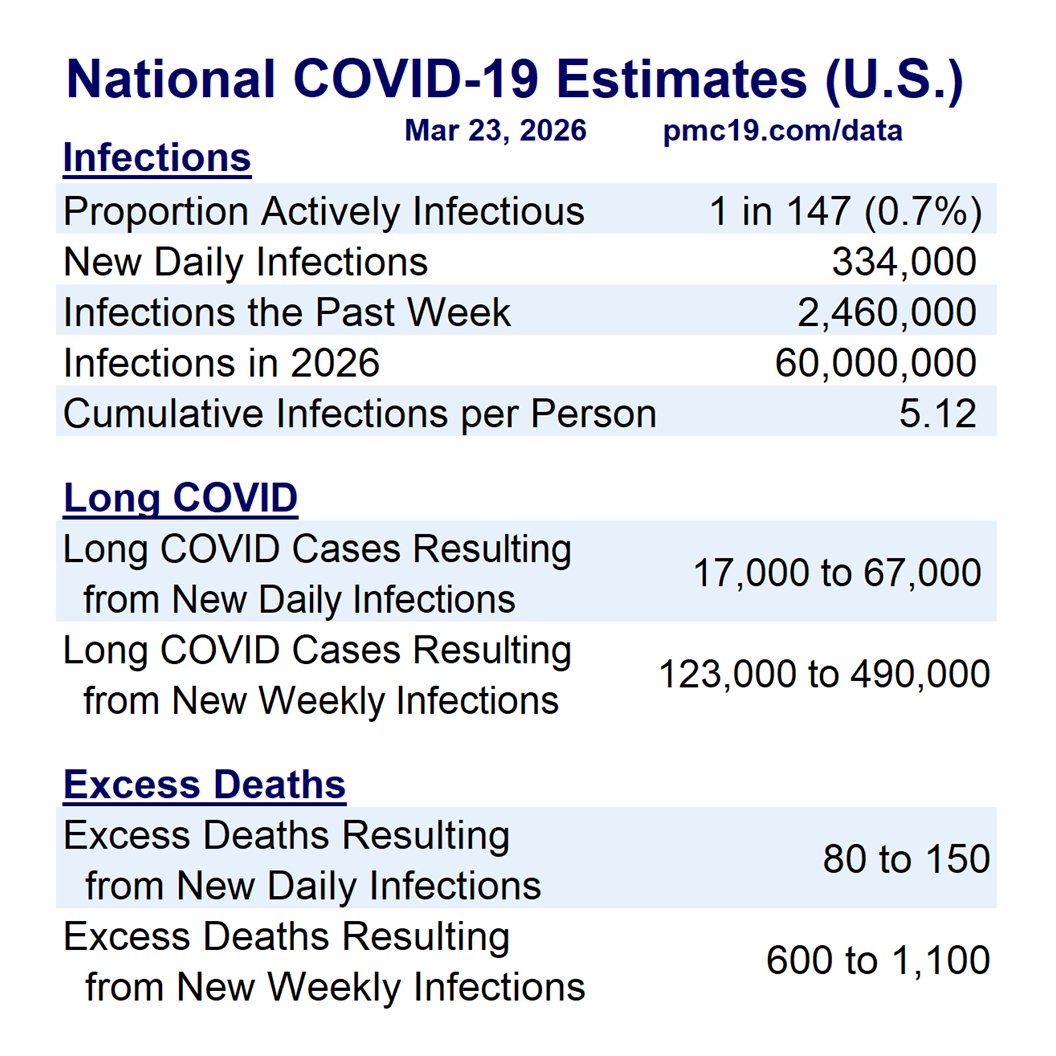
Yet, the U.S. just had a 12th wave. We estimate >5 cumulative infections/person & ongoing health harms.
🧵THREAD 3 of 8
Bots, minimizers, & individuals' psychological defense mechanisms will downplay that.
Yet, the U.S. just had a 12th wave. We estimate >5 cumulative infections/person & ongoing health harms.
🧵THREAD 3 of 8

Infections are THE metric that matters. Absent testing, wastewater provides the best indicator of infections.
Reinfections ⬆️cumulative #LongCOVID & mortality risk. ≈1,000 Americans are expected to die from this week's infections, per SRI-based estimates.
🧵THREAD 4 of 8
Reinfections ⬆️cumulative #LongCOVID & mortality risk. ≈1,000 Americans are expected to die from this week's infections, per SRI-based estimates.
🧵THREAD 4 of 8
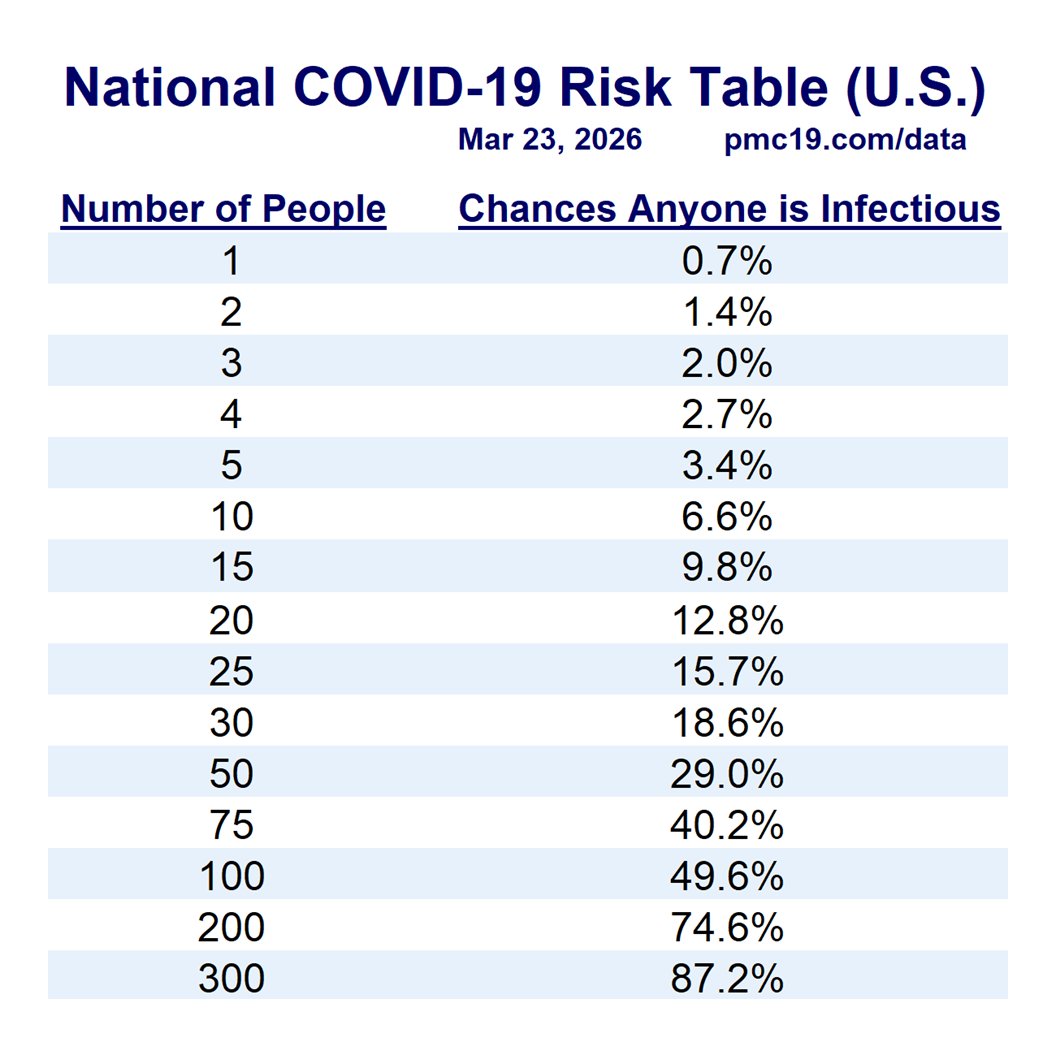
As we enter a relative "lull" in transmission at the national level, it is important to avoid overlooking the importance of group size.
In a large event with 100 people, it's still a coin-toss of a SARS-CoV-2 exposure if nobody is testing/isolating.
🧵THREAD 5 of 8
In a large event with 100 people, it's still a coin-toss of a SARS-CoV-2 exposure if nobody is testing/isolating.
🧵THREAD 5 of 8
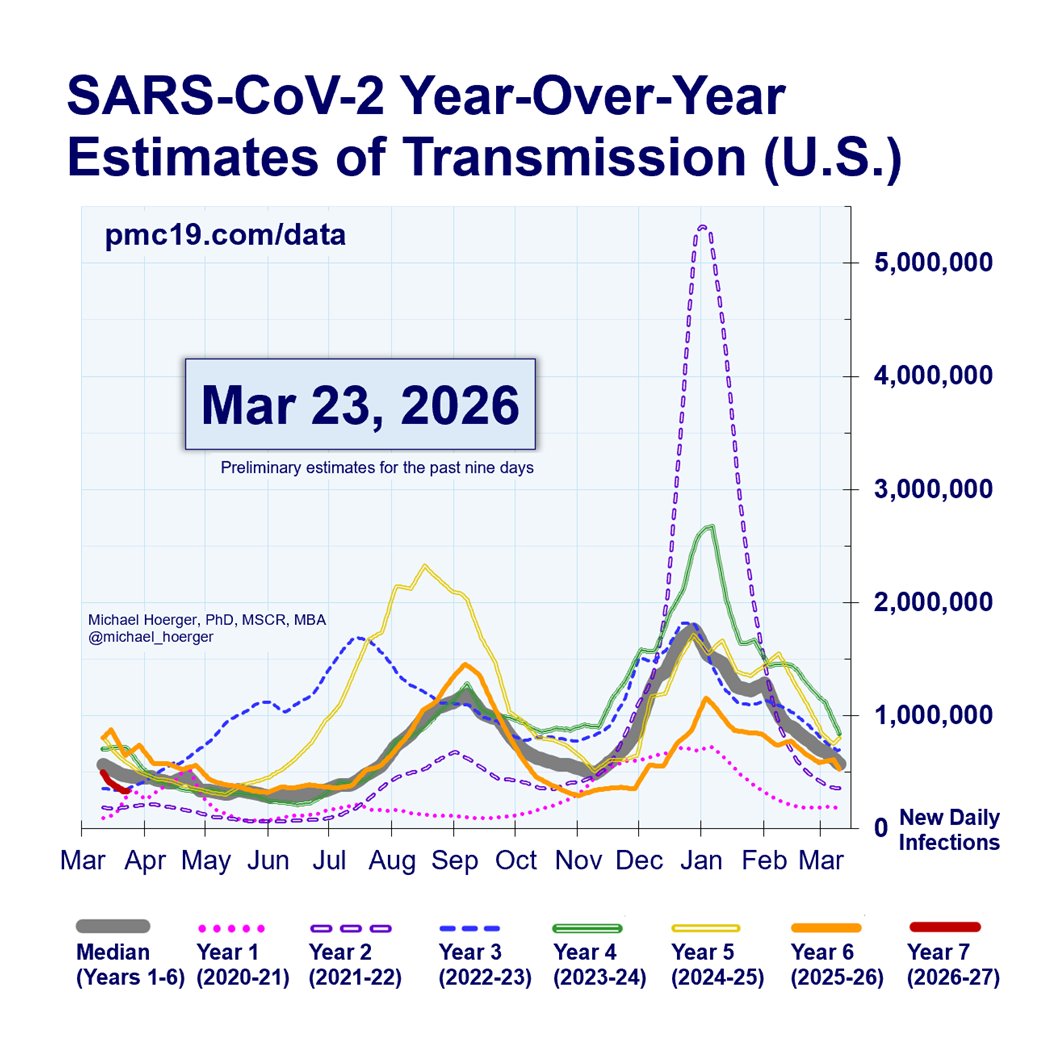
Wow, look at the SARS-CoV-2 "barometer."
Absolute risk remains, but this graph makes crystal clear that in most places risk is much lower than the past several months.
🟢Check the local data, and get moving. 🟢
🧵THREAD 6 of 8
Absolute risk remains, but this graph makes crystal clear that in most places risk is much lower than the past several months.
🟢Check the local data, and get moving. 🟢
🧵THREAD 6 of 8

We've now entered the start of the 7th year since the WHO's pandemic declaration. 🤪
The red line (tiny, bottom left) shows transmission continuing to decline. Look ahead the next few months to get a sense of summer variation in wave timing.
🧵THREAD 7 of 8
The red line (tiny, bottom left) shows transmission continuing to decline. Look ahead the next few months to get a sense of summer variation in wave timing.
🧵THREAD 7 of 8
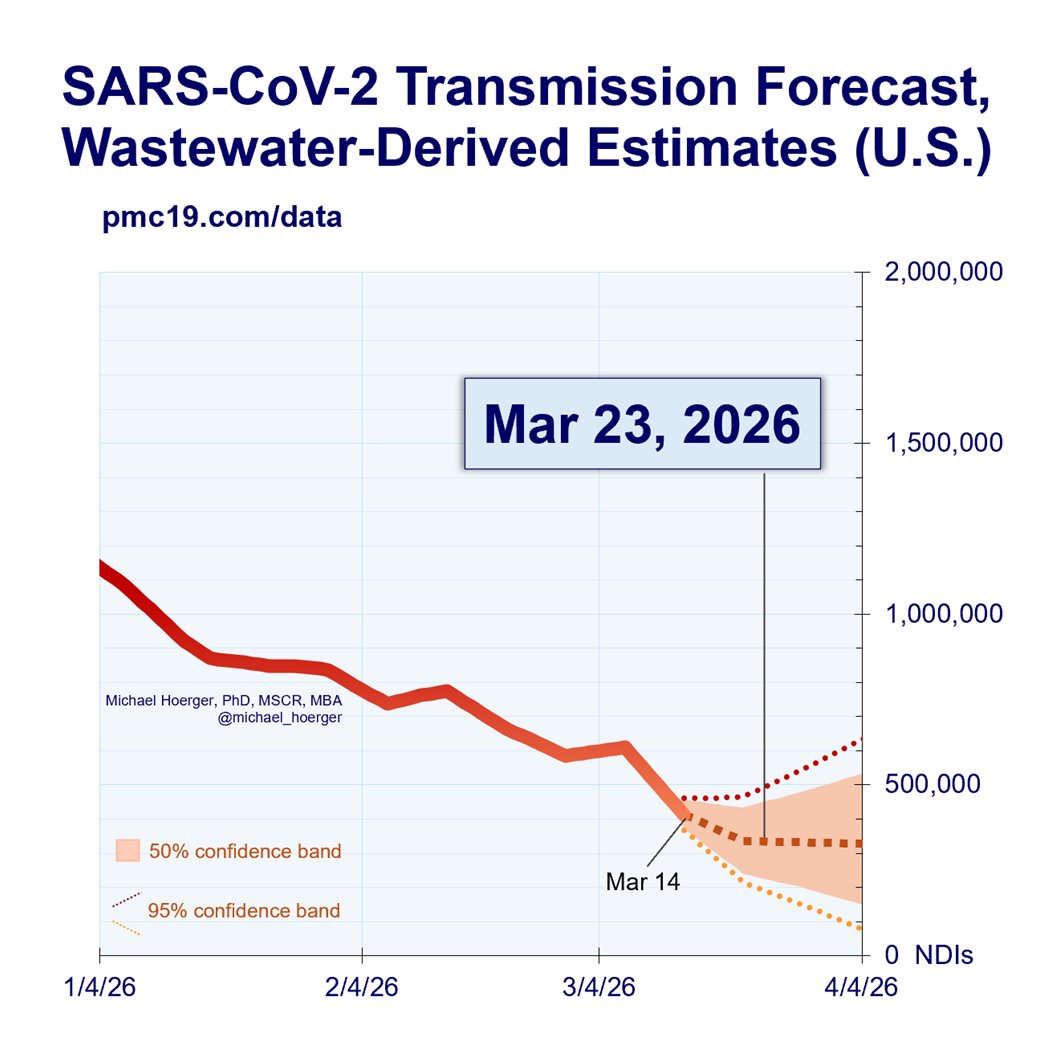
The current forecast is for steady to lightly declining transmission as we enter the relative "lull" in between the 12th and seemingly inevitable 13th U.S. COVlD wave.
🧵THREAD 8 of 8
🧵THREAD 8 of 8
• • •
Missing some Tweet in this thread? You can try to
force a refresh


