
This is an unethically misleading study with findings easily explained by residual confounding. Some health systems and patients have thorough record keeping. Others don't. All sorts of variables will correlate (infections, cancers, anything else tracked in medical records).
https://twitter.com/ahandvanish/status/2039815573249384645
This is a really obvious issue for an international epi study. It should not have been published.
The above study is using the same processes the anti-vaxxers use -- junk epi that does not account for confounding -- to support whatever pre-conceived notions the authors have, with absurdly large effects.
https://x.com/i/status/1976734316311744871
If you analyze data from 15 countries and 80 different health systems, you need to use multi-level modeling or meaningful control for variation across countries and systems. The absurdly large association between Covid infection and cancer (when cancers take a long time to develop) should have been a clue as to something fishy.
These are issues that should be obvious in undergrad-level observational epidemiology. The action editor should have desk rejected this paper in <30 seconds.
Let me walk you through a really basic example as non-technical as possible. Let's say Health System A is very organized, in highly-resourced country, massively resourced health system with million-dollar donors (MGB, DF, Mayo, or whatever). They will be more likely to have exquisite record keeping. They might track Covid infections better (and in the early pandemic had good access to testing!), and they will definitely track cancer test results very well.
Then, imagine Health System B. Let's say it's in a country with much fewer resources. Let's say there's no access to Covid testing, hardly at all. And perhaps the cancer test results and other records are mostly kept on paper files, but because they're a part of an international data collection system, the data get archived every 6-12 months. The archiving is slow and imperfect.
These are just very different systems in different contexts. If you have people across all different health systems and just do a correlation between Covid infection and cancer, you will get a strong positive signal *because of record keeping* (and because of many many many other 3rd variables). Some systems will track both well. Others won't have the resources to track as closely.
This is why you also see weird large effects in anti-vax studies (see the example in the prior post in this thread). The systems with resources to provide and track vaccines also have the resources to track cancers. The anti-vaxx paper using the same flawed sorts of analyses should also be retracted; I submitted a manuscript to the journal say as much, which of course, they rejected.
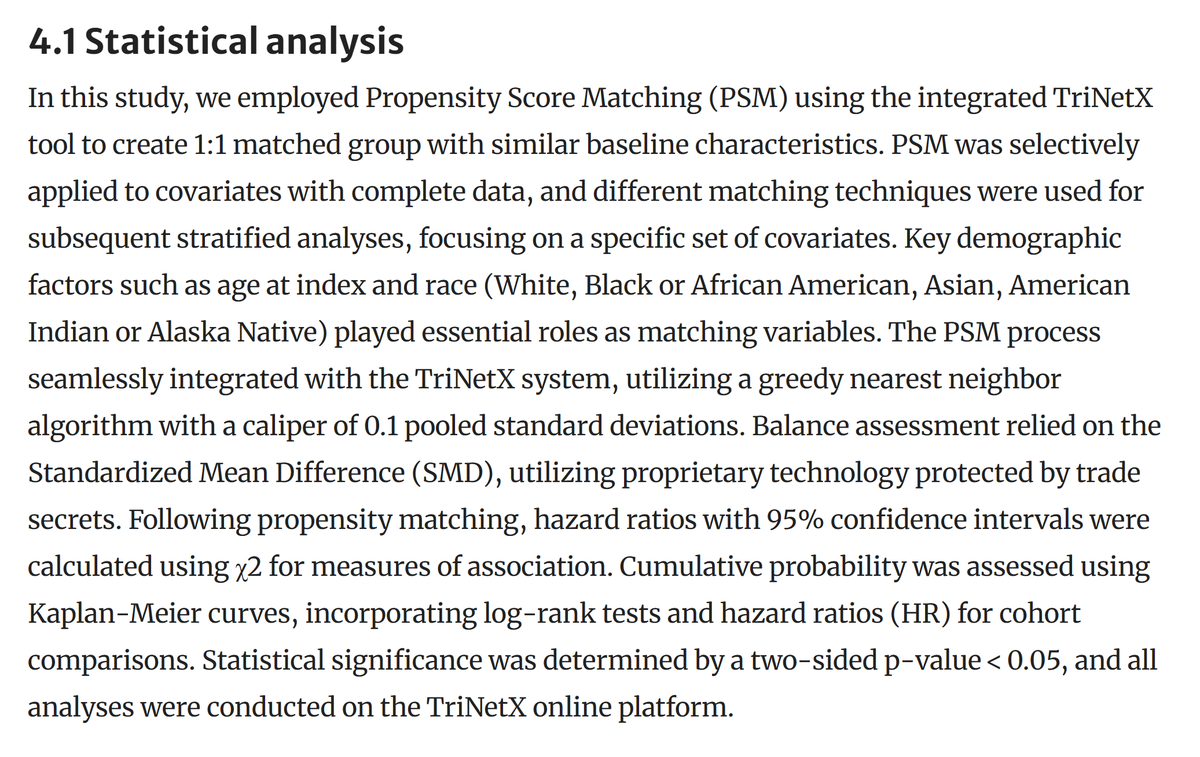
Turning back to the infection-cancer article.... The article's statistical analysis section is extremely short. They don't go into any of the issues I am raising. An observational epi paper should be analytically intensive. It's rare to see such an underdeveloped analytic section (and analyses) even in papers that are not analytically challenging. You'll notice some of this section appears to be AI written or AI massaged; it could just be through Grammarly or to assist with grammar more generally (I don't personally find that offensive, just a red flag that they might not know what they're doing anlytically), but as an example, there are phrases no scientist would really use, like "The PSM process was *seamlessly integrated*... using proprietary technology protect by trade secrets." It describes the analyses in ways that are direct, superficial, and insufficient for conveying what was done.
#Shih et al study
#Covid #Cancer #HPV
These are issues that should be obvious in undergrad-level observational epidemiology. The action editor should have desk rejected this paper in <30 seconds.
Let me walk you through a really basic example as non-technical as possible. Let's say Health System A is very organized, in highly-resourced country, massively resourced health system with million-dollar donors (MGB, DF, Mayo, or whatever). They will be more likely to have exquisite record keeping. They might track Covid infections better (and in the early pandemic had good access to testing!), and they will definitely track cancer test results very well.
Then, imagine Health System B. Let's say it's in a country with much fewer resources. Let's say there's no access to Covid testing, hardly at all. And perhaps the cancer test results and other records are mostly kept on paper files, but because they're a part of an international data collection system, the data get archived every 6-12 months. The archiving is slow and imperfect.
These are just very different systems in different contexts. If you have people across all different health systems and just do a correlation between Covid infection and cancer, you will get a strong positive signal *because of record keeping* (and because of many many many other 3rd variables). Some systems will track both well. Others won't have the resources to track as closely.
This is why you also see weird large effects in anti-vax studies (see the example in the prior post in this thread). The systems with resources to provide and track vaccines also have the resources to track cancers. The anti-vaxx paper using the same flawed sorts of analyses should also be retracted; I submitted a manuscript to the journal say as much, which of course, they rejected.
Turning back to the infection-cancer article.... The article's statistical analysis section is extremely short. They don't go into any of the issues I am raising. An observational epi paper should be analytically intensive. It's rare to see such an underdeveloped analytic section (and analyses) even in papers that are not analytically challenging. You'll notice some of this section appears to be AI written or AI massaged; it could just be through Grammarly or to assist with grammar more generally (I don't personally find that offensive, just a red flag that they might not know what they're doing anlytically), but as an example, there are phrases no scientist would really use, like "The PSM process was *seamlessly integrated*... using proprietary technology protect by trade secrets." It describes the analyses in ways that are direct, superficial, and insufficient for conveying what was done.
#Shih et al study
#Covid #Cancer #HPV
• • •
Missing some Tweet in this thread? You can try to
force a refresh


