What is RTM?
RTM captures institutional order flow.
Flow large enough to actually move indexes.
It's not dealer hedging flow, but there are similarities
(and it pairs really, really well with VS3D hedging data)
Here's what RTM is >>
RTM captures institutional order flow.
Flow large enough to actually move indexes.
It's not dealer hedging flow, but there are similarities
(and it pairs really, really well with VS3D hedging data)
Here's what RTM is >>

RTM is a premium retail day-trading community and a proprietary algorithmic model known.
The signals from the model are streamed over a private Zoom call with live intraday commentary from both TC & Scotty.
The signals from the model are streamed over a private Zoom call with live intraday commentary from both TC & Scotty.
Alongside the RTM model we stream the VS3D intraday SPX hedging profile, and I (VolSignals) provide access to my intraday commentary from VS Pro, and whenever possible- join the live conversation on stream too.
Convergence between models is excellent- but this thread is about RTM's specific signals
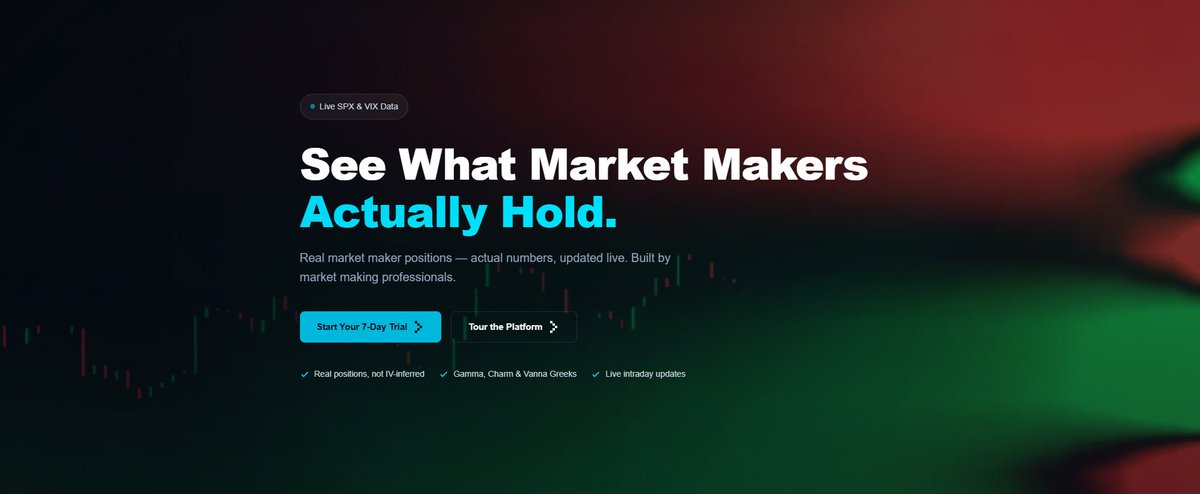
We stream real-time, institutional-grade market microstructure data for trading the S&P 500 (SPX options and /ES futures).
It's perfect for futures traders.
It's perfect for 0DTE traders.
We stream real-time, institutional-grade market microstructure data for trading the S&P 500 (SPX options and /ES futures).
It's perfect for futures traders.
It's perfect for 0DTE traders.
Key signals from the model
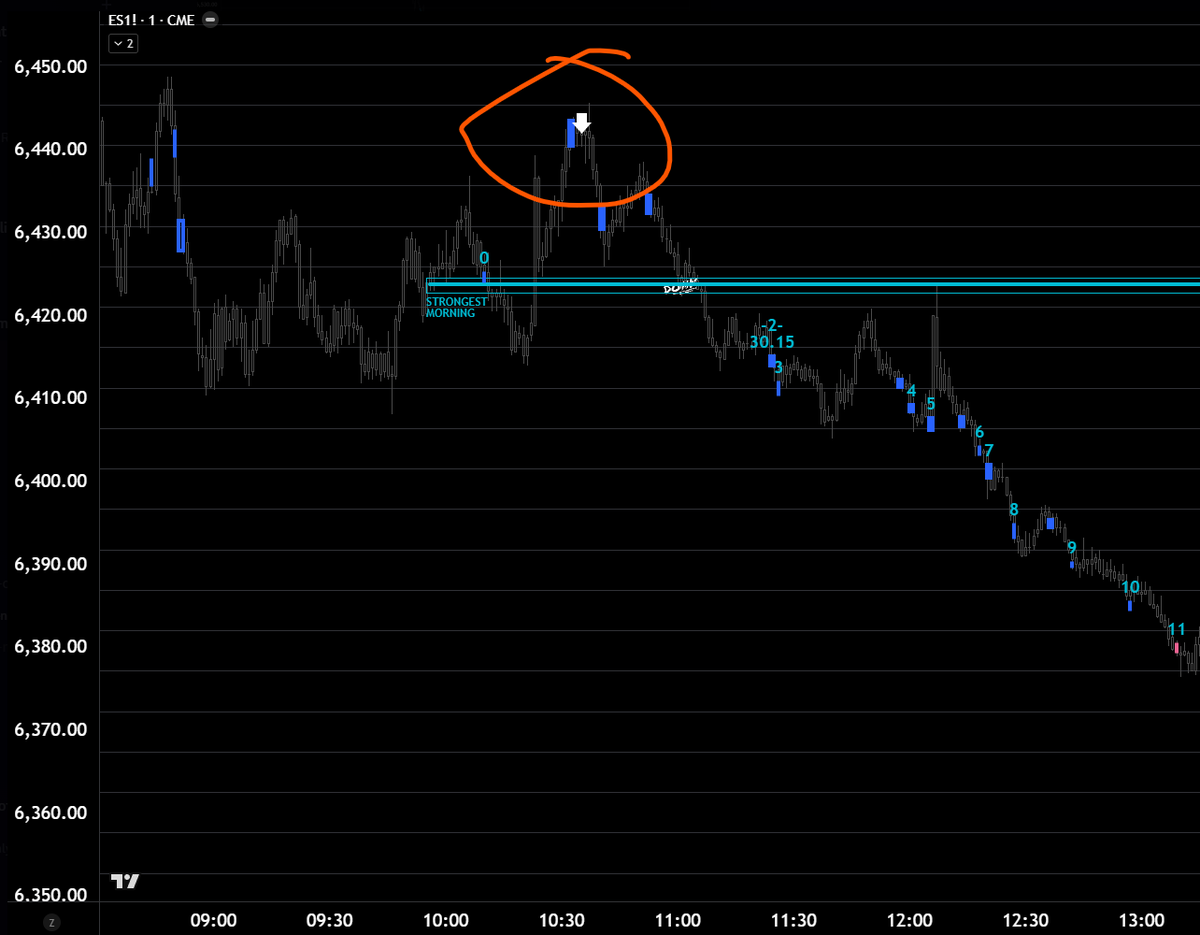
The "Lines" (SML/SAL):
The model calculates a "Strongest Morning Line" and "Strongest Afternoon Line," which act as institutional equilibrium areas where price is expected to either magnetically revert to or aggressively trend away from.
The "Lines" (SML/SAL):
The model calculates a "Strongest Morning Line" and "Strongest Afternoon Line," which act as institutional equilibrium areas where price is expected to either magnetically revert to or aggressively trend away from.
These lines often produce market outcomes that look just like what happens when we PIN key SPX inventory.
When lines show up aligned with dealer PIN inventory
...excellent
When lines show up aligned with dealer PIN inventory
...excellent
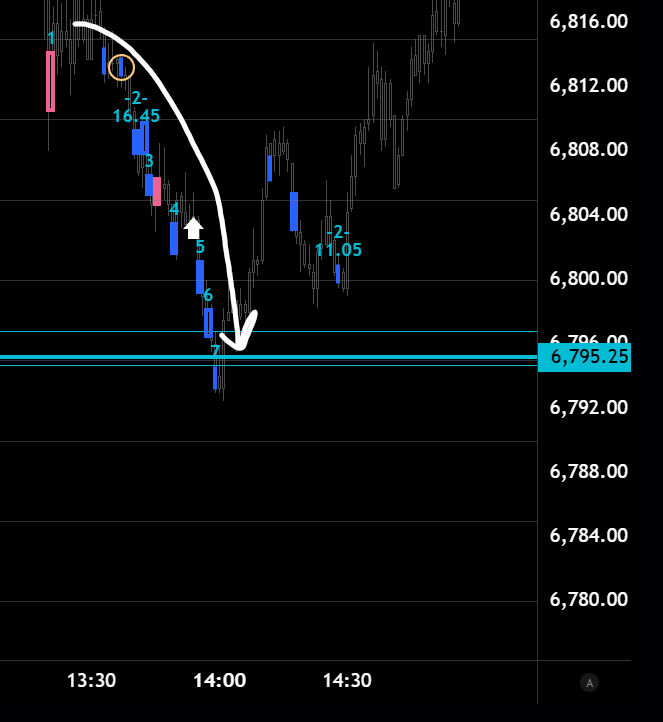
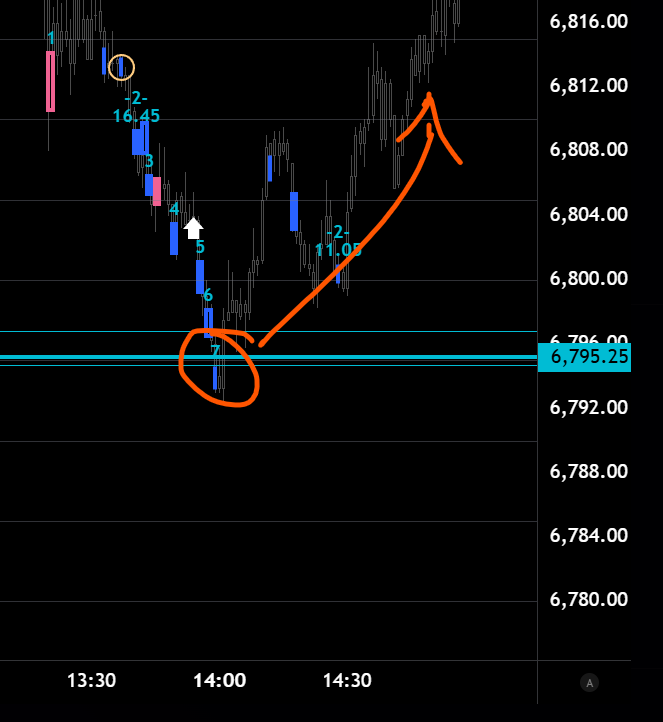
Box Prints (e.g., 2-Box, 7-Box):
Boxes reflect specific activity in the index-related assets we track, occurring at a certain level and time.
When these boxes appear sequentially they indicate trend or exhaustion.
Certain types of boxes have proven "different" than others, over time... e.g., a "7 Box" near the SML indicates a high probability of mean reversion
AP Callouts & White Arrows:
Real-time tracking of "Authorized Participant" (institutional) buying and selling pressure, and directional 'counter-trend' arrows often flag sharp, imminent moves during the session.
Real-time tracking of "Authorized Participant" (institutional) buying and selling pressure, and directional 'counter-trend' arrows often flag sharp, imminent moves during the session.
Market Regimes:
The model explicitly categorizes the market into environments like "Secular Mean Reversion" (SMR) and "Secular Trending Mode" (STM) to dictate trading strategies.
The model explicitly categorizes the market into environments like "Secular Mean Reversion" (SMR) and "Secular Trending Mode" (STM) to dictate trading strategies.
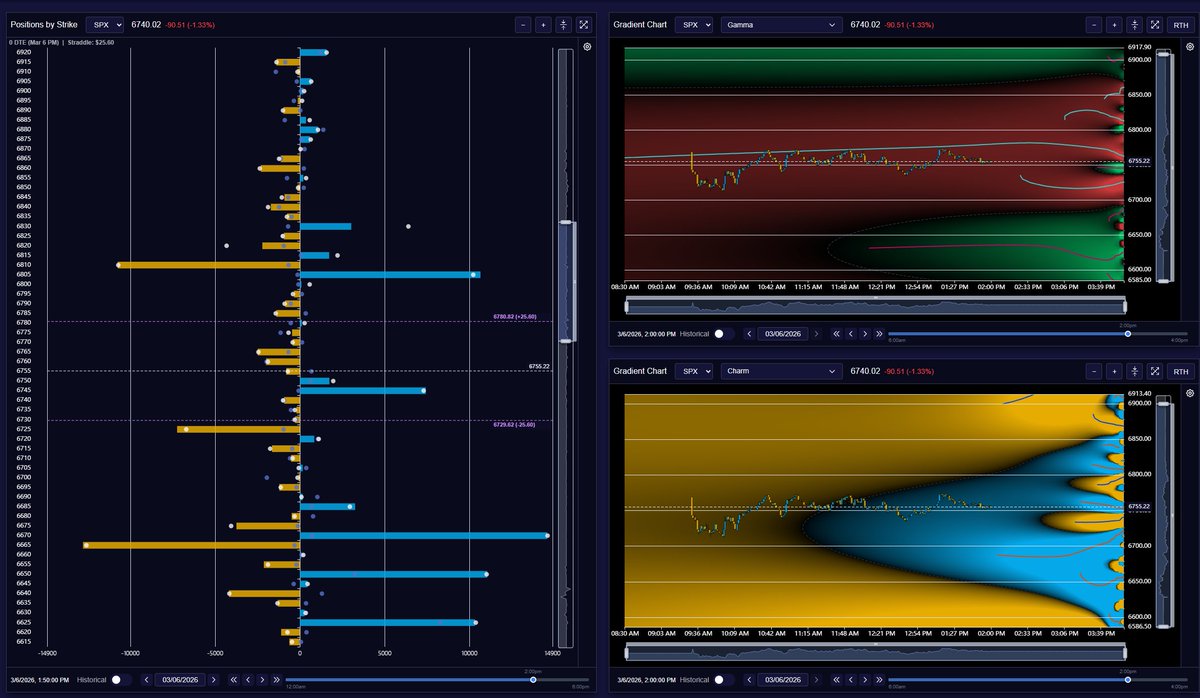
Our Pricing Bot streams intraday options context from the 0DTE profile, adding insight about the market's expected moves as well as pricing convex strategies that exploit the signals from the model.
The RTM model is one of the sharpest models I've seen, especially when paired alongside our dealer hedging flow data
and we're upgrading it.
and we're upgrading it.
JOIN TONIGHT AT 7PM EST ON ZOOM >>
and learn all about RTM and the latest upgrade
us06web.zoom.us/j/84599931391
and learn all about RTM and the latest upgrade
us06web.zoom.us/j/84599931391
RTM isn't for tourists.
If you're a serious trader- or aspiring to become one, then it may be a perfect fit.
Trials start each Monday and run all week.
Sign up here and start with us tomorrow ~
volsignals.com/rtm
If you're a serious trader- or aspiring to become one, then it may be a perfect fit.
Trials start each Monday and run all week.
Sign up here and start with us tomorrow ~
volsignals.com/rtm
• • •
Missing some Tweet in this thread? You can try to
force a refresh