"Two people have lost a High Court challenge against the Metropolitan Police over its use of live facial recognition technology (LFR) in London" #livefacialrecognition bbc.co.uk/news/articles/…
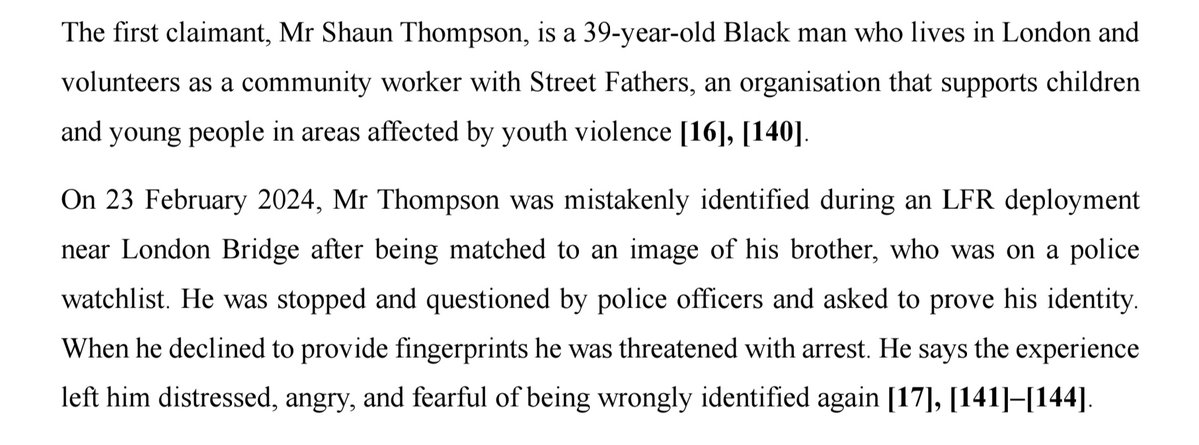
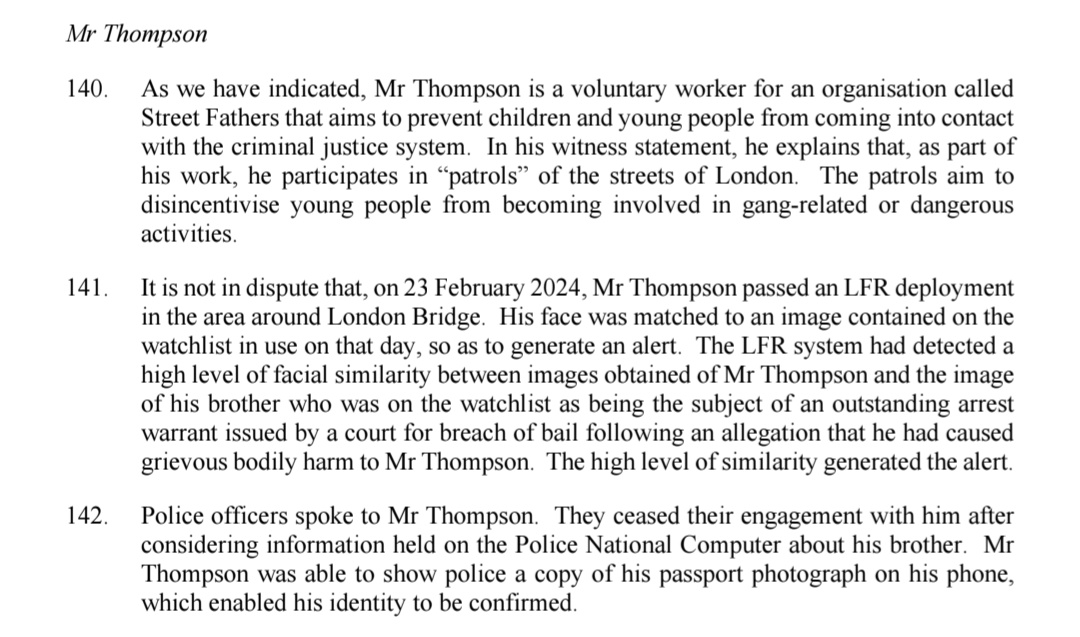
From the press summary - I don't think I have seen these details reported before - Mr Thompson was mistakenly identified as a match to his brother, who was on the watchlist.
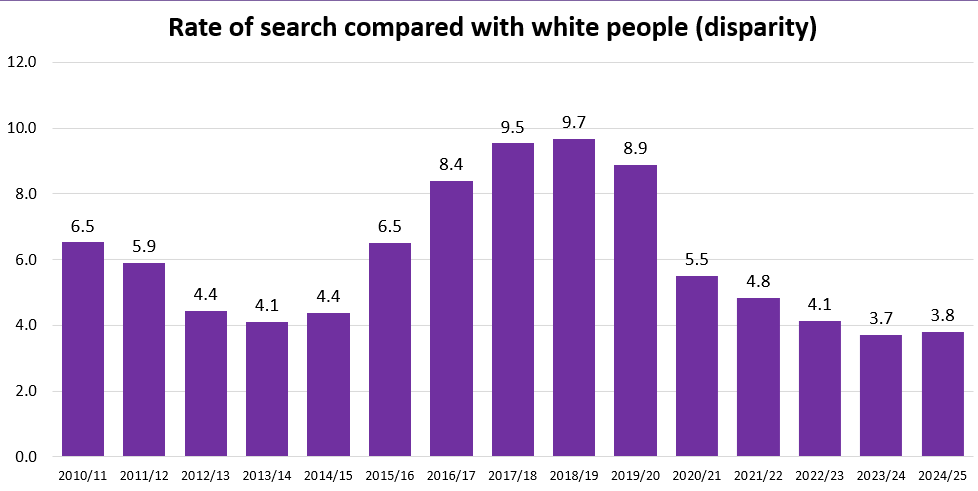
This speaks for itself
Interesting further detail from the full judgment: "Although officers doubted whether the first claimant was the person on the watchlist,
they nevertheless scrutinised him, asked questions and made him prove his identity."
Para 137 seems significant: "There was no challenge to that description [of no statistically significant differences in matching rates] and no evidence to contradict it."
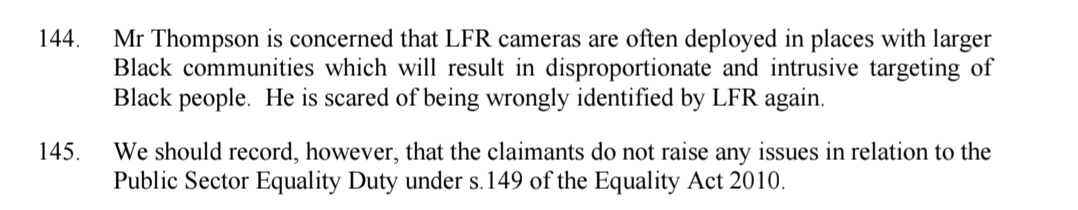
"the claimants do not raise any issues in relation to the Public Sector Equality Duty under s.149 of the Equality Act 2010"
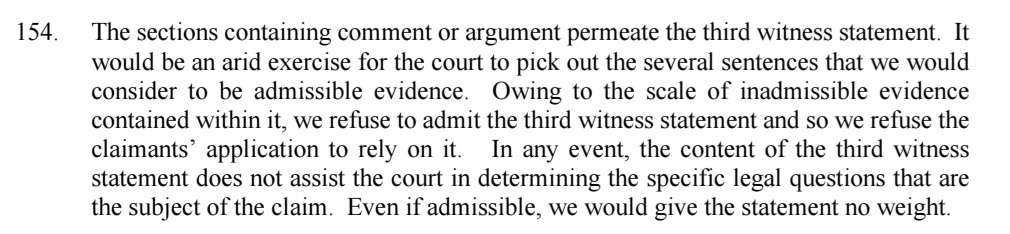
No punches pulled
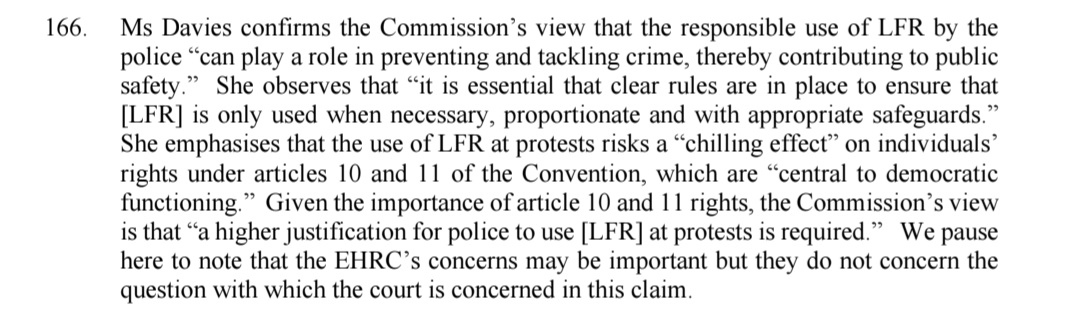
"We pause here to note that the EHRC’s concerns may be important but they do not concern the question with which the court is concerned in this claim."
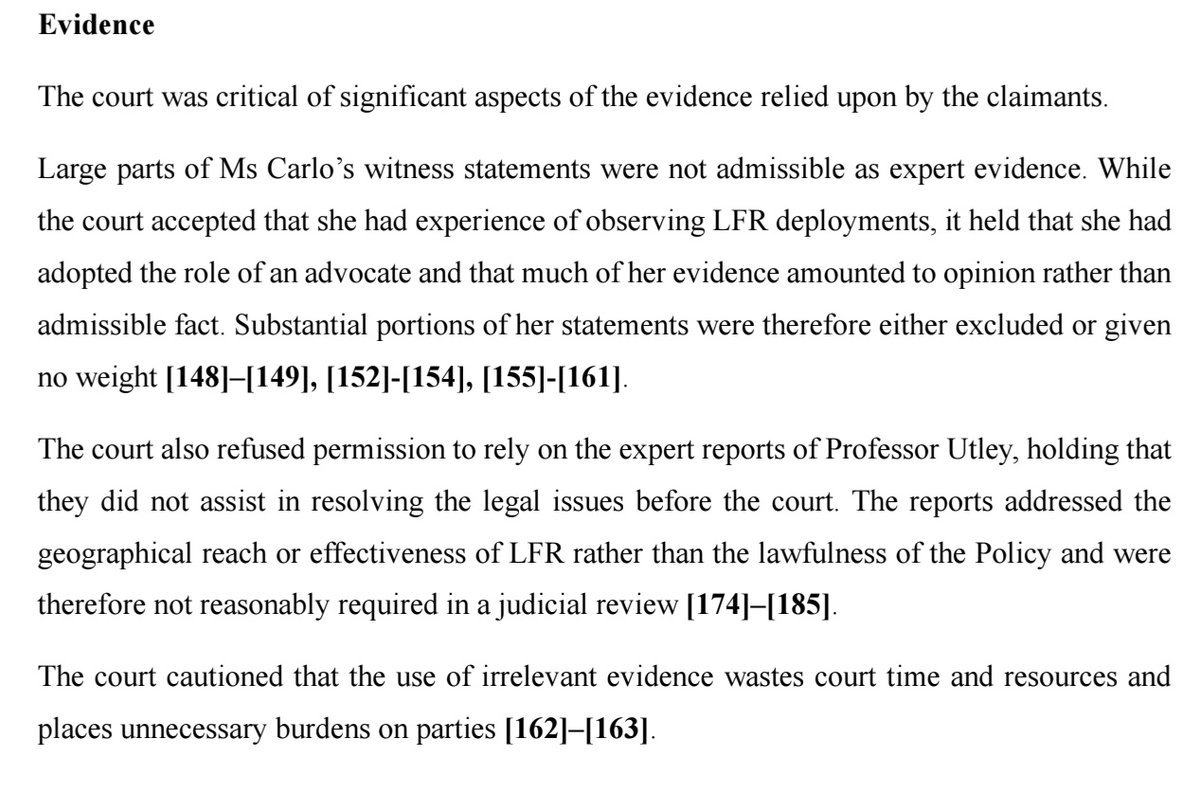
On expert evidence presented by the claimants: "To the extent that Mr Squires relied on Professor Utley’s
evidence to impugn the geographical reach of LFR and its use in crowded areas of London, his submissions missed any proper target for judicial review".
"We are not able to accept, on the thin submissions advanced before us, that concerns about discrimination infect the legality of the Policy."
"the Policy provides the claimants with an adequate indication of the
circumstances in which LFR will be used"
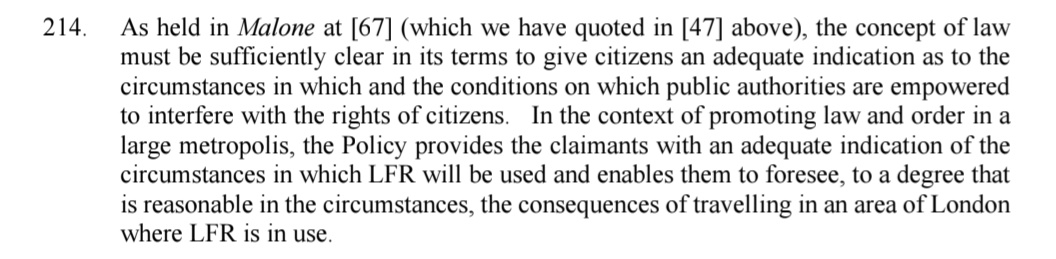
"the Policy contains adequate and lawful constraints on where LFR may be deployed."
"the guidance to officers on proportionality... acts as an effective safeguard against arbitrary outcomes."
"the claim is dismissed"
Ps, Mr Thompson's brother was "subject of an outstanding arrest warrant issued by a court for breach of bail following an allegation that he had caused grievous bodily harm to Mr Thompson."
• • •
Missing some Tweet in this thread? You can try to
force a refresh
A couple of things to say about the fall in stop and search disproportionality...
First, the numbers are correct. This Home Office chart is for Black:White disproportionality in E&W.
But note the 'cliff edge' after 2019/20. That is caused by switching from the 2011 to 2021 Census data: the population got quite rapidly more diverse over that decade.
So part of the rise and then fall in disproportionality is a function of the denominator becoming increasingly out of date. I did a thread on this issue last year.
I've been wondering recently how many racist police officers were racist when they joined, and whether part of the issue is logical fallacies arising from having a lot of contact with very narrow sections of society in places they may not otherwise be familiar with.
Does this analogy work? Imagine you run a car repair garage and for whatever reason most of your customers drive BMWs, and they only bring them to you when they break down. Is there a risk you start thinking there's something wrong with BMWs in particular?
Something I've been reflecting on recently: I worry that an emphasis on places (e.g. hotspot policing) over people (those causing the greatest harm) may be a driver of disproportionality and especially 'false positive' contact between policing and the public.
Linked to this, I worry that policing generally does not adequately clarify the *number of people they believe are causing the greatest harms* in particular locations.
Lots of possible examples, but take robbery: hypothetically, you might have 100 robberies in an area (a 'robbery hotspot') over a period of time, each with one suspect. You have named suspects for only 15, consisting of 10 people. For the other 85 only approx age, sex, ethnicity.
On Sunday, the Guardian ran an article looking at what has happened to ethnic disparities in the UK 5yrs on from George Floyd. It includes this chart on Stop and Search (which relates to Eng+Wal). What it misses is the impact of switching from the 2011 to 2021 Censuses [cont'd]
Handily, the Home Office publishes an 'ethnic disparities time series dashboard' for stop and search. Here's Greater Manchester Police. Note how in the top R chart black/white disparity increases to a cliff edge after 2019/20. #stopsearch assets.publishing.service.gov.uk/media/66f44156…
It looks like racial disparity got worse for a decade before suddenly improving. Was that a police force growing increasingly racist, followed by George Floyd/BLM effect?
I had a look at #schoolexclusions data the other day, and since then received a breakdown with sex and FSM eligibility as well as ethnicity - this time for all state schools (not just secondary) across 4 years.
In this thread I'll present various ways of looking at the data. 🧵
The main question I'll be examining is how rates of exclusion compare between white and black pupils. As a rule, Asian pupils are excluded less often.
In this first chart, we see that boys are permanently excluded more often than girls. Across both sexes black Caribbean children are exluded more often than white British, followed by black African and children of 'other' white backgrounds.
A thread on the likely interaction of systemic/structural inequalities and institutional racism, looking at #knifecrime involving young people in London. 🧵
1) Police data on knife crime shows clear racial disproportionality in both victimisation and offending (which overlap), with violence concentrated in more deprived neighbourhoods; higher crime areas are typically allocated more police resources.
2) In discussing knife crime, it is common for people to highlight its presence in 'black communities', and to responsibilise 'black communities' or 'the community' to find solutions. (No-one ever talks about white Londoners in those terms.)