In economics of economic growth, it is often seen that countries have catch-up growth, called the advantage of backwardness. We can see this in OECD using GDPpcppp numbers.
However, looking at the world at large for the same period (2000-present), the picture is not so clear. R2 dropped from 52% to 9%. Looking at the plot, most of the dots that didn't grow as expected are Africans. It's another example of OECD fallacy, one can get substantially wrong ideas about how the world works by only looking at a subset of mostly European, above average countries.
We can see the role of national intelligence here. A simple way is just splitting the data into some groups. Higher IQ countries show much stronger convergence, and the low IQ countries grow quite slowly. This is essentially the story of how Asian tigers had strong economic growth starting poor, including China.
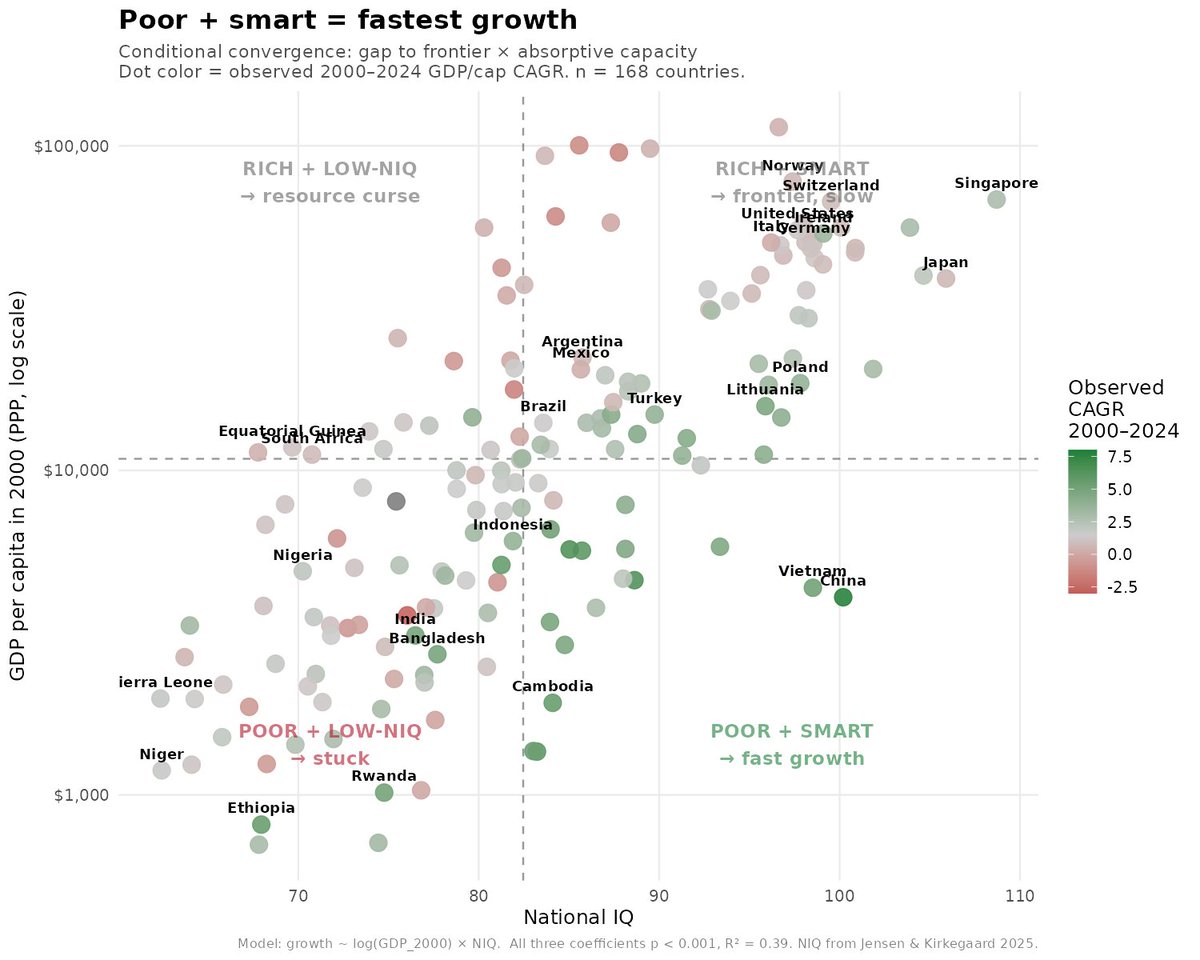
These slopes also show us the interaction effect. Economic growth is the fastest if you are both poor and smart, since you can quickly copy and adopt others' technology and improve upon it. We can plot this model indirectly this way.
• • •
Missing some Tweet in this thread? You can try to
force a refresh

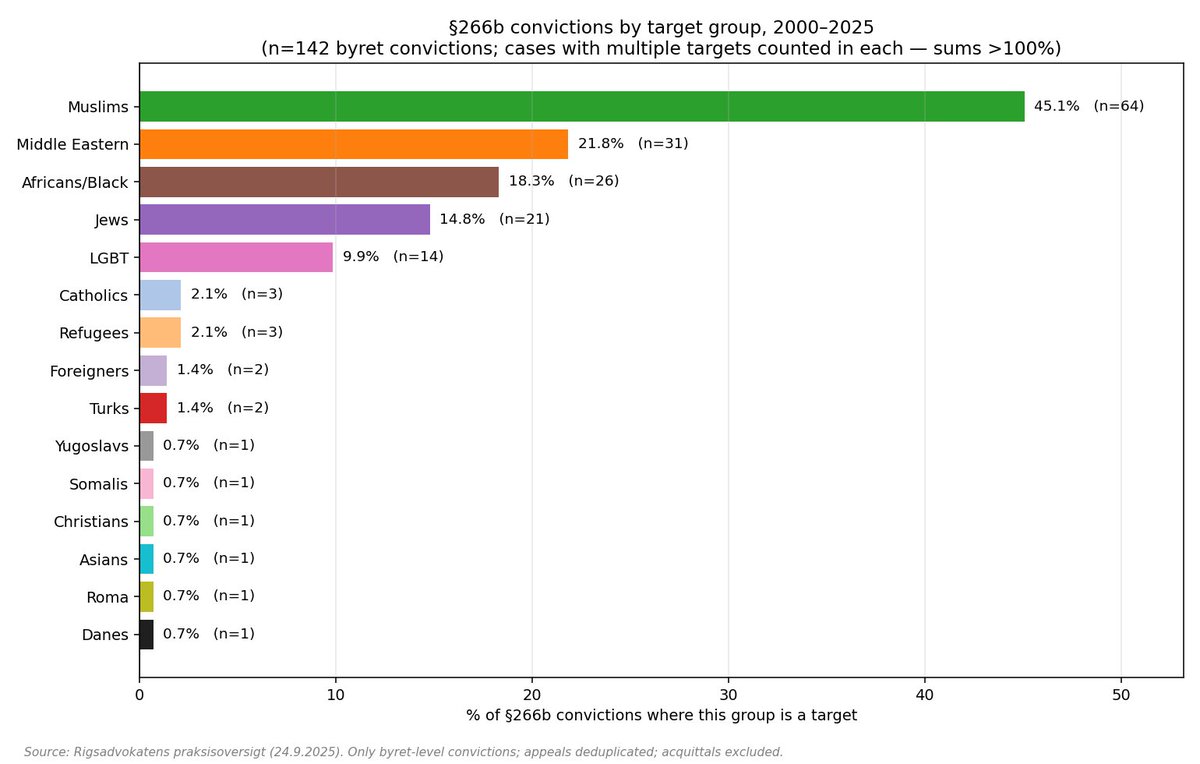
Who does hate speech law protect? Well, in Denmark the prosecutor's office has an overview, a summary of every case since 2001 or so. The targets of the utterances that led to guilty verdicts are shown below.
Thus, only 1 case of 142 protected Danes, and it was kinda incidental because the guy was insulting Danes and Jews combined, apparently because he was angry about Gaza getting rekt by Israel.
I expect results would be similar for other western countries. These laws are pernicious, only protect minorities, despite ostensibly being neutrally formulated. You can basically smear Danes in Denmark as much as you want as long as you don't do it because they are gay.
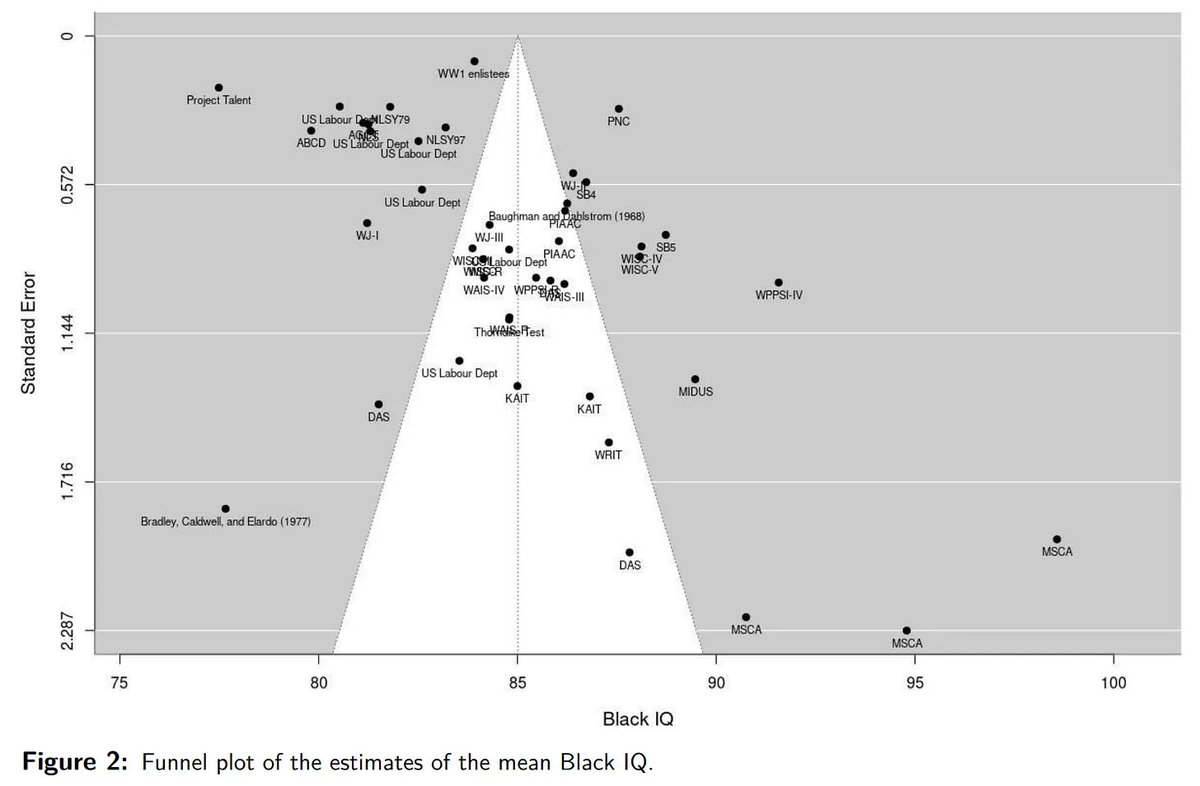
Our new meta-analysis of American race gaps in IQ/intelligence is out! The main results didn't change that much, with 2 exceptions:
First, there appears to be reverse publication bias for Black IQs, smaller studies find _larger_ values. This is a prediction from leftism bias model, since social scientists hack in the preferred direction, which is usually positive, but sometimes negative. Adjusting for this gives a Black IQ estimate 82 instead of 85.
The formal meta-analysis models did not find any changes over time, but if one looks at the plot, there is some trend, p > 5%.
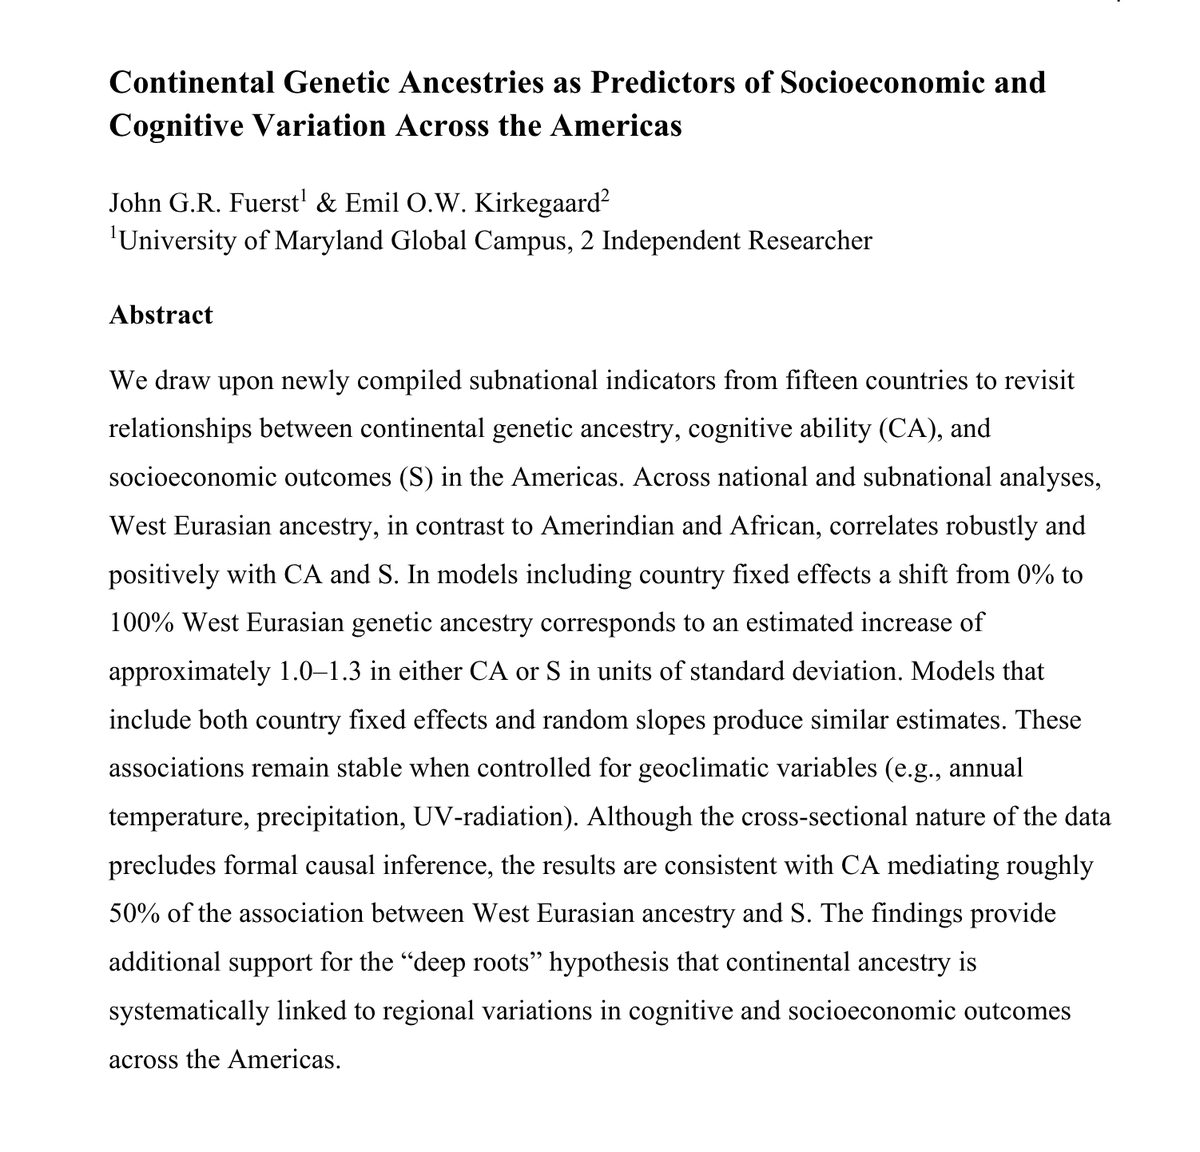
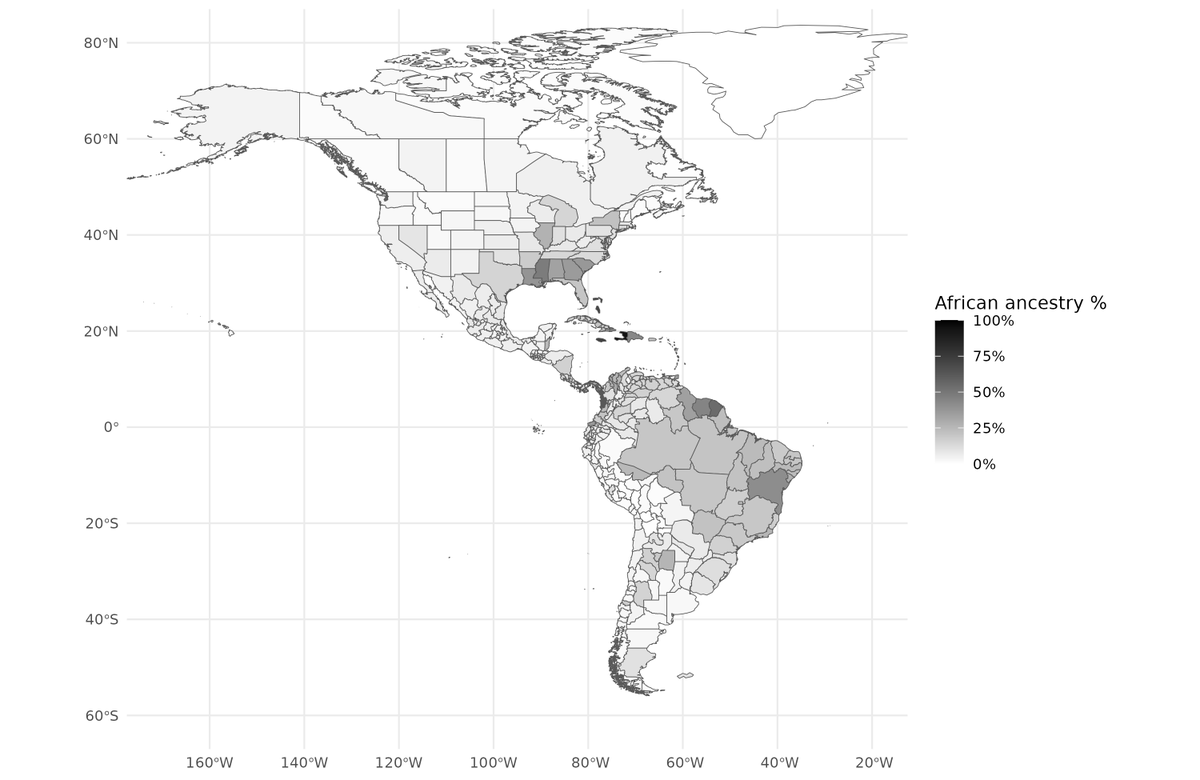
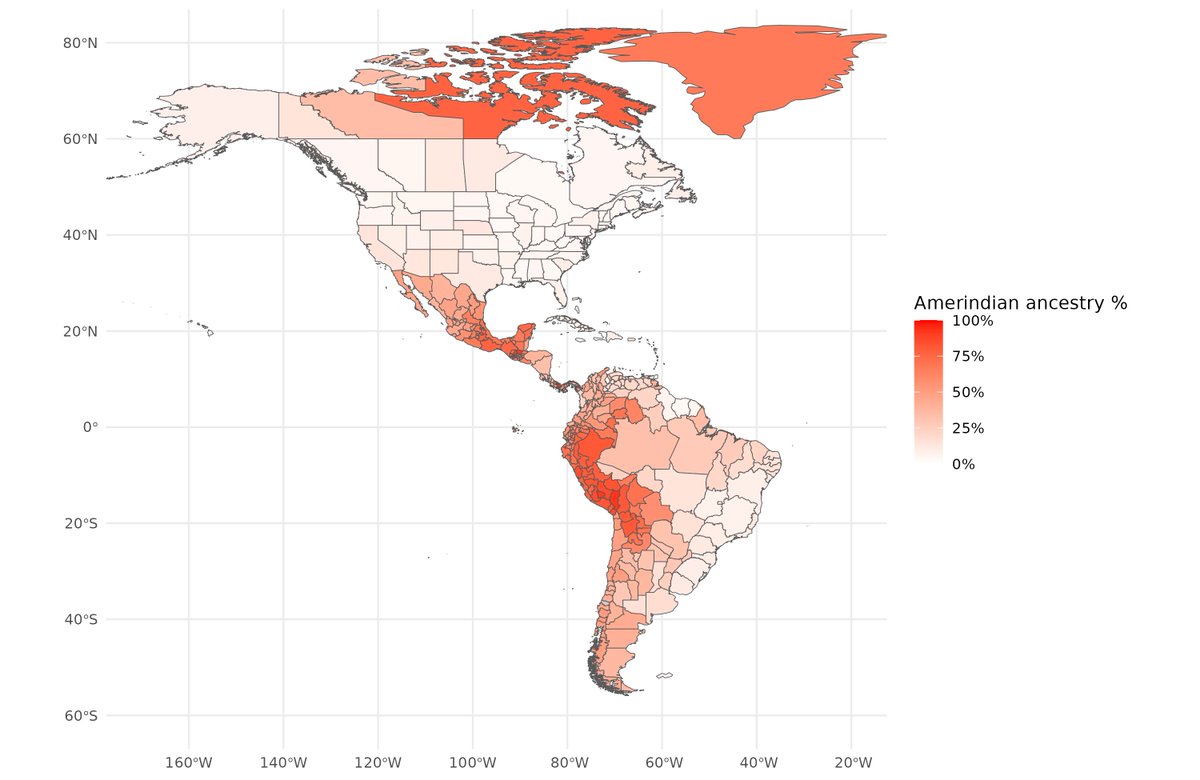
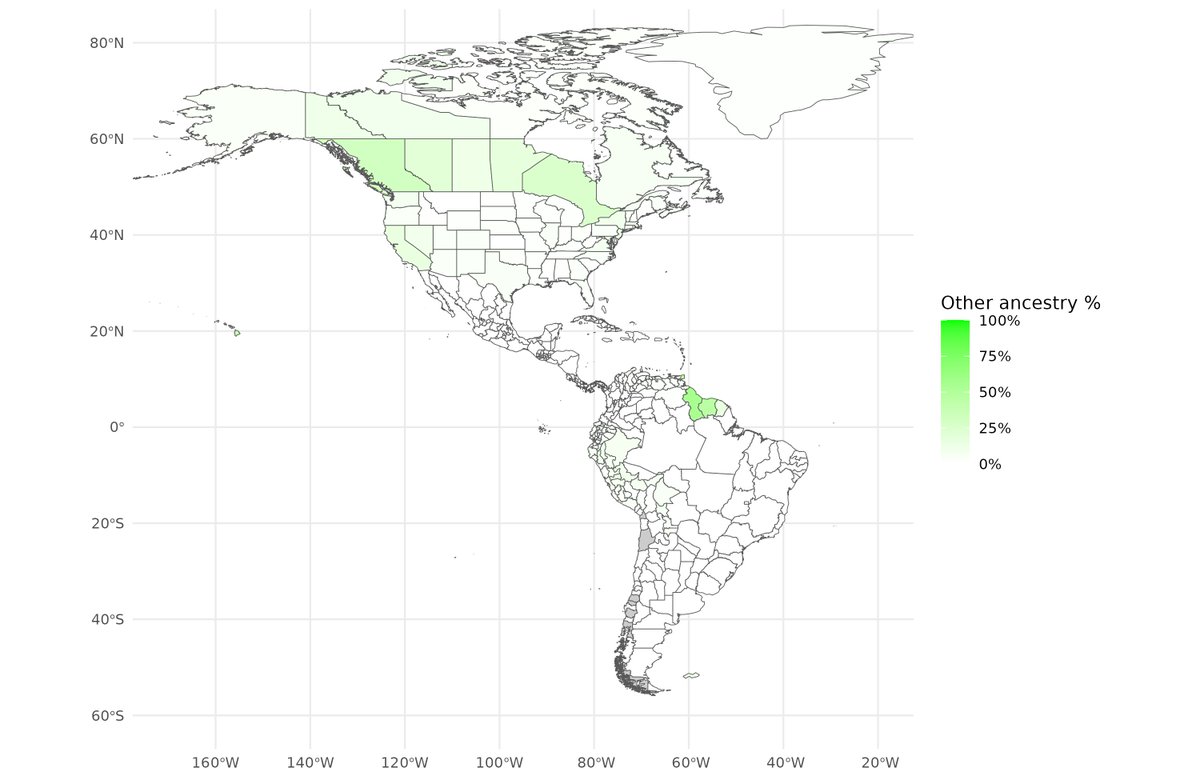
Happy to release our newest and largest admixture project. 🧵 Thread with the main findings.
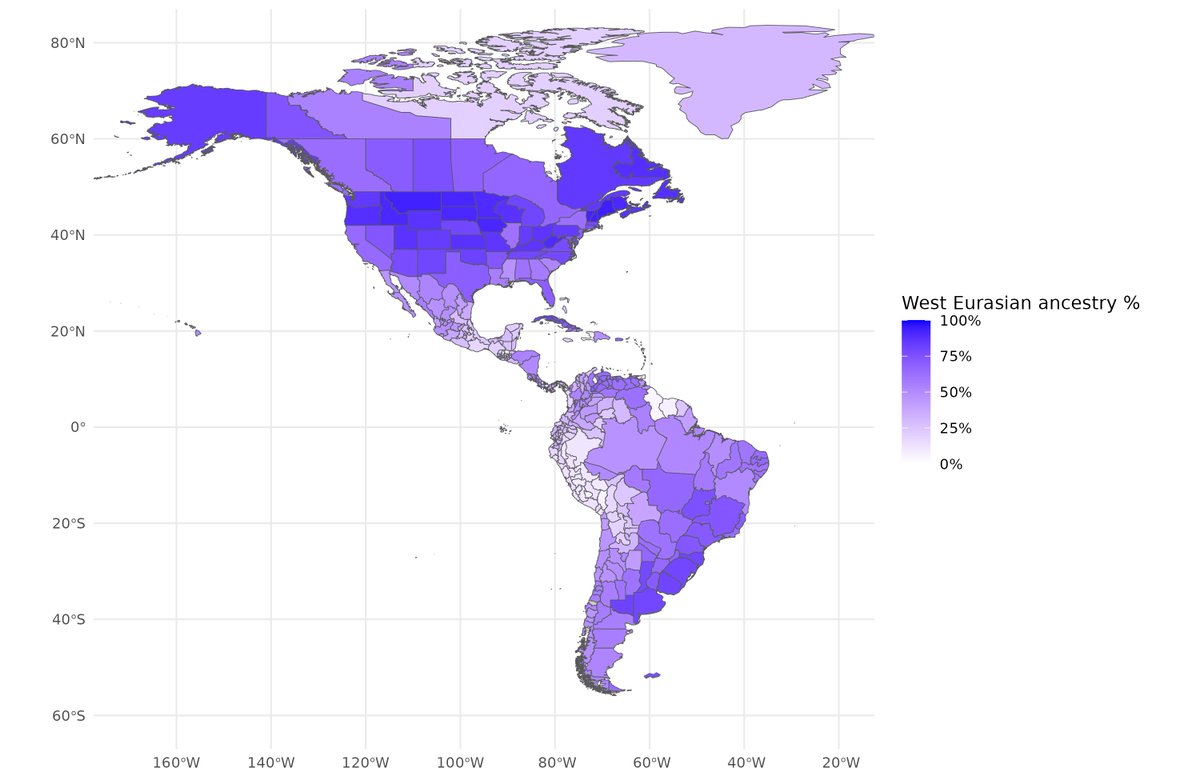
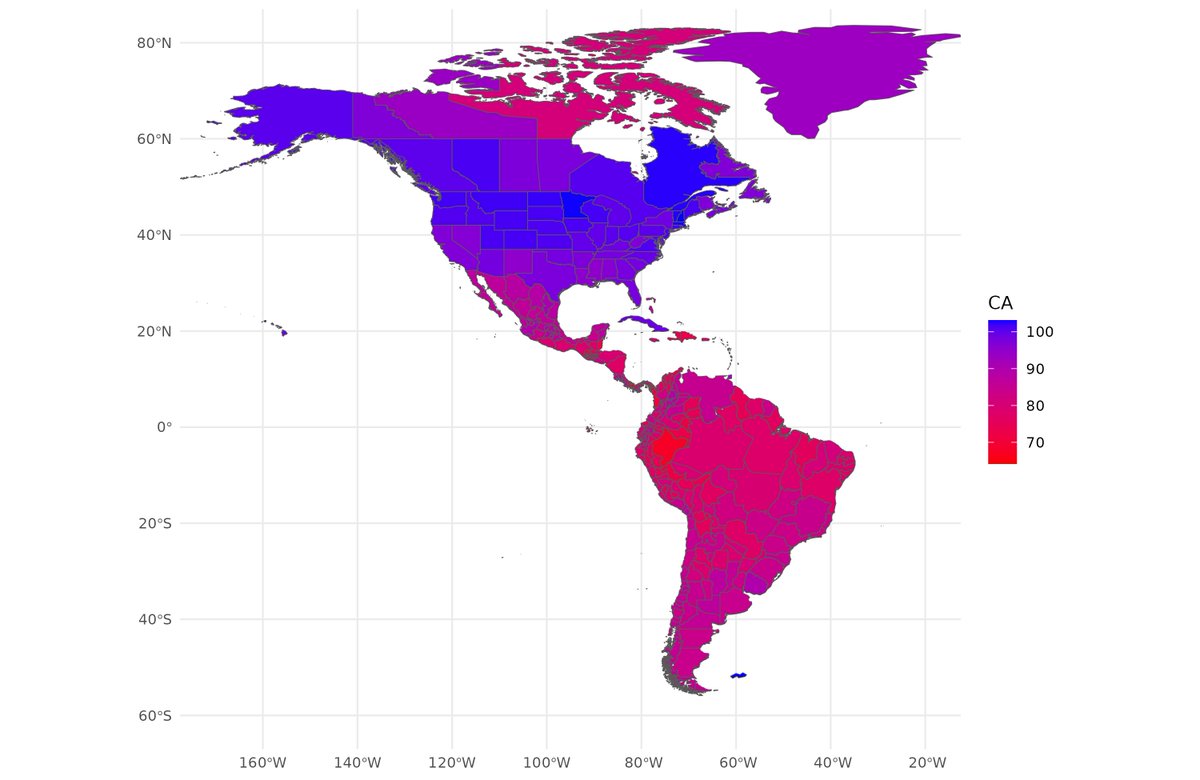
First, we compiled data from 100s of sources to estimate genetic ancestry for over 400 units in the Americas. These are countries and subnational divisions of the larger countries, such as US states, Canadian provinces, various Caribbean islands. Results can be seen in these 4 maps.
It was a real pain in the ass to merge the spatial data to produce the maps!
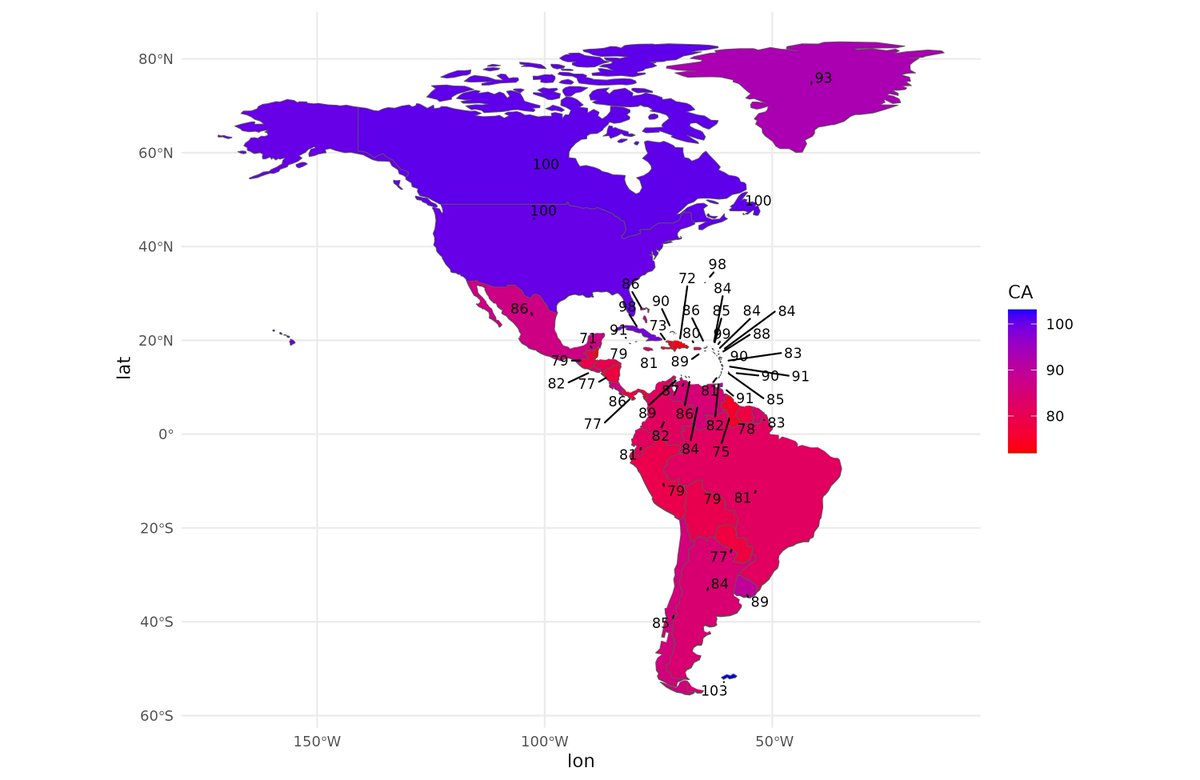
Next up, we gathered cognitive ability data from international datasets, and various regional and subnational scholastic tests, and any other source of standardized testing we could find. These were then converted to British international norms (Greenwich mean IQ) as best we could. It gives this map.
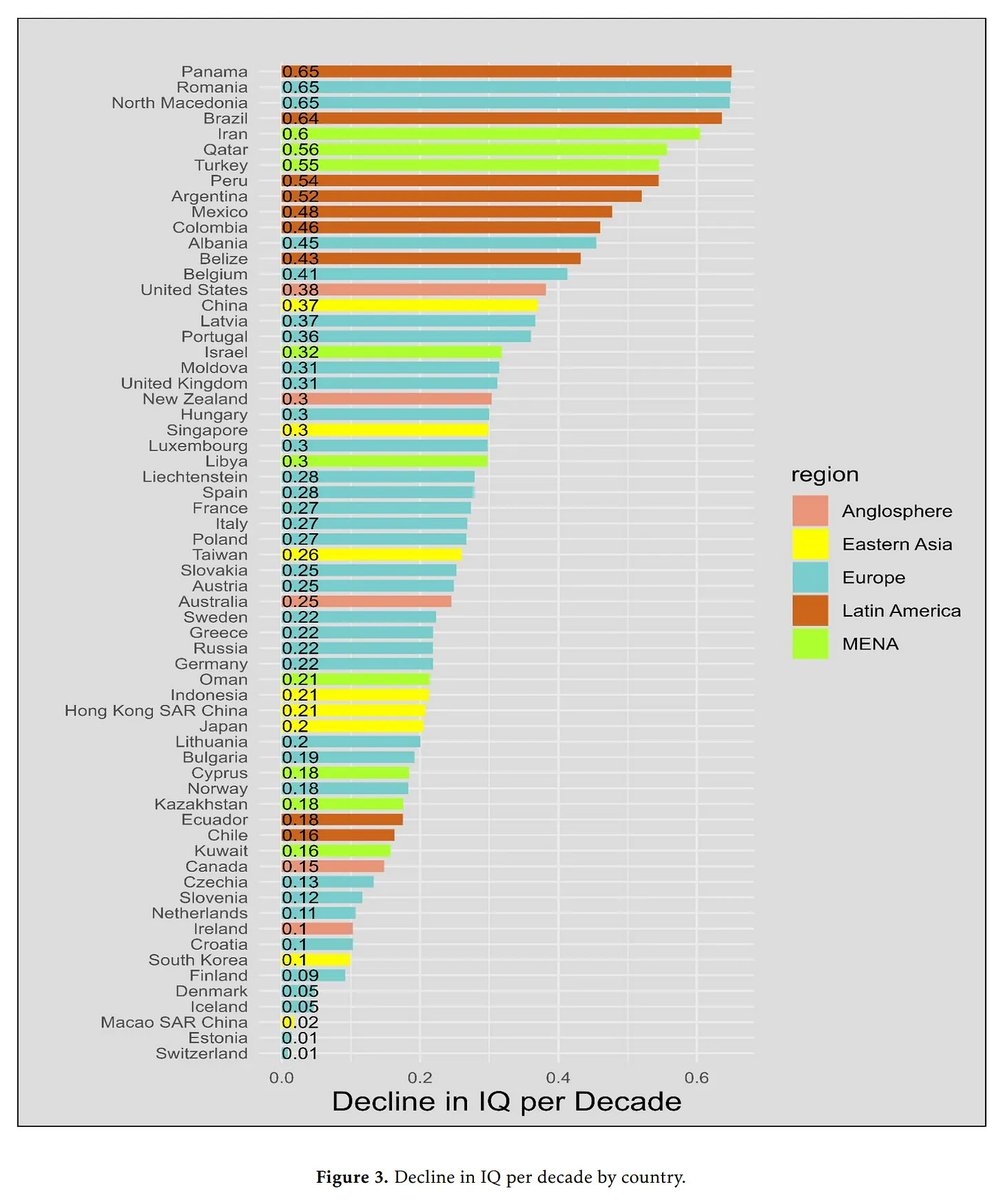
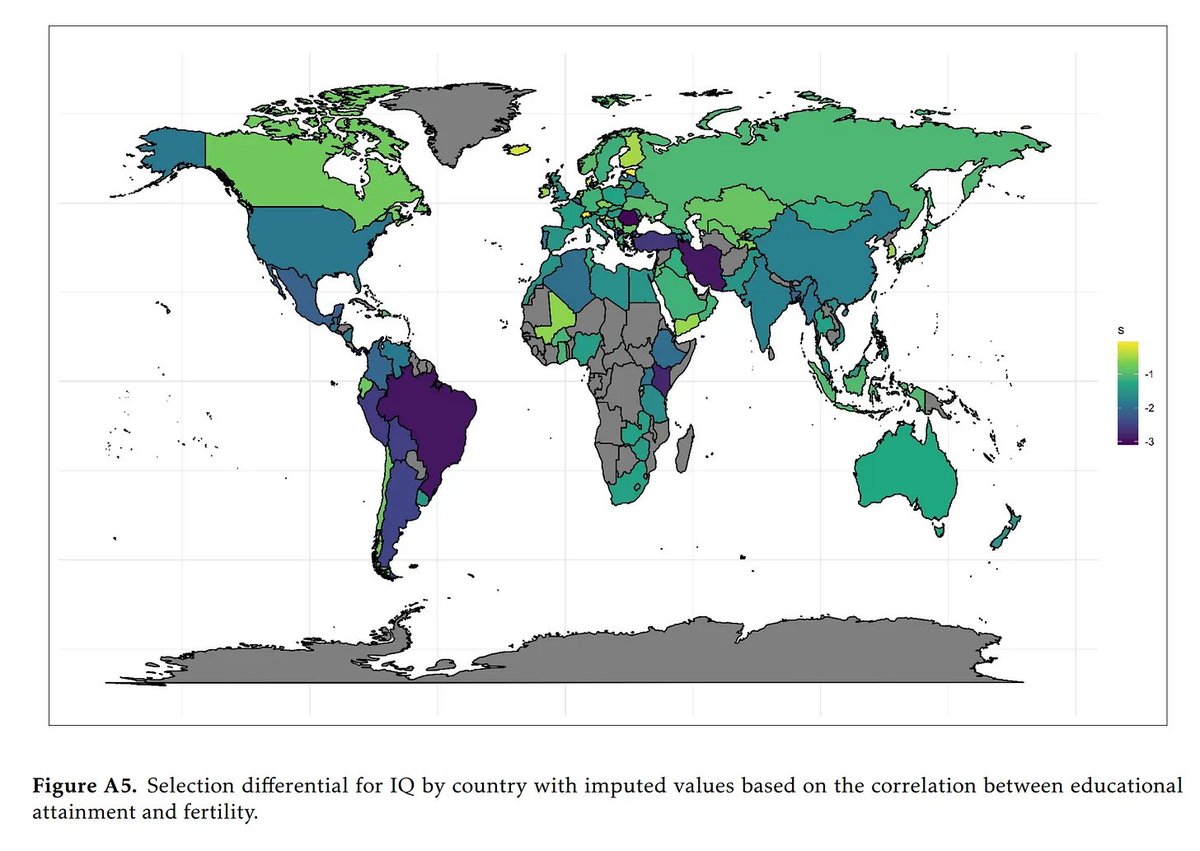
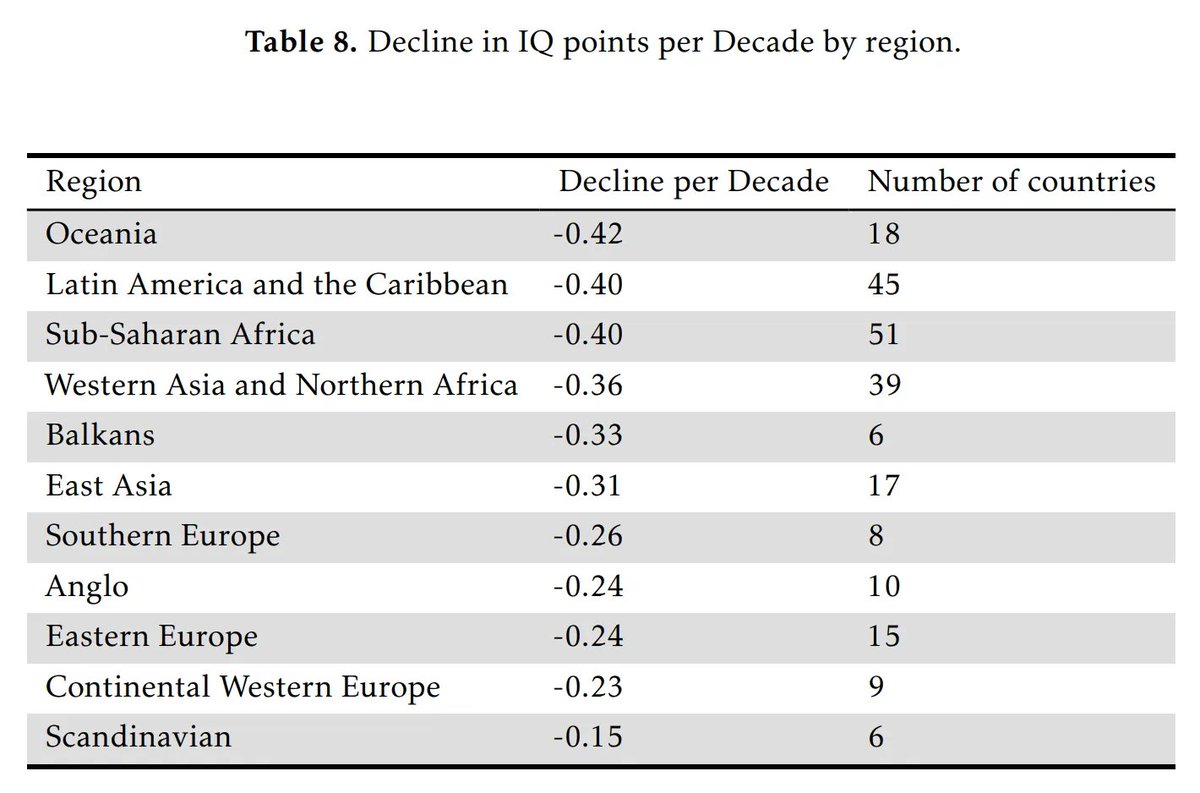
Using data from across the world, we estimated the speed of selection against intelligence across countries.
There is a certain regionality to the data
Relatively atheistic north Europeans have apparently quite weak selection, while more religious areas have stronger negative selection. This is the opposite of what American data suggested when studying individuals.
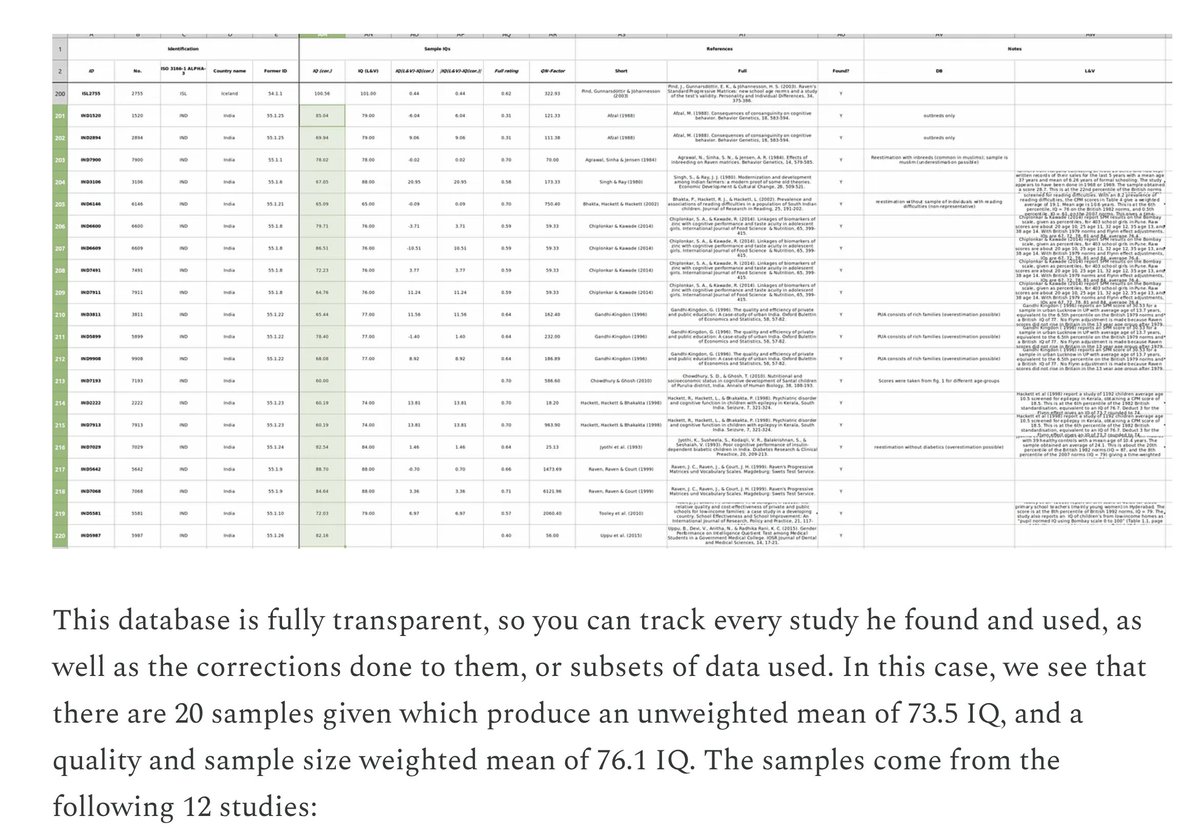
There are 20 samples in Becker's collection from 12 studies. These produce a mean of about 75 IQ.
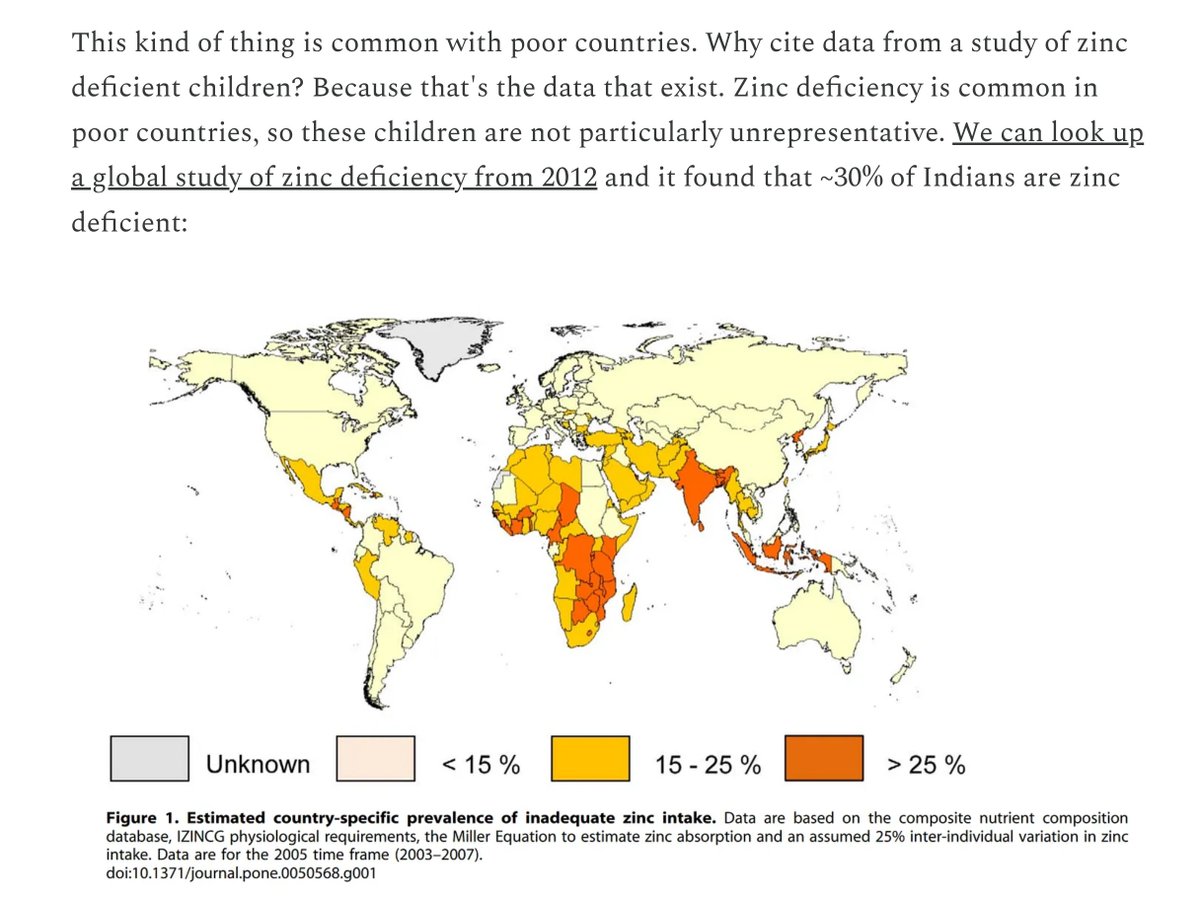
Some Indian nationalists attack some of these studies. One of them studied children with zinc deficiency. This was demmed unrepresentative. However, this is not true, as India at the time had about 30% of the population having a zinc deficiency. This is a typical mistake when looking at datasets from poor countries. Disease-free people are not representative in such countries, various deficiencies is the norm and should be included, not excluded.
In any case, the values from this study were about the same as the other studies.