The Credit Cycle Melt UP and Coming Crash 🧵
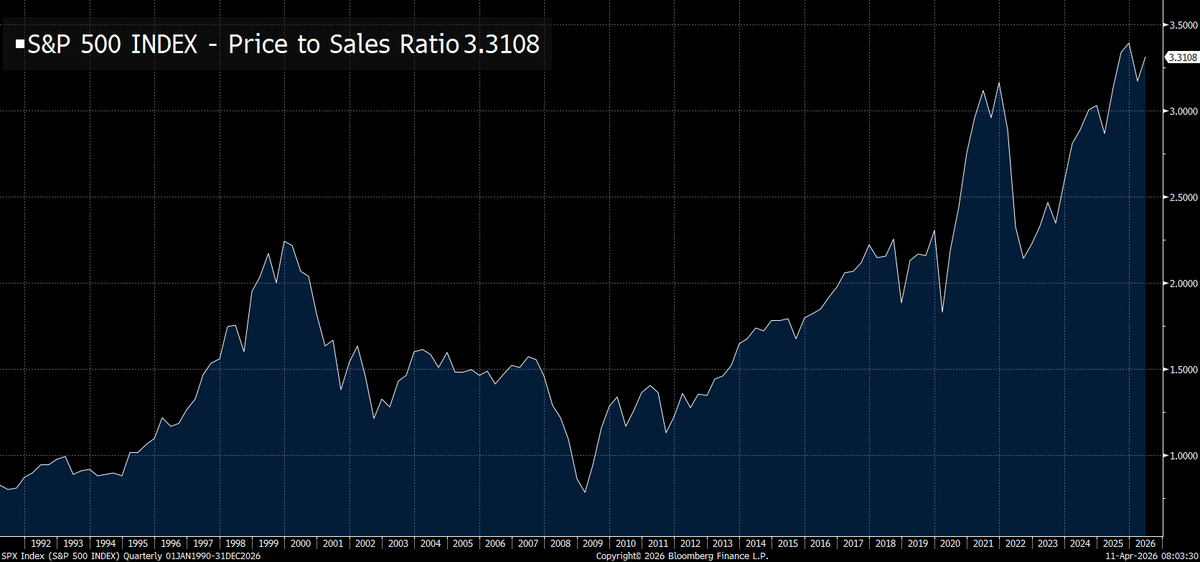
We have seen one of the greatest melt ups in US history since the 2022 lows, as we begin entering unknown territory of the highest valuations in human history
The melt up isn't driven by europhoria or sentiment, it is driven by liquidity and credit that is directly linked to the AI retooling occurring in the financial market and underlying economy
This thread is meant to be a complete breakdown of HOW to think about what is happening, and WHEN risks begin to build that will cause the next bear market 🧵

The current credit cycle melt-up is being driven by two things:
1) Financial market liquidity is expanding AT THE SAME TIME credit is being injected into the underlying economy. This creates a reflexive feedback loop between the market and economy as they feed on each other and risk assets are the release valve of this liquidity and credit.
2) AI is fundamentally retooling the market and economy in a manner that people don't really understand yet. AI is speeding up the pace at which goods and services are transacted in the economy. It now costs a lot less to spin up a company, market it, and build a brand. This can happen with very little upfront capital which means that more businesses generate cash flow with less up front investment. On net this basically injects more cash into the system without being very capital intensive. The same thing is happening in financial markets with capital allocation decisions.
The problem is that there is an increasing amount of money chasing the same amount of investments even though things in the economy and market are operating faster due to AI.
I have been explaining all of these factors daily on the livestreams I do and in the daily reports i send out (both of which can be found on my website which is linked in my bio)
The biggest misconception in markets right now is thinking that AI or the macro credit cycle are independent. Right now, the entire capex side the market is helping drive spending in the underlying economy as oil prices surge which is helping push long end interest rates marginally higher.
It is no mistake that companies like Caterpillar are moving in lockstep with AI factor flows showing that the AI flows in markets are reverberating across every industry. Why? Because hardware is meeting software in a total retooling of the global economy.
It is no mistake that companies like Caterpillar are moving in lockstep with AI factor flows showing that the AI flows in markets are reverberating across every industry. Why? Because hardware is meeting software in a total retooling of the global economy.

And this isn't taking place in the US alone
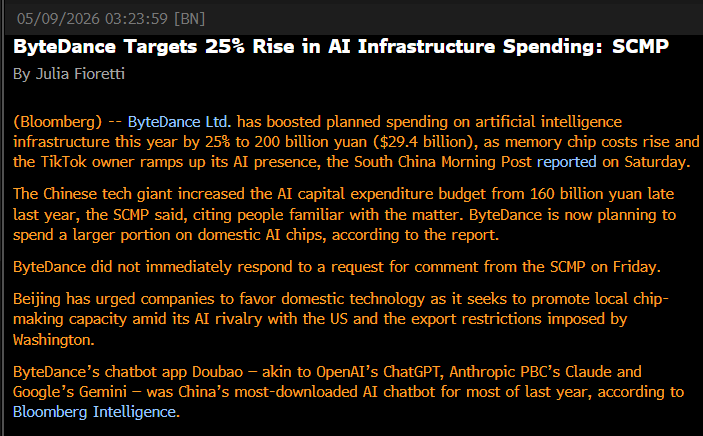
We are in a full out AI arms race with China to adapt to the coming regime. We are seeing all of the AI companies in China spend massive amounts of money as well.
We are in a full out AI arms race with China to adapt to the coming regime. We are seeing all of the AI companies in China spend massive amounts of money as well.
Why does it matter that we are in an AI arms race? Because the largest economies in the world are spending MASSIVE amounts of money and the flows of capital are bidding up the stocks of those companies in order to obtain exposure. If that company is in another country, then foreign investors need to convert their capital into the local currency in order to get exposure. As a result, crossboarder flows begin to take place and the financial markets of countries begin to get cross collateralized.
I explained the entire framework for how this cross-collateralization takes place in the video from yesterday:
x.com/Globalflows/st…
I explained the entire framework for how this cross-collateralization takes place in the video from yesterday:
x.com/Globalflows/st…
All of us know that global trade is the highest in history which has cross collateralized every country with the United State's demand base and China's production base. Every country now sits between these two major players and the capital that flows between them is WHY global interest rate and equity markets are so correlated.
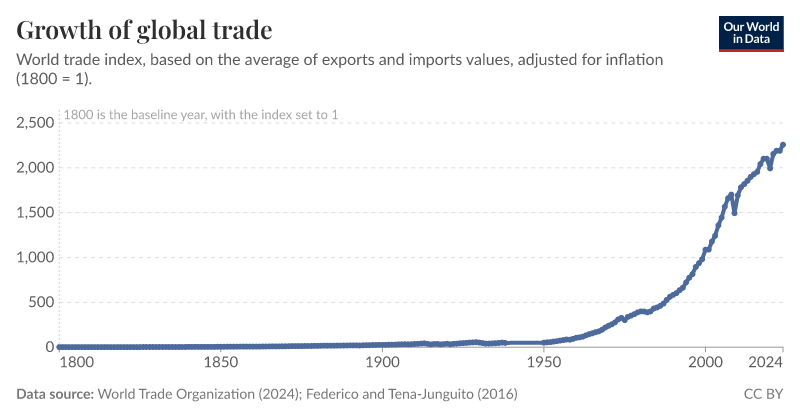
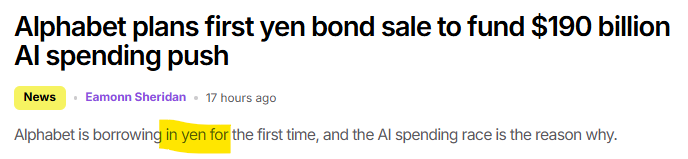
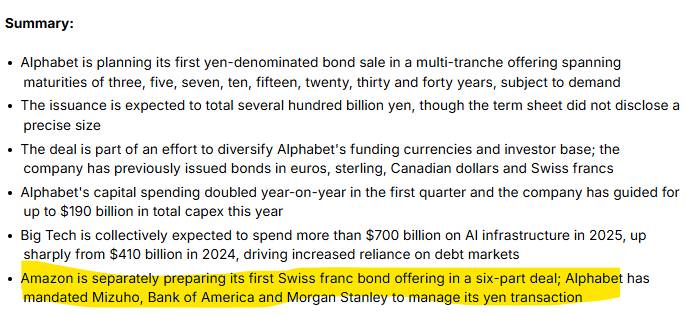
The AI flows we are seeing now amplify the already existing trade relationship by retooling the entire goods and services sectors of the economy and injecting even more capex spending. In order to fund this, companies are taking out tons of debt and even doing in in multiple currencies
And don't forget, we are also having massive share buy backs at the same time one of the largest capex booms in history takes place. The financial market and underlying economic forces are converging to create a credit cycle melt up.

None of this even takes into account the sheer number of ETFs being launched and the fact that passive flows are gaining massive market share:
"The ETF market added 85 new funds in April, bringing year-to-date launches to 341, up 9.3% from the same period last year and keeping the industry on pace for a second straight 1,000-plus-launch year after 2025's record 1,115 debuts. The surge increasingly reflects issuers' race to push actively managed and derivative-heavy products into the market, as firms scramble to differentiate in an ETF industry where plain-vanilla beta exposure is rapidly becoming commoditized."
"The ETF market added 85 new funds in April, bringing year-to-date launches to 341, up 9.3% from the same period last year and keeping the industry on pace for a second straight 1,000-plus-launch year after 2025's record 1,115 debuts. The surge increasingly reflects issuers' race to push actively managed and derivative-heavy products into the market, as firms scramble to differentiate in an ETF industry where plain-vanilla beta exposure is rapidly becoming commoditized."

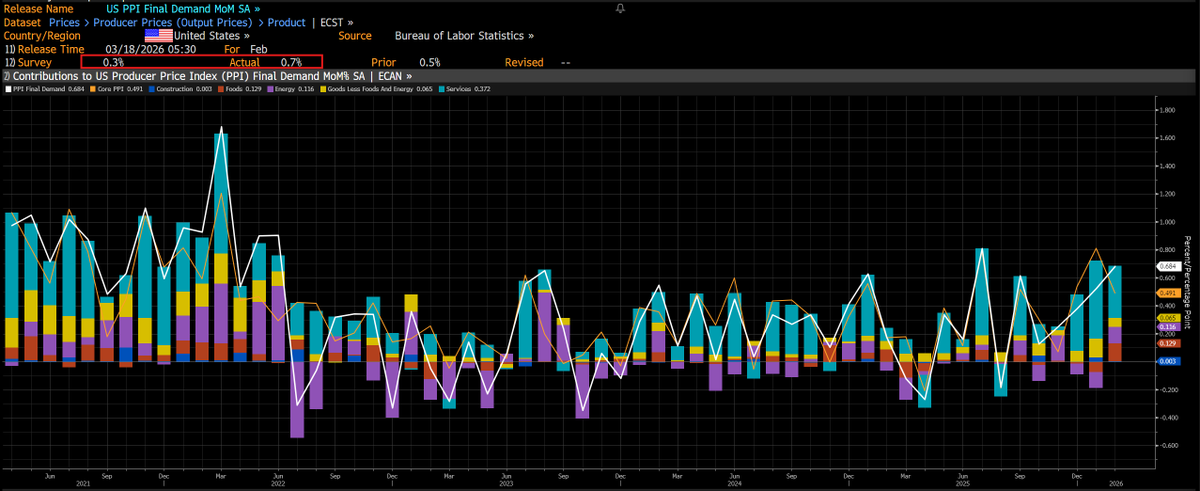
So simply put, we know that a significant amount of financial engineering is going on in the financial industry. We know that credit continues to get issued for Capex spending. We know that AI is making it easier to deliver products to market with less and less capital. And then on top of all of this, we have an inflation shock that the Fed is pausing into so the net result is public market liquidity expanding as capital is moving out the risk curve.
While many uninformed market participants are taking refuge in the idea that liquidity might be contracting (literally zero evidence of this), the Goldman Sachs high yield stocks index has melted up to a new all time high. Simply put, all of the riskiest companies have been in a complete melt up for months. This NEVER happens when liquidity is contracting.
While many uninformed market participants are taking refuge in the idea that liquidity might be contracting (literally zero evidence of this), the Goldman Sachs high yield stocks index has melted up to a new all time high. Simply put, all of the riskiest companies have been in a complete melt up for months. This NEVER happens when liquidity is contracting.

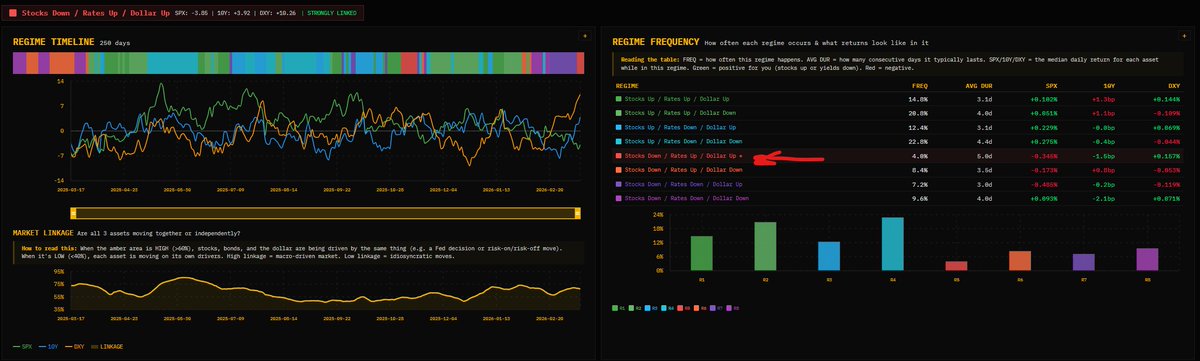
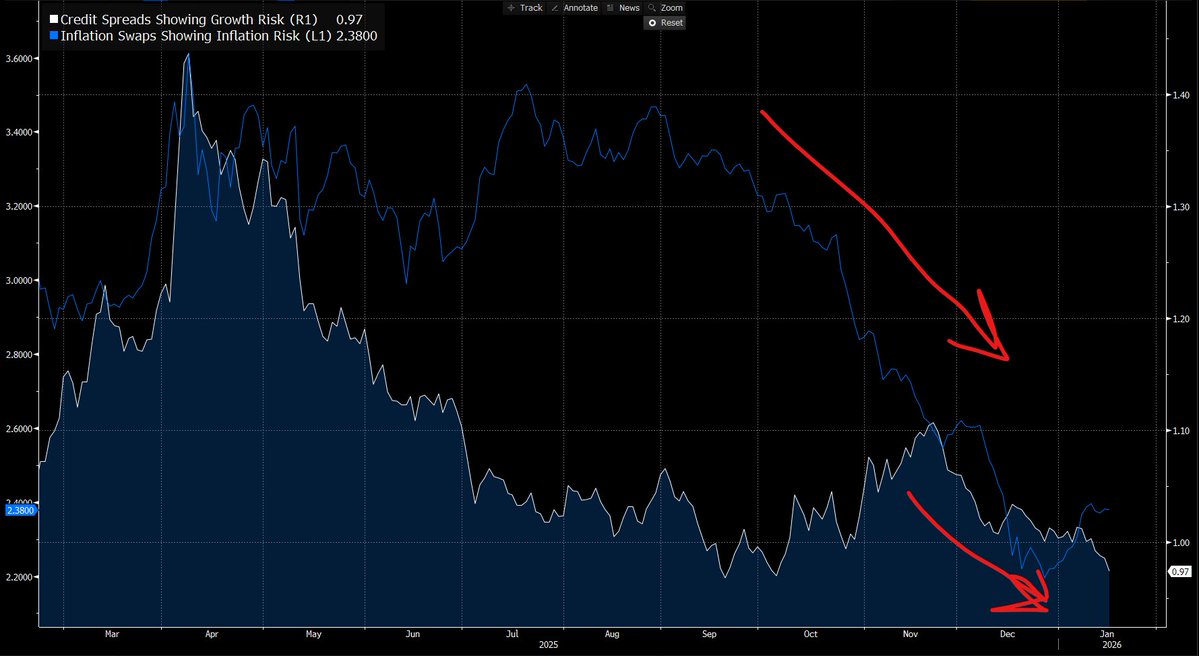
We know that the entire global situation has created an environment for a credit cycle melt up and the oil shock actually accelerated it even further.
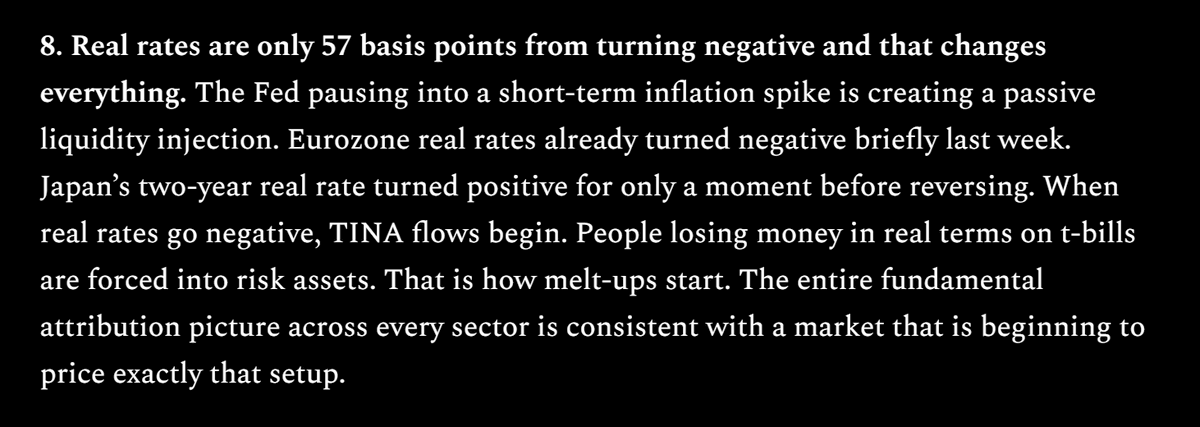
Many people were shaked by the oil shock instead of realizing the secondary effect of it. Once the goepolitical risk premia was taken out of markets, we have the Fed pausing into higher inflation which means that mechanically it becomes cheaper to use dollars on a real purchasing power basis as real rates fall.
Many people were shaked by the oil shock instead of realizing the secondary effect of it. Once the goepolitical risk premia was taken out of markets, we have the Fed pausing into higher inflation which means that mechanically it becomes cheaper to use dollars on a real purchasing power basis as real rates fall.

1y real rates have fallen and now sit only 30bps from turning negative. The last time real rates turned negative like this was during the credit cycle melt up of 2021
This is one of the most important datapoints to show people who want to keep denying that markets cant go higher. I assure you, markets can go higher.
This is one of the most important datapoints to show people who want to keep denying that markets cant go higher. I assure you, markets can go higher.

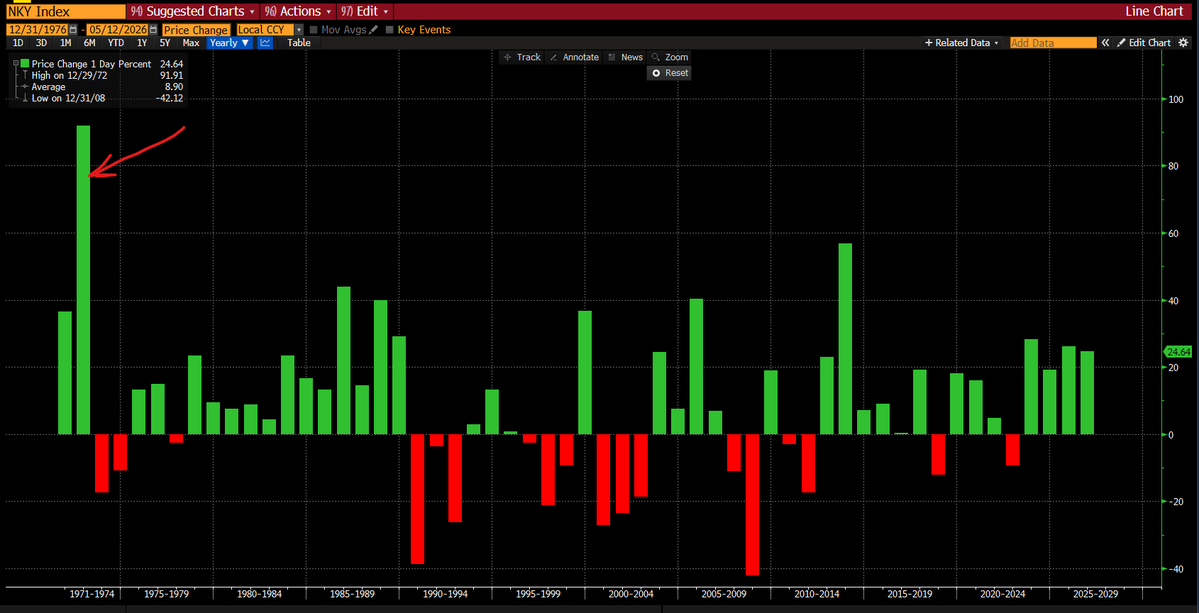
Whenever people assert that markets can't go higher I always remind them that the Nikkei had a yearly return of almost 100% in the 70s!
I assure you, the market can go higher if liquidity expands. This is why tracking liquidity correctly is so vital for a macro framework. This is why I will be doing an entire liquidity cycle breakdown in my livestream tomorrow morning at 8:30am MST. If you want to get the link for it (it will be free), just become a subscriber on my website (the link is in my bio) and i will send you the link tonight. You will walk away with an entire breakdown of the liquidity cycle and all of the charts and tools to track things in real time.
I assure you, the market can go higher if liquidity expands. This is why tracking liquidity correctly is so vital for a macro framework. This is why I will be doing an entire liquidity cycle breakdown in my livestream tomorrow morning at 8:30am MST. If you want to get the link for it (it will be free), just become a subscriber on my website (the link is in my bio) and i will send you the link tonight. You will walk away with an entire breakdown of the liquidity cycle and all of the charts and tools to track things in real time.
The main idea here is that macro liquidity is about the GLOBAL impulse of capital flows. Just looking at the Fed balance sheet isnt going to get you through this cycle.
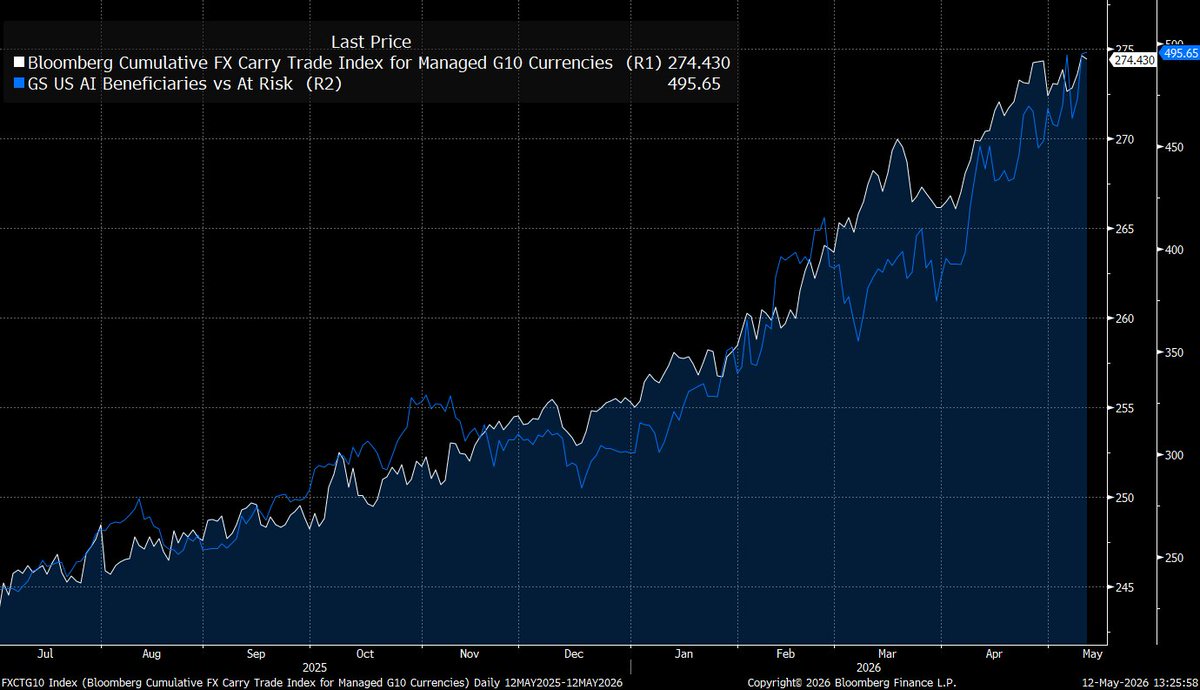
We already know that the global carry trade index has been moving in lockstep with AI flows and GLOBAL traders and investors are all leveraged to the same AI flows.
We already know that the global carry trade index has been moving in lockstep with AI flows and GLOBAL traders and investors are all leveraged to the same AI flows.
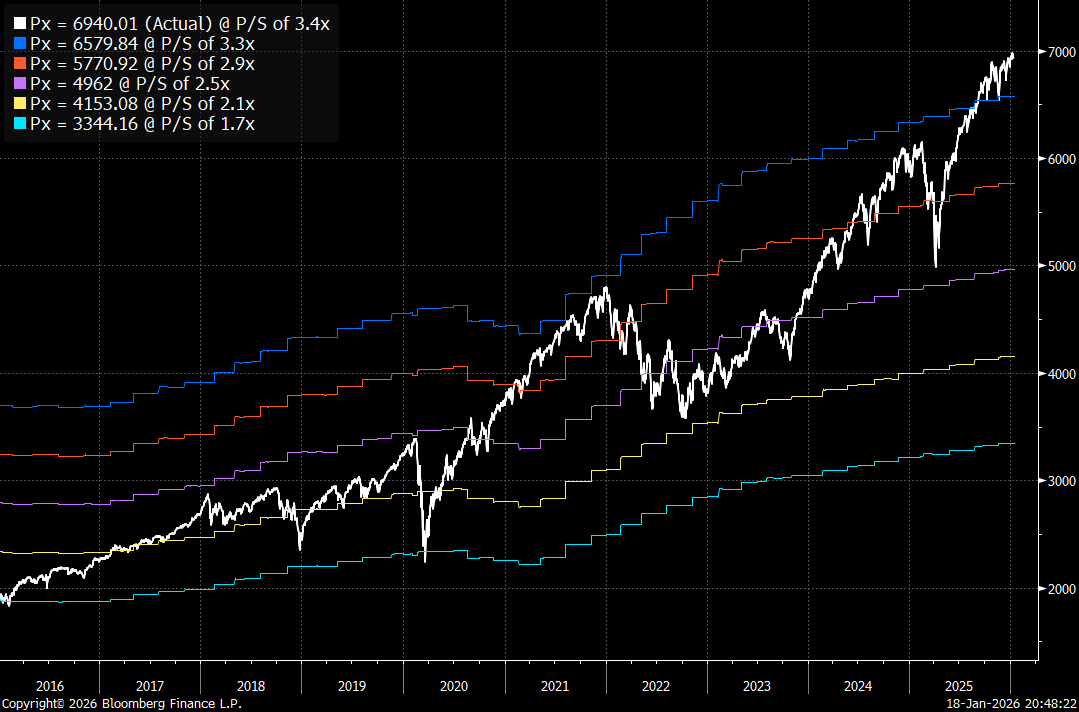
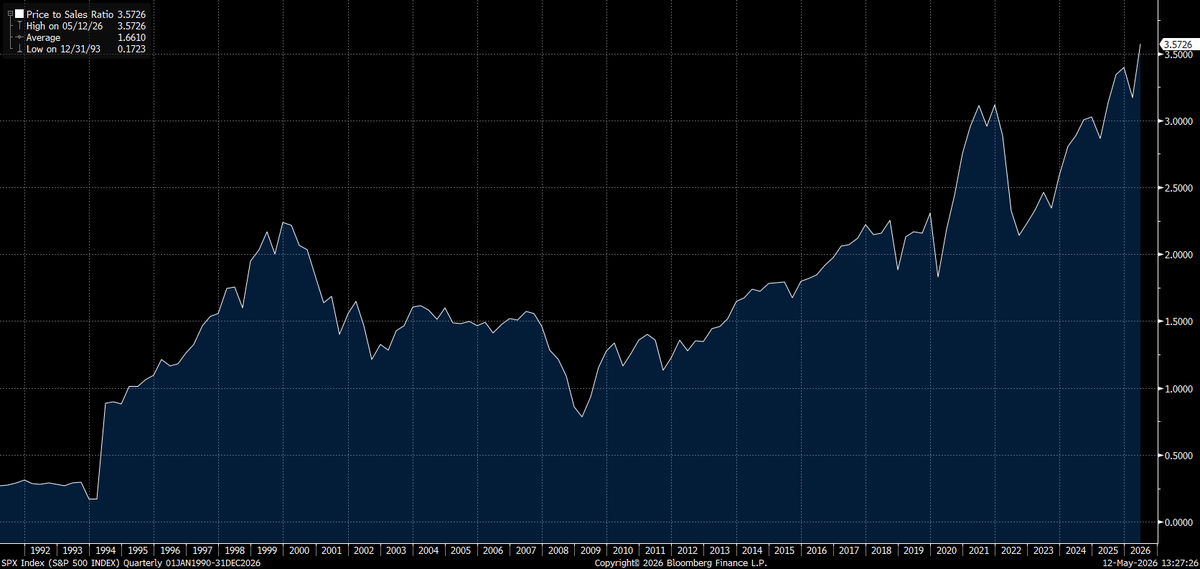
The implication of all of this is that the price to sales ratios of the S&P500 is the highest its been in history and everything from credit, to public market liquidity, to financial engineering is all concentrated in one place: MAX LONG STOCKS, ESPECIALLY AI STOCKS.
Liquidity always sows the seeds of its own demise though. When liquidity increases to much, it begins to seep into inflation and cause long end rates to rise which breaks the cycle. The other potential catalyst is that the global carry trade unwinds as foreign investors need to raise dollars in order to shore up their balance sheets and they sell US stocks in order to get these dollars.
None of this will end well for global equities but until we see of the constraints for liquidity begin to reverse the impulse, markets remain skewed to the upside on a cyclical basis.
I have been laying out this framework for a while and I will continue mapping the macro regime in order to take large asymmetric bets.
I have been laying out this framework for a while and I will continue mapping the macro regime in order to take large asymmetric bets.
This is clearly one of the most unique times in human history and my strategy remains long equities. Once my strategy begins to turn neutral and then bearish US equities, I will publish a report immediately on my website. For now, the credit cycle, liquidity forces, AI factors, and global carry trade dynamcis are all pushing capital out the risk curve and i remain BULLISH.
I will continue to lay out everything on my website in report and do daily livestreams tracking all of these factors in real time
You can follow me @Globalflows and subscribe to my research with the link in my bio
If you found this thread helpful, I would appreciate it if you like and retweet the top tweet
You can follow me @Globalflows and subscribe to my research with the link in my bio
If you found this thread helpful, I would appreciate it if you like and retweet the top tweet
Welcome to global macro
“You wasted $150,000 on an education you coulda got for $1.50 in late fees at the public library.”
“You wasted $150,000 on an education you coulda got for $1.50 in late fees at the public library.”

• • •
Missing some Tweet in this thread? You can try to
force a refresh