David Turver Profile picture
May 31 12 tweets 4 min read Read on X
UK electricity bills are heading sharply higher — despite all the “clean energy superpower” promises. My new article reveals how subsidies & grid costs will explode to £40bn+ by 2030/31. Tory and Reform policies will not be enough to reverse the trend. A thread 🧵(1/11) Image
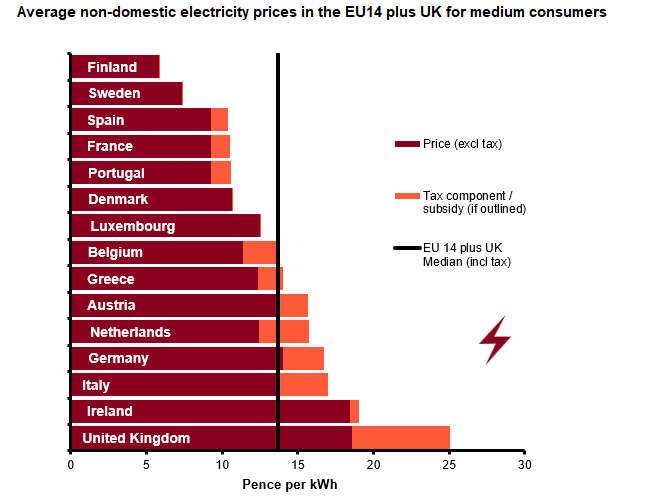
We have the highest industrial electricity prices. The Government claims renewables will bring down energy bills for good. But Octopus & E.On bosses said to Parliament that even if wholesale gas prices halve or go to zero, bills will rise. (2/11) Image
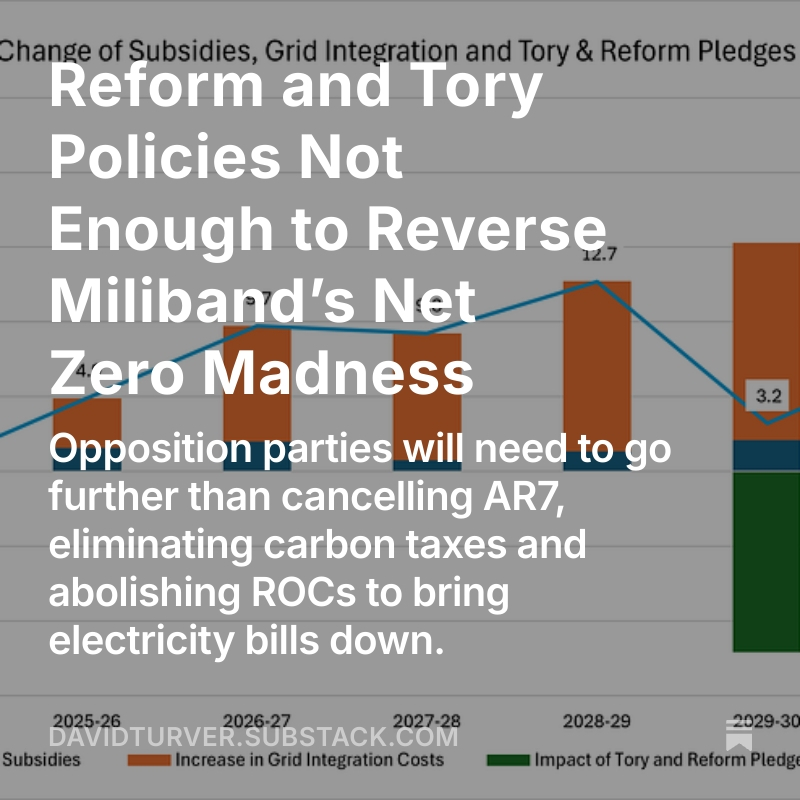
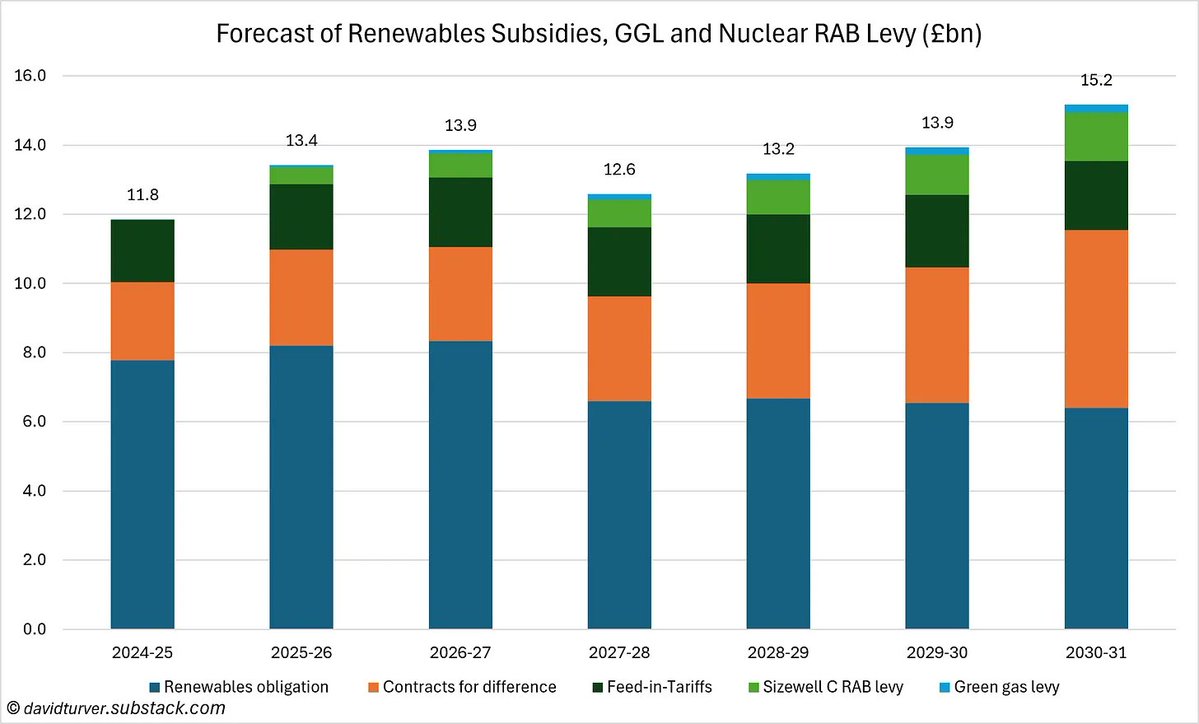
OBR (& DESNZ) forecasts show direct subsidies (ROCs, CfDs, FiTs, Sizewell C, GGL etc.) rising from £11.8bn to £15.2bn by 2030/31 (3/11) Image
OBR and NESO forecasts for grid integration costs (backup, balancing + transmission) explode from £8bn in 2024/25 to £25bn in 2030/31. (4/11) Image
Combined, these costs double from £19.8bn in 2024/25 to a staggering £40.1bn by 2030/31. That’s equivalent to ~£700 extra per household — with no end in sight. (5/11) Image
Reform and Tory policies (cancel AR7, scrap carbon taxes, end ROCs early) are welcome but fall short. If they get in power by Autumn 2028 & fully implement by April 2029 they might manage to cut costs by ~£12bn/yr (6/11). Image
Overall, costs would still be £8.2bn higher than today by 2030/31. (7/11) Image
The claim that more renewables = cheaper bills is false. Gas for power costs ~£5bn and is trivial compared to the renewable subsidy + grid overhead. We’re de-industrialising and paying a fortune for unreliable power. (8/11)
UK has the highest industrial electricity prices in the world. Continuing this path risks economic catastrophe. Drastic action - far beyond current opposition plans - is needed. Laws need to be repealed, subsidies removed, contracts broken and assets left stranded (9/11)
Net Zero must be stopped. The pain of reversing subsidies and ending contracts for the green industrial complex will be tiny compared to the pain being inflicted on the rest of the economy by sky-high energy prices. (10/11)
If you enjoyed this thread, please like and share. You can sign up for free to read the full article on the link below (11/11):
open.substack.com/pub/davidturve…Image
Hi @threadreaderapp unroll please.

• • •

Missing some Tweet in this thread? You can try to force a refresh
 

Keep Current with David Turver

David Turver Profile picture

Stay in touch and get notified when new unrolls are available from this author!

Read all threads

This Thread may be Removed Anytime!

PDF

Twitter may remove this content at anytime! Save it as PDF for later use!

Try unrolling a thread yourself!

how to unroll video
  1. Follow @ThreadReaderApp to mention us!

  2. From a Twitter thread mention us with a keyword "unroll"
@threadreaderapp unroll

Practice here first or read more on our help page!

More from @7Kiwi

May 24
The UK government loves celebrating how it has halved emissions since 1990. But is it real… or just clever accounting? My new thread exposing how official claims of emissions reduction are cooking the books. (1/8) Image
Official figures show ~49% territorial CO₂ cuts. But look at consumption emissions (what we actually use, including imports): only ~27% reduction. (2/8) Image
Much of the “success” comes from destroying UK industry. Industrial energy use down over 40%. We’re not greening the economy — we’re de-industrialising and both energy and electricity generation are down sharply. (3/8) Image
Read 9 tweets
May 17
UK energy policy is economic self-harm. Labour banning new North Sea drilling licences + fracking — right as the Strait of Hormuz crisis hits. Yet oil & gas extraction is one of our MOST productive industries. A thread (1/10) Image
UK per capita energy consumption has fallen 2.4% per year — faster than most G7 countries. Result? GDP per capita growth is a miserable 0.4% annually. Energy is the foundation of modern economies. Without abundant supply, we stagnate. (2/10) Image
Globally, GDP per capita grows ~2% with rising energy use. Asia boomed by embracing energy-intensive growth. Britain chose “energy austerity” instead — and now uses less energy per person than Poland or Malaysia. This is a self-inflicted wound. (3/10) Image
Read 11 tweets
May 10
Renewables funds like Greencoat UK Wind (UKW), Octopus Renewables (ORIT) & The Renewables Infrastructure Group (TRIG) market themselves as low-risk investments. But plunging share prices and wide discounts to NAV suggest management in denial. A thread (1/11) $UKW, $ORIT and $TRIG in denial about the risks of net zero energy policy changes.
Labour govt changes: ROC indexation cut (RPI to CPI) & Carbon Price Support removal in 2028. Funds took NAV hits but downplayed them. New Wholesale CfDs offered as partial offset. These are minor vs. what could come from Reform & Tories. (2/11)
Bigger risks: Tories & Reform pledge to scrap Net Zero elements. Remove CPS + ETS (carbon taxes boosting wholesale prices), abolish ROC scheme early. This would slash revenues for ROC-dependent assets far more than current tweaks, further impacting NAV & share prices. (3/11) Plunging share prices for ORIT, TRIG and UKW
Read 12 tweets
May 8
Yesterday, @EnergyUKcomms caught a bad case of Net Zero Derangement Syndrome by claiming that removing carbon taxes will increase bills. A thread (1/n) Image
They first claimed that decarbonisation and economic growth go hand-in-hand. But data from OWID shows that faster decarbonisation leads to slower growth (2/n) Image
They went on to claim that scrapping the Emissions Trading Scheme (ETS) would increase gas demand by 25%. This claim would mean almost doubling the amount of gas used for electricity, which is implausible (3/n) Image
Read 9 tweets
May 3
The Government said they reduced the indexation rate for renewables because they'd been over-compensated. That's not even half the story.
New analysis shows wind farms have already received more in subsidy than the build cost, enriching overseas investors. A thread (1/n) Image
Starting with the six offshore wind farms that have received most subsidies under the ROC scheme: Greater Gabbard, Gwynt y Mor, London Array, Race Bank, Sheringham Shoal and West of Duddon Sands (WODS). (2/n) Greater Gabbard, London Array, Race Bank, Sheringham Shoal and West of Duddon Sands (WODS) wind farms received more in subsidy that it cost to build them
Greater Gabbard has received £2.2bn in subsidies but it only cost £1.4bn to build it (exc. OFTO sale proceeds). London Array has received £2.9bn in subsidies but net cost as ~£2.3bn. WODS received £1.8bn subsidies vs £1.1bn net cost (3/n)
Read 11 tweets
Apr 26
🚨UK Net Zero & energy subsidies have exploded to £585 BILLION 🚨

Our taxes funding unreliable renewables, backups, carbon capture & subsidies to use the expensive energy. A new update to the Subsidy Control Database exposes the scale of the madness. (1/11) Image
Breakdown of the insanity:
- Renewables Obligation (ROCs): £104bn
- Contracts for Difference (CfDs): £102bn inc. £40bn for AR7
- £31bn for FiTs

In total over £260bn to subsidise renewables that don’t produce when we need it most, or FIVE Hinkley Point C’s (2/11)
Wind and solar are intermittent, so we pay another £72bn for the Capacity Market – backup power for when the wind doesn’t blow or sun doesn’t shine. And a further £1bn to subsidise making turbines. (3/11)
Read 12 tweets

Did Thread Reader help you today?

Support us! We are indie developers!


This site is made by just two indie developers on a laptop doing marketing, support and development! Read more about the story.

Become a Premium Member ($3/month or $30/year) and get exclusive features!

Become Premium

Don't want to be a Premium member but still want to support us?

Make a small donation by buying us coffee ($5) or help with server cost ($10)

Donate via Paypal

Or Donate anonymously using crypto!

Ethereum

0xfe58350B80634f60Fa6Dc149a72b4DFbc17D341E copy

Bitcoin

3ATGMxNzCUFzxpMCHL5sWSt4DVtS8UqXpi copy

Thank you for your support!

Follow Us!

:(