Ratios are essential to analyze a company.
Here are 12 Financial Ratios every investor should understand:
Here are 12 Financial Ratios every investor should understand:

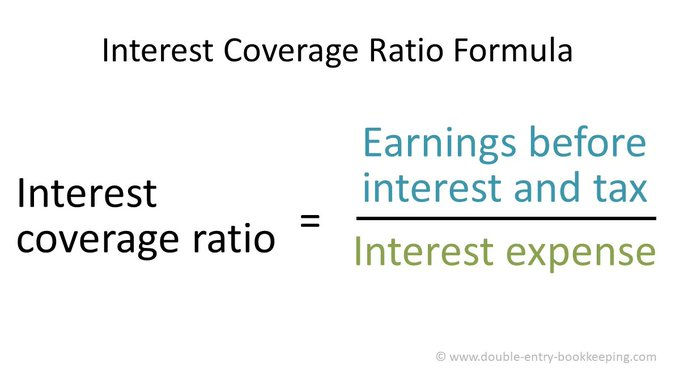
1. Interest coverage: ratio used to determine how easily a company can pay the interest on its outstanding debt.
The higher this ratio, the better.
Seek for companies with an interest coverage ratio higher than 5.
The higher this ratio, the better.
Seek for companies with an interest coverage ratio higher than 5.

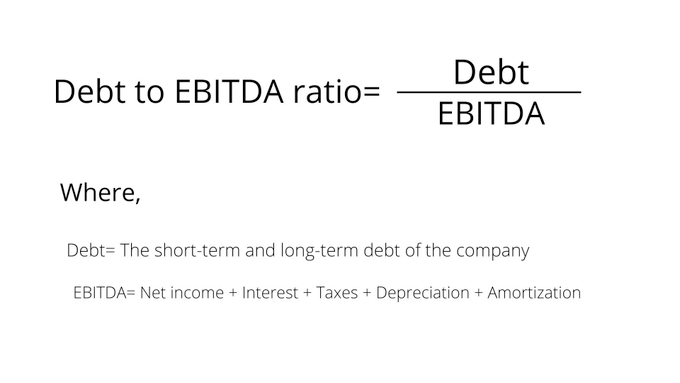
2. Net Debt / EBITDA
Shows how many years it takes for a company to pay off its debt when it would use all EBITDA to pay down debt.
The lower this ratio, the better.
You want the Net Debt / EBITDA to be lower than 4.
Shows how many years it takes for a company to pay off its debt when it would use all EBITDA to pay down debt.
The lower this ratio, the better.
You want the Net Debt / EBITDA to be lower than 4.
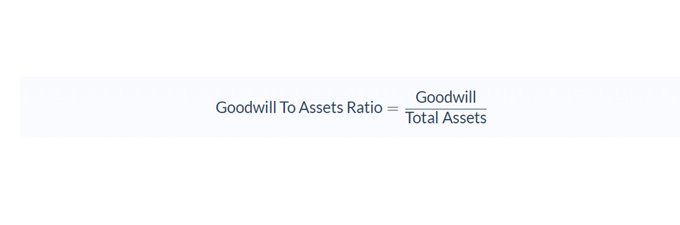
3. Goodwill / assets
Goodwill is an accounting metric which shows the difference between the money that a company paid for acquiring a company and its book value.
The higher this ratio, the higher the risk for you as an investor.
Goodwill is an accounting metric which shows the difference between the money that a company paid for acquiring a company and its book value.
The higher this ratio, the higher the risk for you as an investor.
4. CAPEX/Sales
The CAPEX/Sales ratio measures the capital intensity of a company.
You want to invest in companies which don't require a lot of capital to operate.
Ideally, the CAPEX/Sales is lower than 10%.
The CAPEX/Sales ratio measures the capital intensity of a company.
You want to invest in companies which don't require a lot of capital to operate.
Ideally, the CAPEX/Sales is lower than 10%.
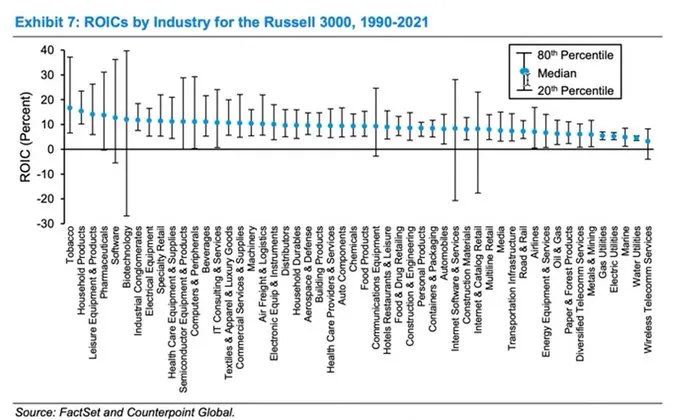
5. Return on Invested Capital (ROIC)
The ROIC is one of the most important financial ratios for investors.
Companies only create value when their ROIC is higher than their WACC.
The higher the ROIC, the better.
Look for companies with a ROIC > 15%.
The ROIC is one of the most important financial ratios for investors.
Companies only create value when their ROIC is higher than their WACC.
The higher the ROIC, the better.
Look for companies with a ROIC > 15%.

6. Gross Margin
The higher the gross margin of a company, the better.
When a company has a high and consistent gross margin, it is a great indication that the company has a competitive advantage.
The higher the gross margin of a company, the better.
When a company has a high and consistent gross margin, it is a great indication that the company has a competitive advantage.

7. Free cash flow margin
The FCF margin shows how much revenues are translated in pure cash for the company.
The higher, the better.
Seek for companies with a FCF margin > 10%.
The FCF margin shows how much revenues are translated in pure cash for the company.
The higher, the better.
Seek for companies with a FCF margin > 10%.

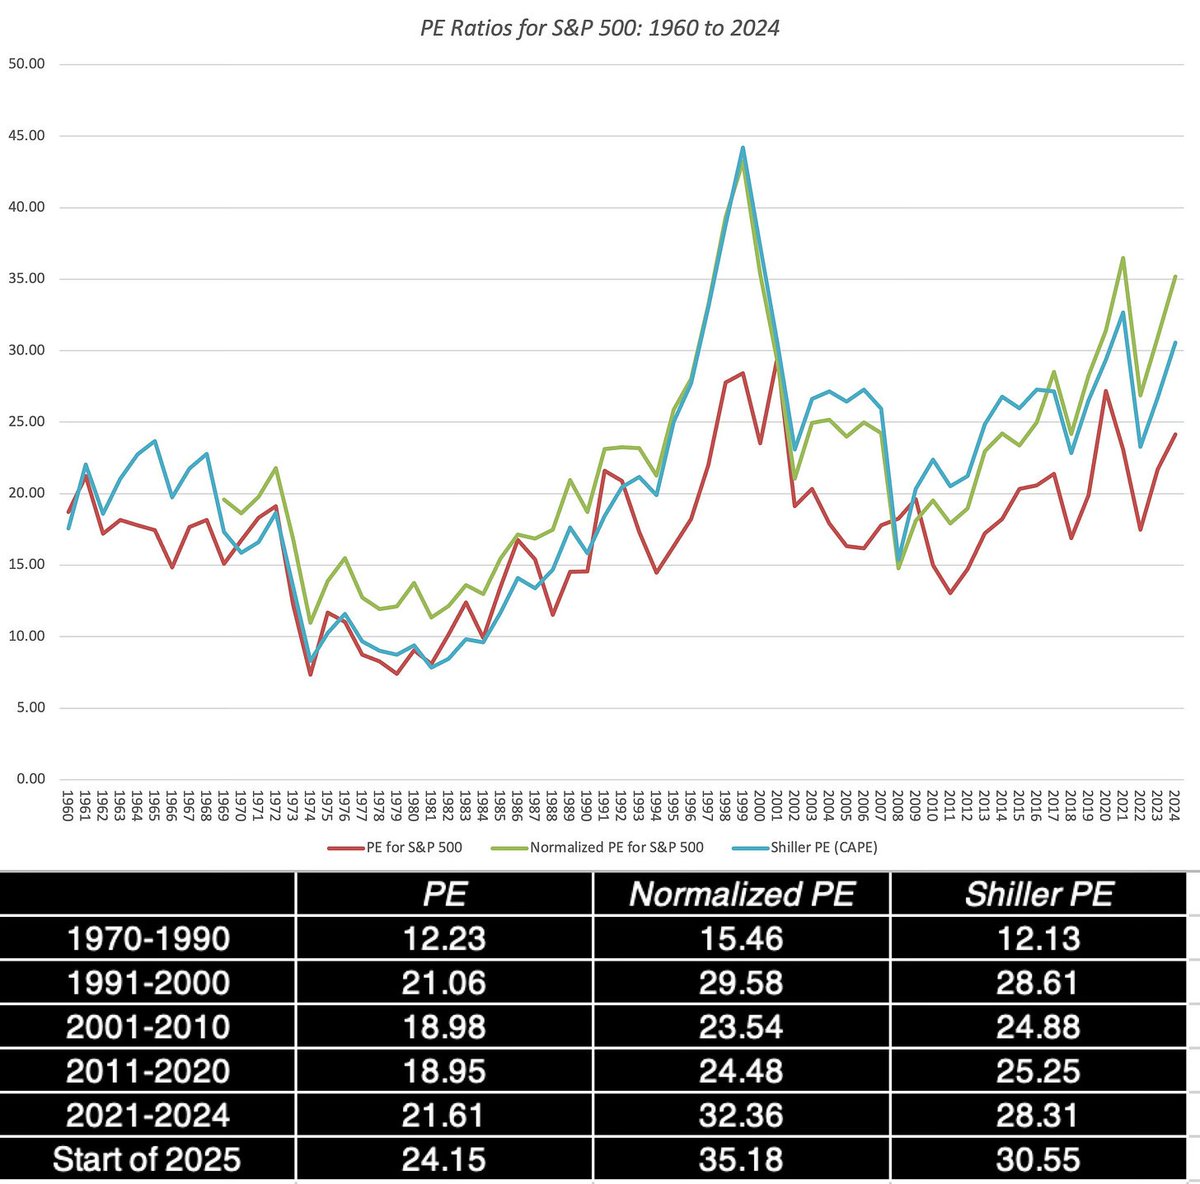
8. Price-earnings (P/E)
This ratio shows how much you are paying for a company in terms of earnings.
Prefer to buy companies which are trading below their average P/E of the past 5 years.
This ratio shows how much you are paying for a company in terms of earnings.
Prefer to buy companies which are trading below their average P/E of the past 5 years.

9. Free cash flow yield
The FCF Yield compares the free cash flow per share of a company with its stock price.
The higher this ratio, the better.
In general, the FCF yield is more robust than the P/E ratio.
The FCF Yield compares the free cash flow per share of a company with its stock price.
The higher this ratio, the better.
In general, the FCF yield is more robust than the P/E ratio.

10. Historical revenue growth: seek for companies which managed to grow their revenue by at least 7% over the past 5 years.
11. Historical earnings growth: look for companies which managed to grow their earnings per share (EPS) by at least 10% per year over the past 5 years.
11. Historical earnings growth: look for companies which managed to grow their earnings per share (EPS) by at least 10% per year over the past 5 years.
12. Outlook: Take a quick look at the consensus of management and/or analysts.
Usually, companies give guidance about which growth they are expecting in the near future.
You can also look at analysts estimates to get an indication.
Usually, companies give guidance about which growth they are expecting in the near future.
You can also look at analysts estimates to get an indication.
That's it for today.
If you liked this, you'll love our free course.
The course will teach you how to read Financial Statements like a professional.
Grab it for free here: compounding-quality.kit.com/fe672cea22
If you liked this, you'll love our free course.
The course will teach you how to read Financial Statements like a professional.
Grab it for free here: compounding-quality.kit.com/fe672cea22
• • •
Missing some Tweet in this thread? You can try to
force a refresh